
Volume expansion is used in patients with hemodynamic insufficiency in an attempt to improve cardiac output. Finding criteria to predict fluid responsiveness would be helpful to guide resuscitation and to avoid excessive volume effects.
Static and dynamic indicators have been described to predict fluid responsiveness under certain conditions.
In this review we define preload and preload-responsiveness concepts.
A description is made of the characteristics of each indicator in patients subjected to mechanical ventilation or with spontaneous breathing.
El aporte de volumen es de especial interés en los pacientes ingresados en cuidados intensivos con inestabilidad hemodinámica en los que buscamos optimizar el gasto cardiaco. La predicción de la respuesta a esta expansión de volumen, evaluando el grado de precarga-dependencia nos permitiría realizar una reanimación guiada evitando los efectos deletéreos del volumen.
Actualmente, disponemos de parámetros tanto estáticos como dinámicos que identifican esta precarga-dependencia en diferentes escenarios.
En este capítulo definiremos los conceptos de precarga y precarga-dependencia para luego describir cada uno de los parámetros hemodinámicos conocidos para poder predecir la respuesta a volumen, tanto en pacientes con ventilación mecánica como en respiración espontánea.
Volume expansion constitutes first line treatment in situations of hemodynamic instability, though only 50% of all patients respond to fluid administration with an increase in systolic volume. Moreover, volume expansion can cause pulmonary adverse effects secondary to the increase in extravascular water; emphasis is therefore placed on the importance of using reliable parameters capable of identifying those patients who are likely to respond adequately to volume expansion. Specifically, the hemodynamic parameters proposed for deciding volume administration should be able to identify those patients that will derive benefit from the added volume, increasing their systolic volume (SV) (responders) and, at the same time, should be able to avoid useless (non-responders) and potentially harmful treatment.
In addition to the classical static parameters, in recent years new technologies and new dynamic parameters have been developed that reportedly offer better performance as predictors of patient response to volume expansion.
This chapter describes the physiological concepts related to preload and preload dependency, as well as the available predictive parameters in both mechanical ventilation (MV) and in spontaneous breathing.
Physiological review: concept of preload and preload dependencyPreloadPreload is one of the main determinants of cardiac output (CO). Classically, preload has been defined as the maximum degree of myocardial fiber stretch or tension before the start of ventricular contraction, and is determined by the mean sarcomere length at the end of diastole.1 Clinically, this definition is not practical and is hard to apply; as a result, it is often replaced by more accessible ventricular filling measures such as the intracavitary pressures or end-diastolic volumes. Although none of these parameters precisely reflect cardiac muscle fiber elongation, they offer a more or less valid approximation to the true preload value. Accordingly, ventricular end-diastolic volume is accepted by consensus as a synonym of preload, and in turn under normal conditions the intracardiac pressures are taken to be a substitute for the intracardiac volumes.
Preload dependencyAccording to the Frank–Starling law, there is a positive relationship between preload and systolic volume; accordingly, the greater the ventricular preload (and therefore the degree of cardiac muscle stretch), the greater the systolic volume. However, this relationship, in the same way as in most physiological phenomena in the body, is not linear but rather traces a curve. Accordingly, once a concrete preload value has been reached, further increments do not give rise to significant additional systolic volume elevations.
The graphic representation or plot of this behavior is called the Frank–Starling curve or ventricular function curve (Fig. 1), in which two zones can be distinguished: (a) a slope where minimum preload changes give rise to a marked increase in systolic volume (preload dependency zone); and (b) a flat or level segment where the ejection volume hardly varies with changes in preload (preload independence zone). This curve shows that in order to produce an increase in left systolic volume, both ventricles must be operating in the region of the slope or preload dependency zone of the Frank–Starling curve. If this condition is not met, any treatment measure aiming to increase preload (such as the administration of fluids) will only induce a rise in intracardiac pressures, with no hemodynamic benefits of any kind.

Therefore, the relationship between the changes in preload and systolic volume depends on the morphology and degree of slope or gradient of the Frank–Starling curve, which are determined by the contractile capacity of the heart and the ventricular postload. Thus, for one same increase in preload there will be a variable increase in systolic volume depending on the morphology and the zone in which the two ventricles are operating along the Frank–Starling curve (Fig. 2).

Lastly, it is important to underscore that each individual patient can present a series of ventricle function curves, dependent on the changes in postload or cardiac contractility. Accordingly, a patient in the flat or level segment of the Frank–Starling curve and without a positive response to the administration of fluids, may shift to the sloped portion of the curve with the administration of inotropic drugs prescribed to improve cardiac contractility–thereby improving the response to fluid expansion measures.
Thus, preload dependency is the capacity of the heart to modify systolic volume in response to changes in preload, and depends on the basal preload value and the zone of the Frank–Starling curve in which both ventricles are operating. Accordingly, in order to define a patient as being preload dependent, we must study not only the absolute preload value but also the zone of the ventricle function curve in which the patient's heart is operating.
Patients on mechanical ventilationThe introduction of mechanical ventilation can have a profound impact upon cardiovascular function. Its effect is largely dependent upon the basal hemodynamic conditions of the patient (volemia and cardiac function) and on the magnitude of the changes in intrathoracic pressure. Moreover, mechanical ventilation interferes in a complex and often unpredictable way with the parameters commonly used to evaluate preload,2 further complicating their correct interpretation and application in the fluid administration decision making process. For this reason, and in addition to the classical preload parameters, recently it has been suggested that evaluation should be based on functional measures that dynamically quantify cardiovascular performance, rather than on static physiological variables. By either taking advantage of the changes induced by mechanical ventilation or altering preload through postural maneuvers, these parameters have been shown to be more effective in deciding which patients will stand to benefit from volume expansion, and in which patients inotropic drug use would be more advisable.
Static parameters: filling pressuresThe static parameters of preload dependency yield an absolute preload value comprising all the classical preload measures–both volumetric and pressure.
The failure of these parameters in predicting the response to volume expansion has been demonstrated in many studies, has been the subject of a series of reviews, and remains a subject of controversy to this day.3,4 No significant relationship has been found between responders and non-responders to volume expansion and the basal values corresponding to central venous pressure (CVP) or pulmonary artery occlusion pressure (PAOP) (also known as pulmonary capillary wedge pressure). Despite this fact, these parameters are still used on a routine (and sometimes exclusive) basis in deciding when to administer fluid to the patient, particularly CVP.
Technical considerations apart, the above mentioned failure may be explained among other reasons by the incapacity of the static parameters to adequately measure cardiac preload under all conditions. Many studies have shown that the intravascular pressures can overestimate transmural pressure (i.e., the pressure that distends the cardiac cavities and defines preload) in patients with pulmonary hyperinsufflation, subjected to PEEP (positive end-expiratory pressure) ventilation, or with intraabdominal hypertension.5,6
Volumes and areasThe relationship between the end-systolic pressures and volume depends on the degree of ventricular distensibility. Thus, although under normal conditions the invasive pressure values are considered to offer a valid approximation of the end-diastolic volumes, under certain conditions this relationship can be altered. Accordingly, for one same end-diastolic volume, the intravascular pressure will depend on distensibility, but not on the real preload value. Despite this limitation, the volumes offer a better estimation of preload, even if they are not good predictors of response to volume expansion. Thermodilution techniques can be used to obtain several indices:
- –
The global end-diastolic volume index (GEDVi) allows us to evaluate biventricular preload. The percentage of responders with values of <600ml/m2 is 80%, while the percentage of responders with values of >800ml/m2 is 30%. However, we cannot distinguish between responders and non-responders in the intermediate value ranges.7
- –
The right ventricle end-diastolic volume index (RVEDVi), obtained using a pulmonary artery catheter with a rapid response thermistor, predicts a response to volume expansion with values of <90ml/m2. In contrast, values of >140ml/m2 predict an absence of response, while intermediate values between 90 and 140ml/m2 likewise do not allow us to distinguish between responders and non-responders.8,9
Echocardiography (both transthoracic and transesophageal) affords very reliable measures of ventricle end-diastolic surface, but these values are poor predictors of response to volume. Only a low left ventricle end-diastolic surface value (<5cm2/m2) has been identified as being very specific of low preload, though the sensitivity is poor. In contrast, important right ventricle dilatation (right ventricle end-diastolic surface/left ventricle end-diastolic surface (RVEDS/LVEDS)≥1) effectively represents a contraindication to volume expansion, since it is indicative of severe right ventricle impairment.10,11
Lastly, and perhaps most importantly, the cardiovascular response to the administration of volume is determined not only by the initial value or magnitude of the increase in preload but also by the patient ventricle function. Accordingly, for one same preload value, there will be a variable increase in cardiac output depending on the existing ventricle function or the morphology of the Frank–Starling curve. In this context, an isolated measure of preload (whether volumetric or pressure based), independently of the accuracy and precision of the method used, is unable to reliably predict the response of cardiac output if we previously do not know the ventricle function curve and the zone of the curve in which the patient's heart is operating. Consequently, any new technological method aiming to improve the estimation of preload, regardless of its accuracy and precision, would always be limited by this physiological conditioning factor.12
Dynamic parametersIn contrast to the static measures, the dynamic parameters of preload dependency offer a functional evaluation of cardiac performance in response to transient changes in preload, allowing us to obtain a moving snapshot of heart function. The dynamic parameters therefore do not estimate preload or afford information regarding volemia; rather, they quantify cardiac response to variations in preload, allowing us to determine the zone of the Frank–Starling curve in which the two ventricles are operating.
Regardless of the method used, the dynamic parameters of preload dependency are the transient expression of cardiac output or systolic volume in response to a generally reversible and short-lasting change in cardiac preload. The magnitude of this change moreover allows us to quantify the degree of preload dependency. Accordingly, the greater the mentioned variation or change, the greater the degree of preload dependency, and therefore for the greater increase, we can expect from the administration of volume.
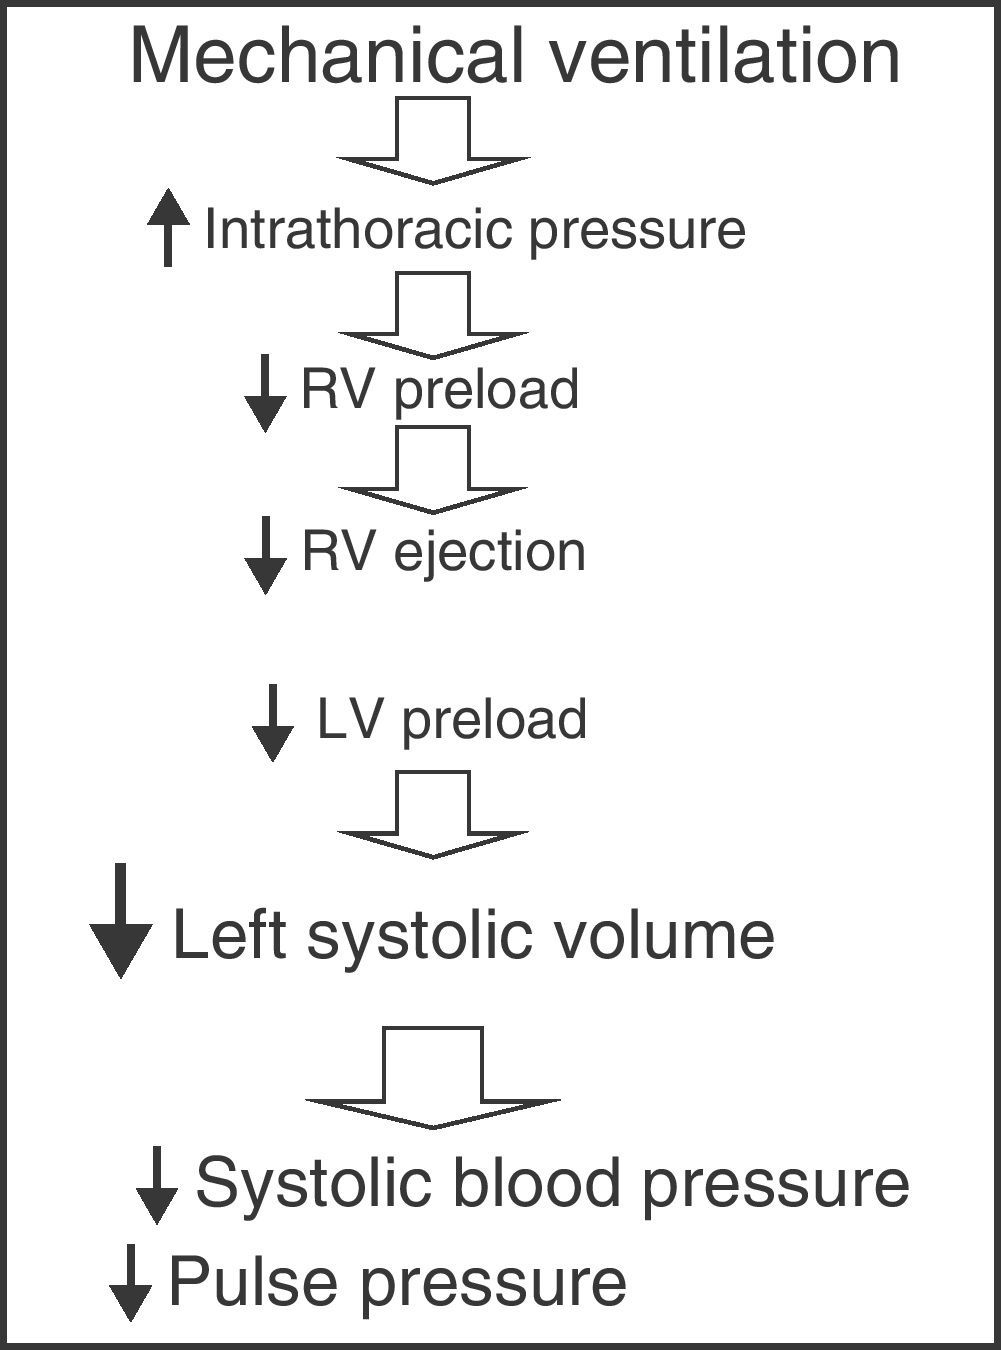
Parameters derived from the respiratory variations in left ventricle systolic volumeMechanical ventilation with intermittent positive pressure induces cyclic changes in left ventricle systolic volume. During inspiration, the increase in intrathoracic pressure caused by mechanical insufflation decreases right ventricle preload by complicating venous return, thus giving rise to a decrease in right ventricle ejection volume. On the other hand, the blood volume contained in the pulmonary circuit is impulsed towards the left ventricle, increasing its preload and ejection volume during the inspiratory phase. Posteriorly, after completing the pulmonary transit time, the decrease in right ventricle systolic volume results in a drop in left ventricle filling and a decrease in its ejection volume during the expiratory phase. Therefore, mechanical ventilation with positive pressure produces cyclic changes in left ventricle systolic volume characterized by an increase during the inspiratory phase and a decrease during the expiratory phase (Fig. 3).13,14 The magnitude of these oscillations is proportional to the degree of preload dependency of the patient; accordingly, the greater these variations, the greater the susceptibility to changes in preload and the greater the expected increase in cardiac output following the administration of fluids.15 In contrast, if either ventricle (or both ventricles) operate over the flat or level segment of the Frank–Starling curve, the respiratory variations in left-side systolic volume would be minimal, and therefore no significant rise in cardiac output would be expected as a result of fluid administration. For this reason these oscillations have been used to predict the response to volume administration in patients subjected to mechanical ventilation, and their efficacy–superior to that of the static parameters of preload dependency–has been repeatedly confirmed in different scenarios and disease conditions.4,16

Since measurement of the variations in systolic volume (VSV=SVmax−SVmin/SVmax+Vmin/2×100) requires their beat-by-beat recording during a respiratory cycle, and this is difficult to do at the patient bedside, different parameters have been proposed with behaviors and magnitudes similar to the real variations in systolic volume, and with a capacity to predict patient response to volume expansion that has also been shown to be effective. With the introduction of hemodynamic monitorization devices based on arterial pulse wave analysis (PiCCO®, LidCO®, Vigileo®, MostCare®, among others), the estimation of this parameter has become possible in a simple and continuous manner–yielding results that are both satisfactory and superior to those afforded by the static preload values.16 Accordingly, VSV>10% is predictive of a positive response to the administration of volume, with high sensitivity and specificity in most studies published to date.
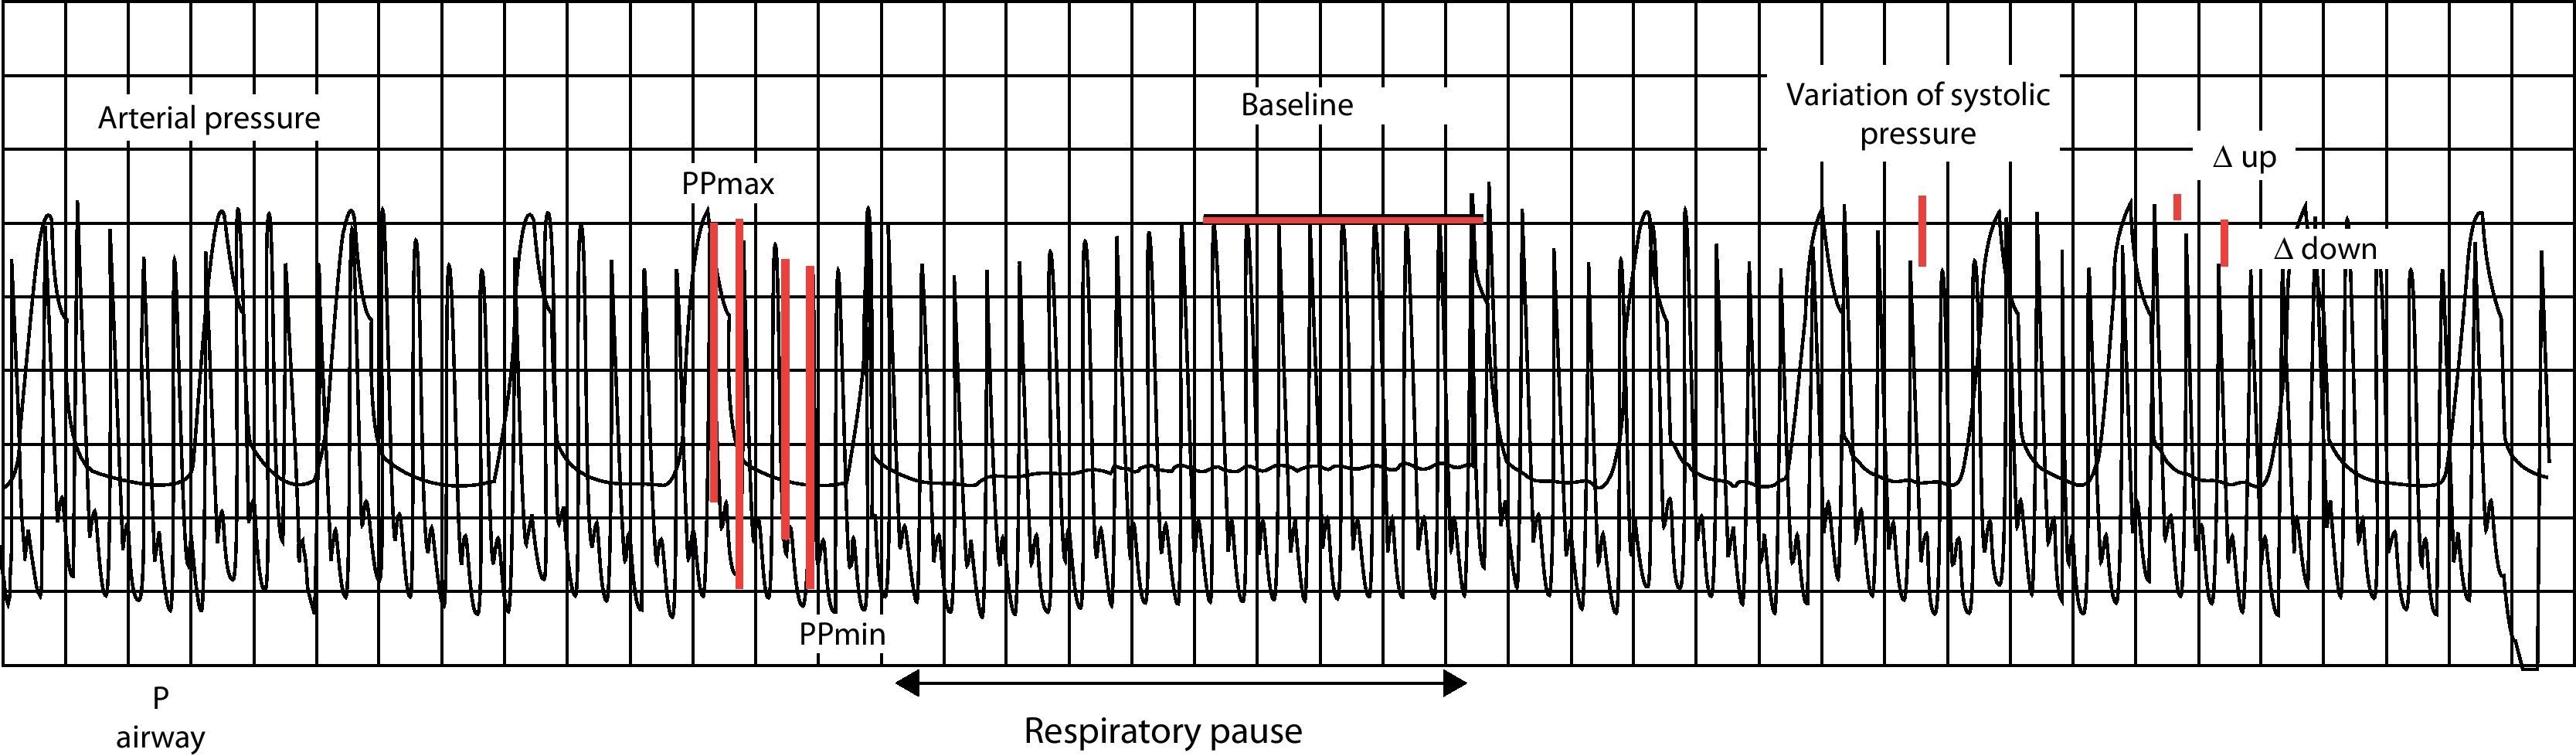
Likewise, since the arterial pulse pressure (the difference between systolic and diastolic pressure) is directly related to left systolic volume, on assuming that arterial distensibility does not vary in the course of a respiratory cycle, the changes in arterial pulse pressure during this period of time should exclusively reflect the variations in systolic volume (Fig. 4). Thus, the differences observed in the arterial pulse pressure wave during a respiratory cycle should reflect the physiological variations in systolic volume produced by mechanical ventilation, and the magnitude of these variations should reflect the degree of cardiac preload dependency. Considering that it is also an easily obtainable direct measurement, variation in arterial pulse pressure (VPP=PPmax−PPmin/PPmax+PPmin/2×100) could offer a certain technical advantage as an index of preload dependency, having demonstrated its usefulness as a predictor of fluid administration response in many studies.13,16 Accordingly, a value of VPP≥13% allows us to discriminate the response to volume expansion in patients subjected to mechanical ventilation, with a high degree of efficacy.
 produced by mechanical ventilation. The figure shows the cyclic changes in blood (arterial) pressure (BP) produced by mechanical ventilation. VSP: difference between maximum and minimum systolic blood pressure. Baseline: systolic blood pressure value during an expiratory pause. The baseline is taken as reference for dividing the VSP into two components: Δup and ΔDown. Δup: difference between the maximum value and reference value of BP (reflects the inspiratory increase in BP secondary to an early increase in left ventricle preload). ΔDown: difference between the reference value and minimum value of BP (reflects the decrease in BP secondary to a decrease in left ventricle preload during the expiratory period). PP: pulse pressure.")
Cyclic changes in blood pressure (BP) produced by mechanical ventilation. The figure shows the cyclic changes in blood (arterial) pressure (BP) produced by mechanical ventilation. VSP: difference between maximum and minimum systolic blood pressure. Baseline: systolic blood pressure value during an expiratory pause. The baseline is taken as reference for dividing the VSP into two components: Δup and ΔDown. Δup: difference between the maximum value and reference value of BP (reflects the inspiratory increase in BP secondary to an early increase in left ventricle preload). ΔDown: difference between the reference value and minimum value of BP (reflects the decrease in BP secondary to a decrease in left ventricle preload during the expiratory period). PP: pulse pressure.
In addition to VSV and VPP, there is also a range of dynamic parameters which while sharing a common physiological basis are characterized according to the biological signal studied. The parameters derived from the analysis of arterial pressure, such as the respiratory variation of systolic arterial pressure (VSP) with its ΔDown component (systolic blood pressure (SBP) in end-expiratory pause–minimum SBP), are also useful, though they are of lesser predictive value. Other options are the variation of aortic blood flow velocity recorded by esophageal Doppler ultrasound (ΔABF),17,18 pressure wave variation measured by pulsioximetry (ΔPplet),19,20 the variation of peak velocity or the aortic flow velocity-time integral (ΔVtiaortic or ΔVpeakaortic),21,22 the varation of brachial flow (ΔVpeakbrachial),23 etc.
LimitationsBefore incorporating these parameters to our decision making processes, it is important to know their main limitations:
- 1.
The need for controlled mechanical ventilation, moreover without spontaneous respiratory activity on the part of the patient–since the pressure generated during spontaneous breathing would overlap with the effect of the respirator–makes interpretation difficult.
- 2.
Frequent cardiac arrhythmias or extrasystoles interfere with the analysis and calculation of these measures, and consequently these parameters should not be used when such alterations are present.
- 3.
Since significant modification of intrathoracic pressure is required to effectively alter cardiac preload, the patient must be ventilated with tidal volumes of >8ml/kg ideal weight, since otherwise the sensitivity of these parameters would be less than expected.24,25
- 4.
In the presence of right ventricle dysfunction, the increase in transpulmonary pressure (alveolar pressure–pleural pressure) and the consequent increase in right ventricular postload during inspiration, can give rise to a decrease in right-side ejection volume, with no relation to preload dependency.26 Since in this case the right ventricle would operate in the flat segment of the ventricle function curve, the changes in systolic volume would not be due to the changes in preload but to the cyclic variations in ventricular postload. This could generate false positive situations in which volume administration would not yield the expected hemodynamic effect.27
- 5.
Lastly, it must be remembered that although the patient may respond to volume expansion, this does not necessarily mean that the patient requires added volume. The need to administer fluids should be determined by the presence of signs of hemodynamic instability and organ dysfunction.
If during the inspiratory phase of mechanical ventilation the increase in intrathoracic pressure reduces venous return and right ventricle preload, an end-expiratory occlusion maneuver (such as that used to measure intrinsic PEEP) would facilitate venous return and would increase preload, in the same way as a small volume load.
Recently, Monnet et al.28 have confirmed the validity of this hypothesis in 34 patients with circulatory failure subjected to mechanical ventilation, applying a 15s expiratory pause and observing the changes in arterial pulse pressure and cardiac index. The responders (those showing an increase of >15% in cardiac index after the administration of volume) presented an increase in arterial pulse pressure of 15±15% and an increase in cardiac index of 12±11% during the end-expiratory occlusion maneuver. In contrast, the non-responders showed no significant increase in either of these parameters. An increase of ≥5% in arterial pulse pressure predicted the response to volume expansion with a sensitivity of 87% and a specificity of 100%, while an increase of ≥5% in cardiac index differentiated responders from non-responders with a sensitivity of 91% and a specificity of 100%–the predictive value of both parameters being similar to that of the passive leg raising maneuver.
Vena cava respiratory variationsIn mechanical ventilation, the respiratory variations in the diameter of the inferior vena cava (ΔDIVC) have been shown to predict the response to fluids in patients with circulatory failure.
During the inspiratory phase of mechanical ventilation, the increase in pleural pressure is transmitted towards the right atrium, reducing venous return and dilating the inferior vena cava (IVC). In contrast, during expiration, the decrease in intrathoracic pressure favors venous return and reduces the diameter of the IVC. These variations in diameter of the IVC are more evident in hypovolemic patients and appear to be buffered in hypervolemic patients when the IVC is less distensible.29 ΔDIVC is calculated as the difference between the maximum and the minimum diameter of the IVC in a respiratory cycle, divided by the average of both diameters: DIVC max−DIVC min/(DIVC max+DIVC min)/2×100.
In 39 patients with septic shock subjected to mechanical ventilation, Feissel et al.30 demonstrated that ΔDIVC≥12% is able to predict response to the administration of volume with a positive predictive value of 93% and a negative predictive value of 92%. Likewise, in a study published the same year by Barbier et al.,31 a value of ≥18% in the inferior vena cava collapsibility index was able to identify responders to volume expansion with high sensitivity and specificity. Moreover, in both studies, the magnitude of the respiratory variations in the diameter of the IVC was correlated to the posterior increase in cardiac output following volume expansion. It therefore proved possible not only to characterize the patients according to their response in terms of cardiac output, but also to quantify the degree of preload dependency.
In the superior vena cava (SVC), during the inspiratory phase the rise in pleural pressure lowers the transmural pressure, reducing the diameter of the SVC. If the intravascular pressure (CVP) is sufficiently low, the transmural pressure can become negative and the SVC can collapse entirely during inspiration, as has been observed in hypovolemic patients.29 In a series of 66 patients with septic shock, Vieillard-Baron et al.32 showed that a SVC collapsibility index of >36%, determined by transesophageal echocardiography, is able to identify the responders (defined as those showing an increase of ≥11% in cardiac index after volume expansion) with a sensitivity of 90% and a specificity of 100%.
Patients with spontaneous breathingIn spontaneous breathing, the changes in intrathoracic pressures may not be sufficiently important to significantly affect preload; as a result, most of the parameters used in mechanical ventilation with positive pressure for predicting the response to volume expansion cannot be applied in this situation.
Most of the studies that have evaluated the parameters of response to volume expansion focus mainly on patients subjected to mechanical ventilation without inspiratory effort. Few studies have been carried out under conditions of spontaneous breathing, and most involve a limited number of patients.
Static parametersIn the same way as in patients on mechanical ventilation, the static parameters have been shown to be poor predictors of response to volume expansion.
Filling pressuresCentral venous pressure (CVP) and pulmonary artery occlusion pressure (PAOP) (also known as pulmonary capillary wedge pressure) reflect the end-diastolic pressure of the right and left ventricles, respectively. Due to the influence of the respiratory cycle, it has been agreed that these pressures should be measured in the end-expiratory period in order to minimize the effect of the intrathoracic pressure.
Most studies8,33–36 evaluating CVP before and after volume expansion have included few patients under spontaneous breathing conditions. In the two studies34,35 that reported a lower basal value in responders than in non-responders, the individuals with spontaneous breathing represented 6% and 33%, respectively.
In addition, overlapping of the individual values did not allow the definition of a value or cutoff point capable of predicting response to the administration of fluids. Despite the above, it is considered that very low values (<5mmHg) may effectively be regarded as predictive of a positive response to volume expansion.10
In the case of PAOP, most studies including patients under spontaneous breathing conditions and which have explored the basal values and values after volume expansion have reported no significantly lower basal values among the responders.8,33,34,37 In the only study35 evidencing a relationship between low basal PAOP and responder status, only 6% of the included patients presented spontaneous breathing. In addition, it likewise has not been possible to identify a lower cutoff point as a predictor of response to volume expansion. Nevertheless, it is accepted that a value of <7mmHg may be regarded as a predictor of response to volume administration.10 As regards the upper limits that could determine the absence of response, no cutoff point has been established, due to the inherent limited applicability of volume expansion in patients with high filling pressures.4,38
On the other hand, none of the parameters estimating filling pressures by echo-Doppler are sufficiently reliable to predict patient response to volume expansion. A recent study has shown that the ratio between transmitral flow velocity and mitral annular flow velocity in early diastole (E/Ea), taken to be the best estimation of left ventricle filling pressure, likewise does not allow us to distinguish between responders and non-responders (sensitivity 60%, specificity 55%).39
Volumes and areasIn general terms, volumes offer a better estimation of preload than pressures, but are not good as predictors of response to volume expansion, as in the context of mechanical ventilation.
In the two studies8,9 referred to the right ventricle end-diastolic volume index (RVEDVi), the percentage of patients with spontaneous breathing reached 24% and 31%, the absence of response being identified with RVEDVi>140ml/m2, and response with values of <90ml/m2.
As regards the left ventricle end-diastolic surface or area (LVEDS), the existing data show that in patients with spontaneous breathing, the area calculated from transthoracic echocardiography is unable to discriminate between responders and non-responders.40
Measurement of the diameter of the inferior vena cava (DIVC) at sub-xiphoid window level in the end-expiratory phase also yields information. When the value is very low (DIVC<12mm), it can predict a positive response to volume expansion. In contrast, a very large diameter (>20mm) can predict the absence of response.10
Dynamic parametersAs has been commented above, the dynamic parameters derived from the arterial pressure curve have only been validated in patients subjected to mechanical ventilation and in sinus node rhythm. Nevertheless, in recent years some maneuvers have been described that allow us to assess preload dependency of patients with spontaneous breathing and/or some type of arrhythmia.
Variation of right atrial pressure (ΔRAP)In spontaneous breathing, venous return increases as a result of the rise in negative intrathoracic pressure. If the right ventricle is preload dependent, it pumps this increase in flow towards the pulmonary circulation–with a consequent rise in left ventricle filling and ejection. Therefore, the right atrial pressure (RAP) would decrease with each inspiratory effort with the drop in intrathoracic pressure. The absence of a respiratory decrease in RAP would indicate that the heart is operating over the flat segment of the ventricular pressure–volume curve, which is not preload dependent, and that volume expansion would not increase cardiac output. Magder et al.37 reported a correlation between RAP reduction >1mmHg in the inspiratory phase and the response to volume expansion, but this study only included 33 patients (14 with spontaneous breathing and 19 on MV with inspiratory effort), and the findings have not been reproduced in posterior studies.41
Parameters derived from variations of arterial pulse wave pressureThe parameters derived from the arterial pressure curve, such as VPP, have been shown to be poor predictors of response to volume expansion in patients with spontaneous breathing or subjected to triggering. Such parameters have even been reported to be poorer than static indices such as filling pressures. In a study involving 71 ventilated patients, a variation in pressure of pulse (VPP) of ≥12% reduced its specificity to 46% in the 31 patients with spontaneous breathing.42
Soubrier et al.43 attempted to improve the sensitivity of these dynamic indicators by means of a forced respiration maneuver, though to no avail. They found that a VPP of >12% offers high specificity (92%) but low sensitivity (63%) in distinguishing responders from non-responders. On performing forced respiration, the sensitivity dropped to 21%, with preservation of the same specificity. This finding could be of clinical importance considering the high specificity in responders, though further confirmatory studies are needed.
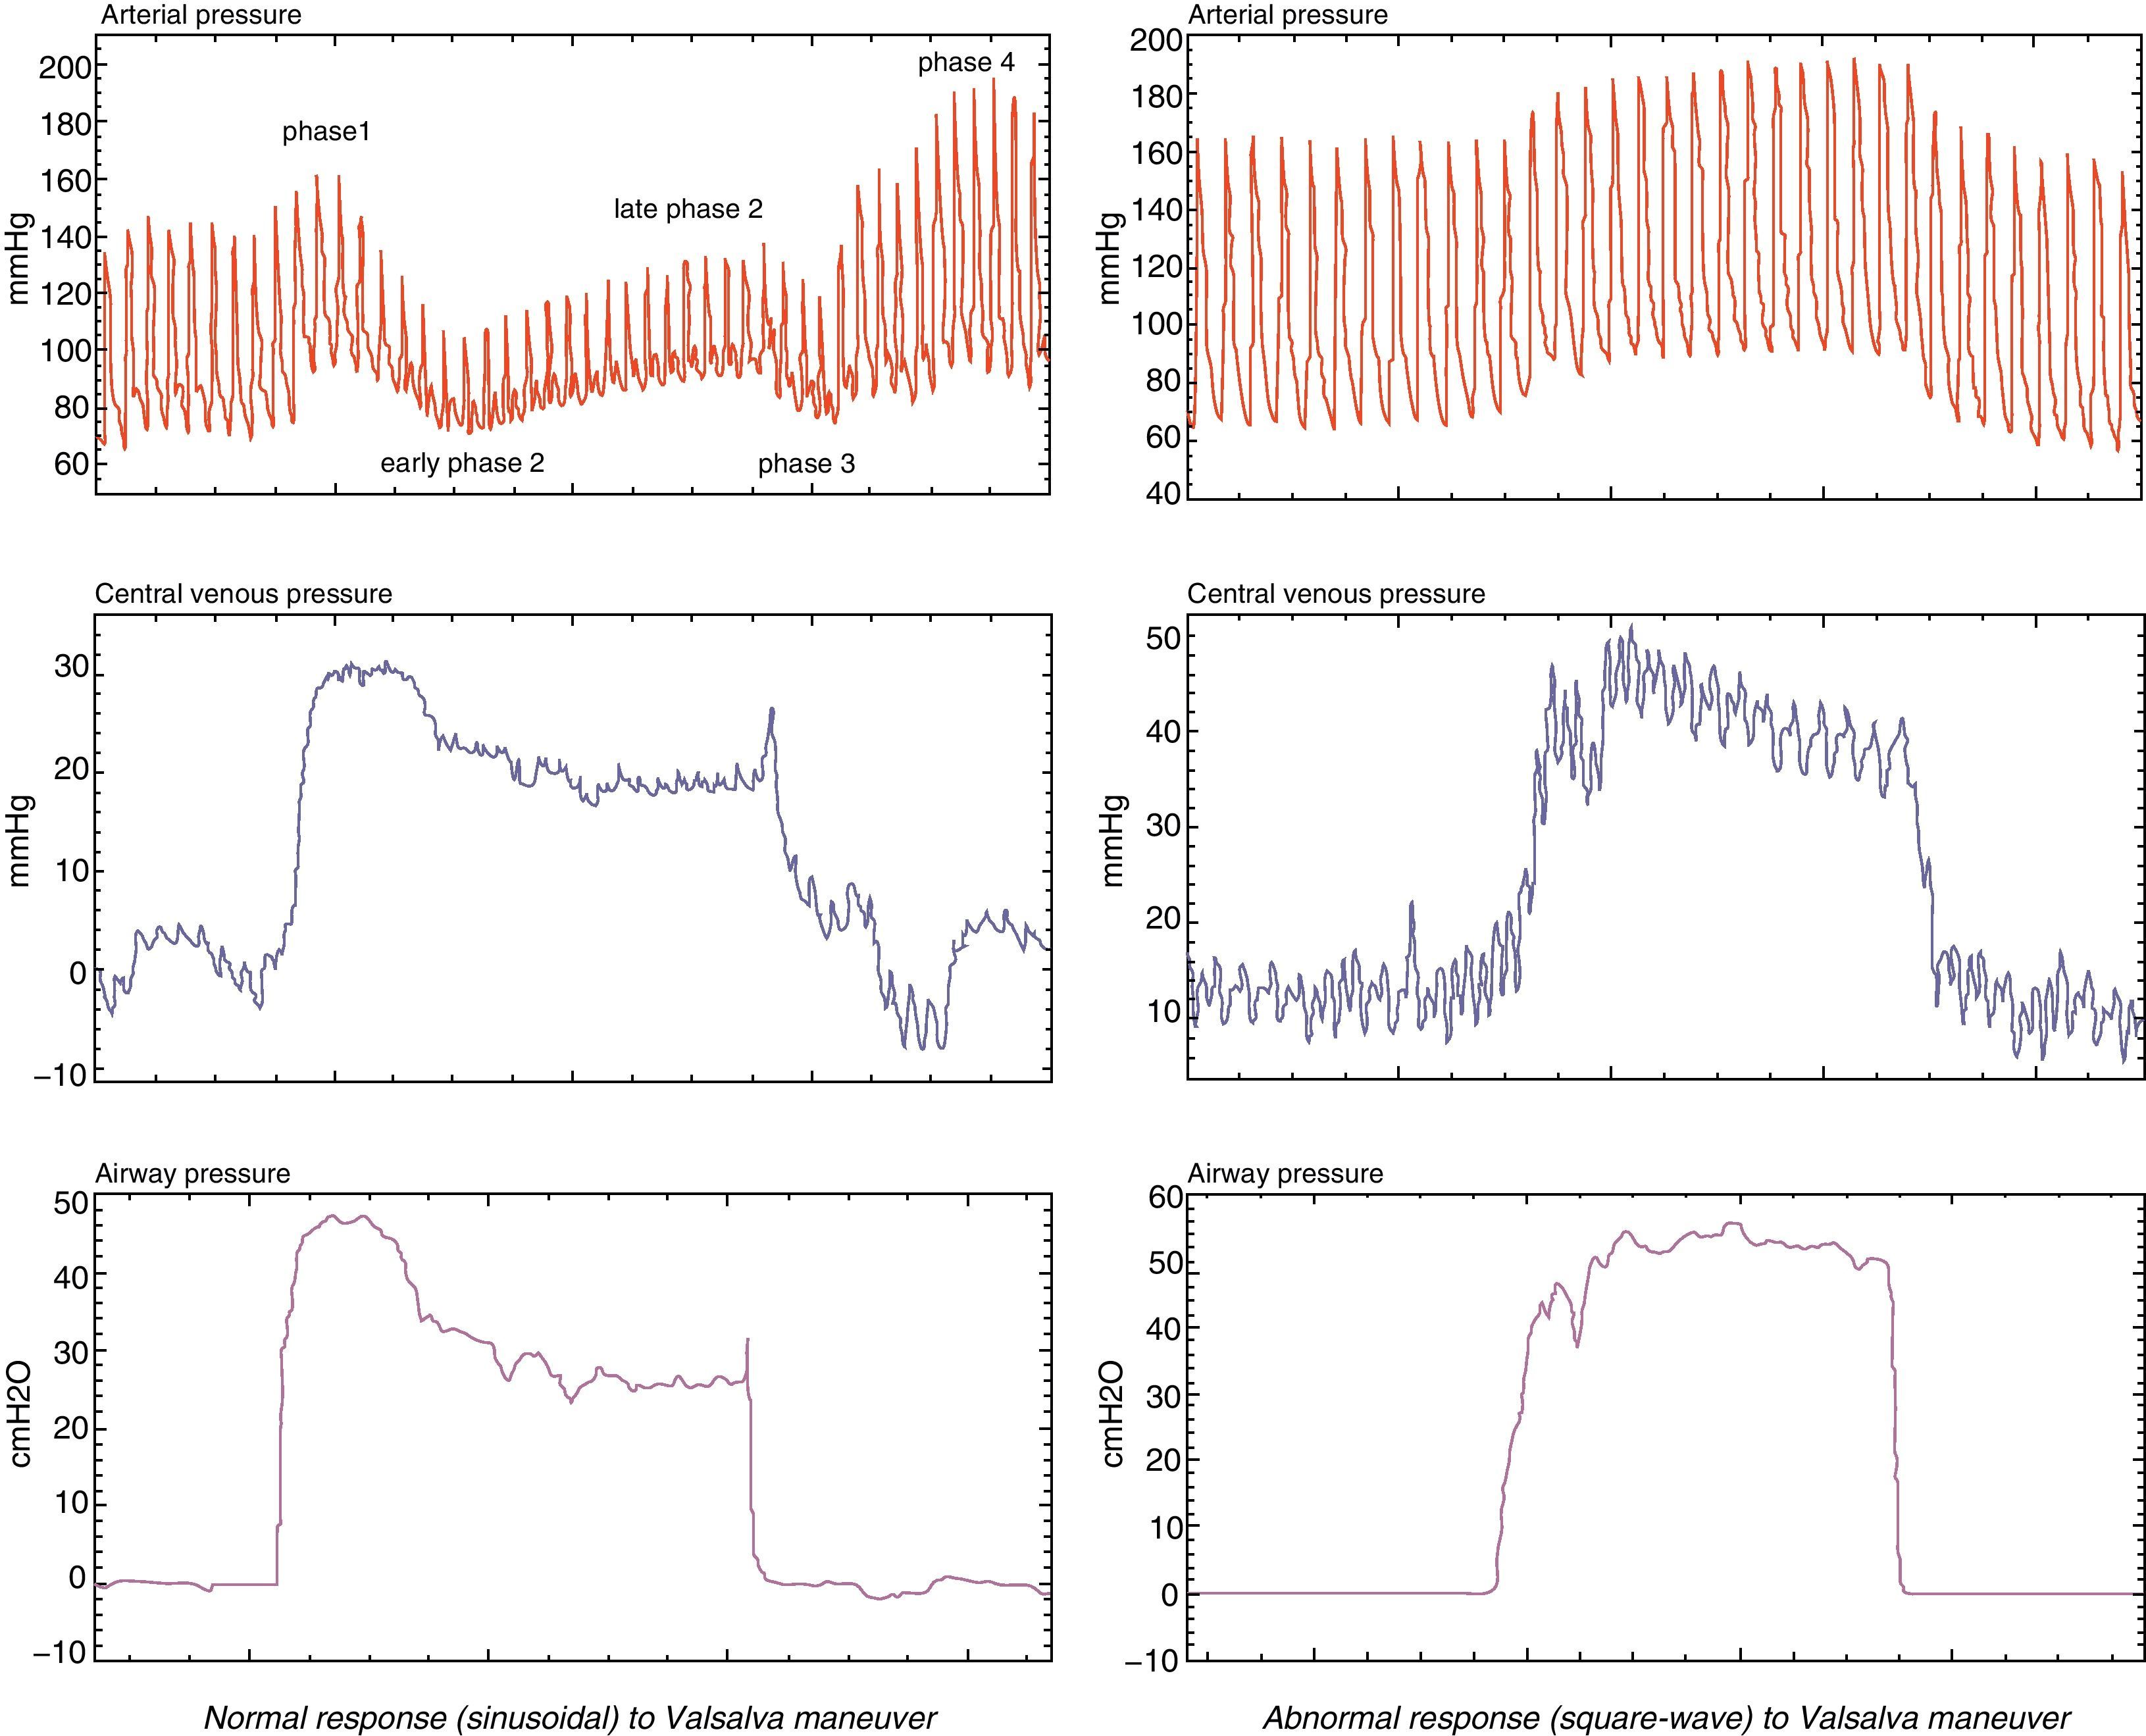
Variation of arterial pulse pressure in the Valsalva maneuverA new parameter derived from the pulse pressure curve measured during the Valsalva maneuver, performed in non-ventilated patients, has been described by Monge-García et al.,44 offering sensitivity and specificity values of over 90%. Under normal conditions, sustained expiratory effort produces an increase in intrathoracic pressure, with the consequent reduction of venous return, drop in systolic volume, and therefore decrease in pulse pressure. This Valsalva–variation of pulse pressure (ΔVPP) parameter is defined as the percentage of variation between the greatest pulse pressure during the first phase of the Valsalva maneuver and the lowest pulse pressure during the second phase of the Valsalva maneuver. These authors have found that in the 30 patients studied, a variation in pulse pressure during the maneuver (ΔVPP) of >52% predicted a positive response to volume expansion, with a sensitivity of 91% and a specificity of 95% (Fig. 5).
Variation of arterial pressure with the end-expiratory occlusion maneuver
This maneuver, recently described by Monnet et al.,28 predicts response to volume administration with an increase of >5% in arterial pulse pressure, with a sensitivity of 87% and a specificity of 100%–the sensitivity and specificity referred to the cardiac index being 91% and 100%, respectively. In 23 patients with spontaneous breathing, the receiver operating characteristic (ROC) curves obtained for evaluating the effect of the occlusion maneuver upon arterial pulse pressure and cardiac index (0.99; 95%CI, 0.827–1, and 0.971; 95%CI, 0.796–0.989) were significantly greater than those obtained with the respiratory variation of pulse pressure and systolic volume (0.679; 95%CI, 0.45–0.88, and 0.571; 95%CI, 0.34–0.781).45
PlethysmographyAs has been commented above, another noninvasive method studied in the patients on mechanical ventilation is the plethysmographic wave determined by pulsioximetry.19,46 In a study of 22 patients, Cannesson et al. reported a good correlation between variations of pulsioxymetric wave amplitude (ΔPplet) of >15% and variations of pulse pressure (VPP) of >13%–the sensitivity being 87% and the specificity 100%. In the 23 patients studied by Feissel et al., a good correlation was found between VPP and ΔPplet, allowing even differentiation between responders and non-responders with volume pre-administration values of VPP of >12% and ΔPOP of >14%, with a sensitivity of 100% and a specificity of 94%, and a sensitivity of 70% and a specificity of 80%, respectively.
In the emergency care setting, Delerme et al. studied 25 patients with spontaneous breathing, evaluating ΔPplet in relation to a foot raising maneuver–a significant decrease being recorded in relation to the latter.47 These results indicated that changes in ΔPplet could predict the response to volume expansion in patients with spontaneous breathing. However, these same authors, in a later study involving 26 spontaneously breathing volunteers and using the same leg raising maneuver, found no relationship between ΔPplet and the cardiac index,48 thereby refuting the mentioned hypothesis. Thus, at present, ΔPplet has not been fully defined as a predictor of response to volume expansion.
Passive leg raising maneuverThe passive leg raising maneuver is a simple and reliable method for evaluating preload dependency in patients with circulatory failure, both under conditions of controlled mechanical ventilation and in spontaneous breathing even in subjects with alterations in cardiac rhythm42 and probably with tidal volume (Vt) values of <8ml/kg.49
The main interest of this maneuver is the fact that passively raising the legs to an angle of 45° with respect to the bed during at least 1min is equivalent to a volume expansion of about 300ml. Since this effect is only temporary, the maneuver is regarded as a test rather than as a treatment.50 Such blood transfer from the lower extremities towards the intrathoracic vessels produces an increase in venous return, cardiac preload and, if both ventricles are operating over the preload dependency segment of the Frank–Starling curve, a significant increase in cardiac output is observed over the following minutes–reaching a peak 60–90s after elevation.51
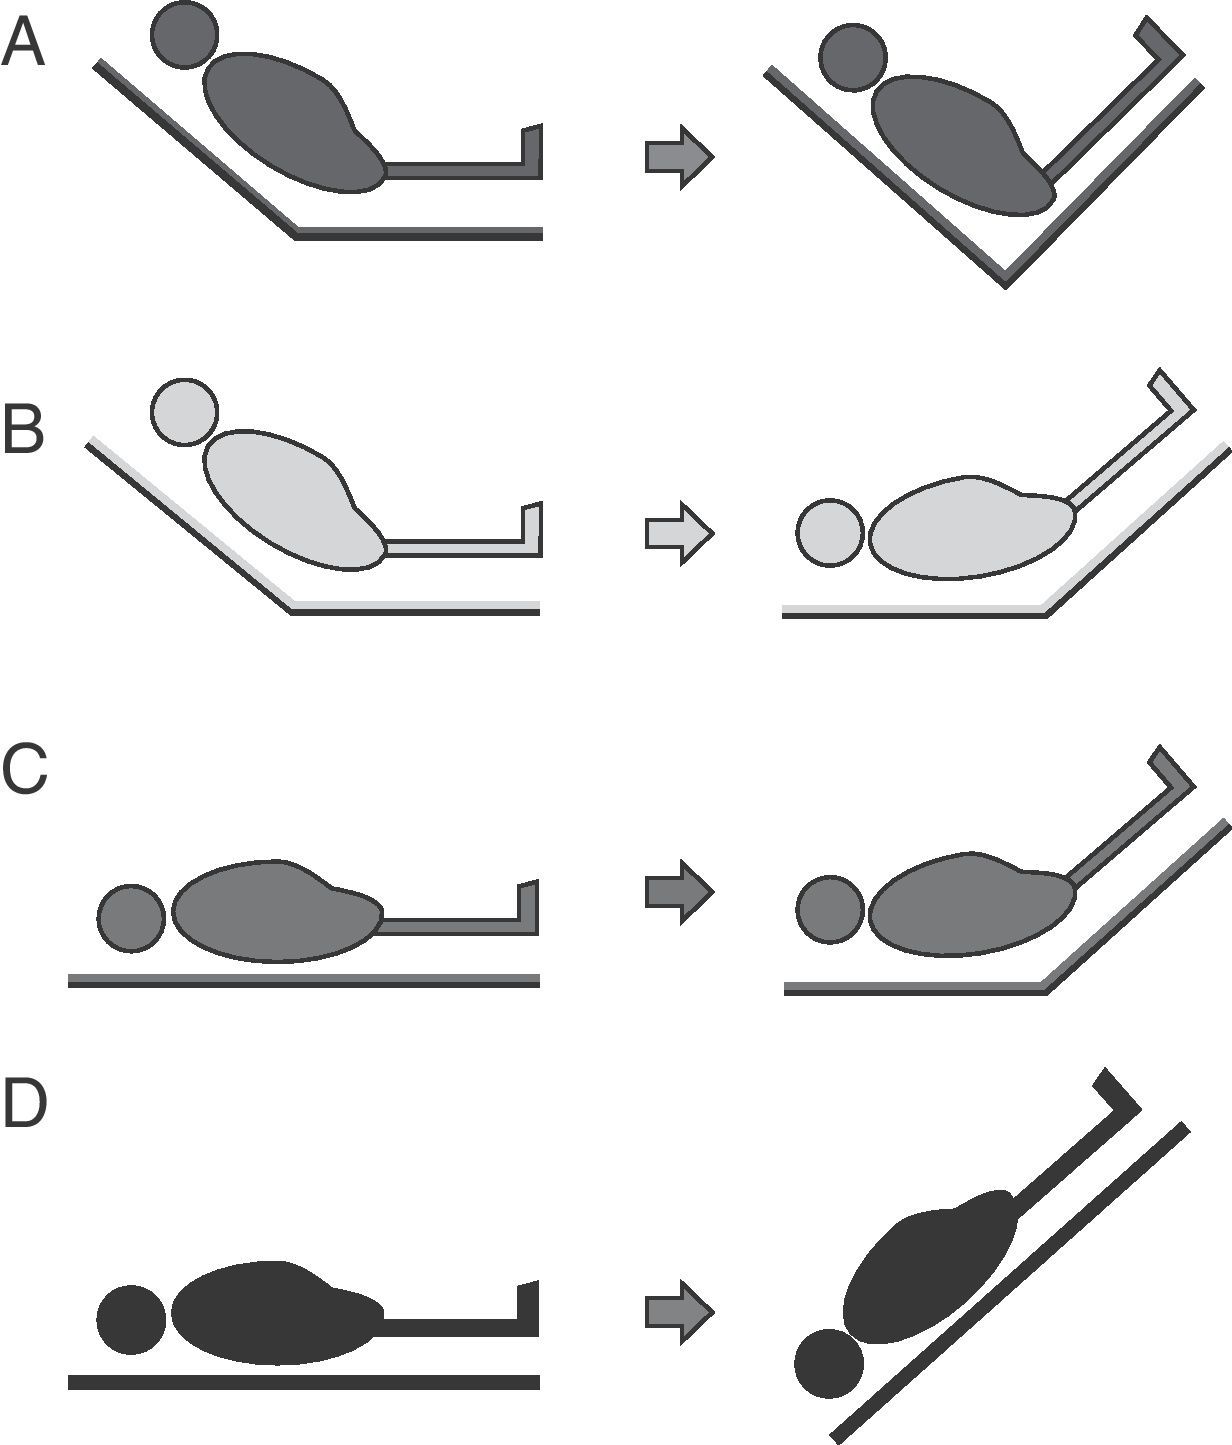
Four passive leg raising maneuver modalities have been described (Fig. 6):
- A.
From the “semi-raised” position the legs can be elevated without lowering the trunk. This maneuver involves a lesser risk of aspiration and elevation of intracranial pressure (ICP), but generates less volume expansion since the splanchnic blood volume is not included.
- B.
From the “semi-raised” position the legs can be elevated and the trunk can be lowered to zero degrees. This is the modality recommended by the experts, but it involves a greater risk of aspiration and ICP increase.52
- C.
From supine decubitus the legs can be raised 45° without moving the trunk. This was the first studied leg raising modality, and generates lesser volume without avoiding the associated risks.
- D.
This modality is equivalent to applying the Trendelenburg maneuver and involves a greater risk of complications.

Many studies have shown the usefulness of this maneuver in evaluating the response to volume expansion. Accordingly, an increase of ≥10% in cardiac output during the first 60–90s of the leg raising maneuver offers sensitivity and specificity performances of over 90% in predicting the capacity to posteriorly raise cardiac output with the administration of fluids.53 It is important to mention that for correct assessment we must use a continuous or fast-response hemodynamic monitorization system allowing rapid detection of the hemodynamic changes induced during the maneuver.54
An increase in systolic volume (ΔSV>12%), measured by transthoracic echocardiography, PiCCO or esophageal Doppler ultrasound during this maneuver has been able to predict an increase in systolic volume of >15% after volume expansion, with high sensitivity and specificity ratings.39,42 In this context, an increase in aortic flow of >10%, as measured by esophageal Doppler ultrasound during a leg raising maneuver, predicts an increase in aortic flow of >15%, with sensitivity and specificity values above 90%.42
The limitations of the passive leg raising maneuver are established by the clinical condition of the patient. The maneuver implies a risk of raising ICP in three of the above described modalities (Fig. 6B–D). As a result, it should be avoided in the case of intracranial hypertension risk.51 The risk of aspiration must be minimized, ensuring gastric emptying and taking care not to lower the trunk below zero degrees. The abdominal compartment syndrome55,56 can lessen the efficacy of the test; as a result, intraabdominal pressure is to be monitored before performing the maneuver. If the patient presents raised intraabdominal pressure and the maneuver is carried out, modality B in Fig. 5 should be chosen.52 Likewise, elastic compression stockings, hemorrhagic shock and cardiogenic shock can reduce the response to the passive leg raising test.51
Volume load (fluid challenge)While not truly a predictive measure, evaluation of the response to the administration of a given amount of volume (fluid challenge) has been used for many years in clinical practice to assess the efficacy and safety of patient response to volume expansion.
In 2006, Vincent et al.47 proposed a volume administration algorithm based on the evaluation of the early response to volume expansion (within the first 10–20min).
Evaluation of the response is based on a series of pre-established mean blood pressure (MBP) target values and CVP safety values (e.g., MBP 75mmHg and CVP 15mmHg). Accordingly, on reaching or exceeding these limits, volume administration would be stopped. Evidently, the main limitation of this method is its lack of reversibility, which would be particularly important in patients with depressed cardiac function–though it could be useful in situations where the static or dynamic parameters are not good predictors.
ConclusionsHemodynamic monitorization offers essential information on cardiovascular function that can help guide volume expansion and probably improve the prognosis of patients with acute circulatory failure. However, each parameter obtained must be interpreted taking into account its limitations as a predictor of response to volume administration, as well as the clinical condition of the patient (Table 1).
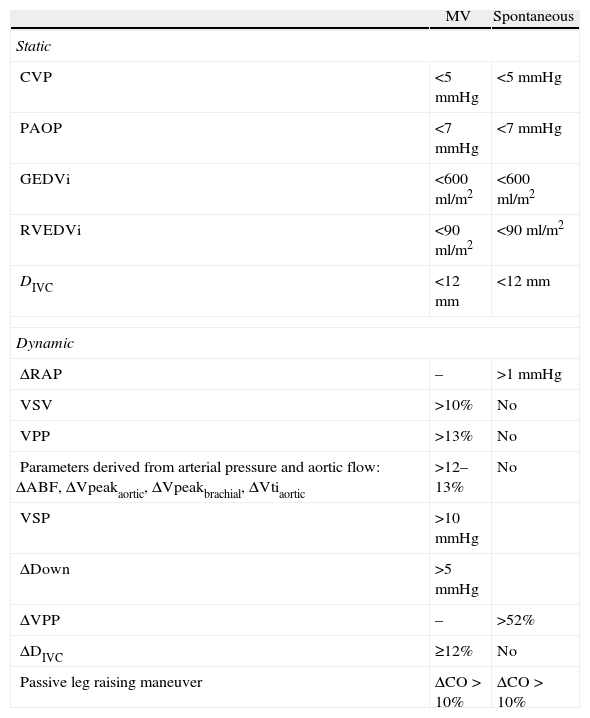
Summary of the predictors of response to volume expansion, with cutoff points in mechanical ventilation (MV) and in spontaneous breathing.
| MV | Spontaneous | |
| Static | ||
| CVP | <5mmHg | <5mmHg |
| PAOP | <7mmHg | <7mmHg |
| GEDVi | <600ml/m2 | <600ml/m2 |
| RVEDVi | <90ml/m2 | <90ml/m2 |
| DIVC | <12mm | <12mm |
| Dynamic | ||
| ΔRAP | – | >1mmHg |
| VSV | >10% | No |
| VPP | >13% | No |
| Parameters derived from arterial pressure and aortic flow: ΔABF, ΔVpeakaortic, ΔVpeakbrachial, ΔVtiaortic | >12–13% | No |
| VSP | >10mmHg | |
| ΔDown | >5mmHg | |
| ΔVPP | – | >52% |
| ΔDIVC | ≥12% | No |
| Passive leg raising maneuver | ΔCO>10% | ΔCO>10% |
DIVC: diameter of the inferior vena cava; ΔABF: variation of aortic blood flow; ΔDIVC: variation of the diameter of the inferior vena cava; ΔCO: variation of cardiac output; ΔRAP: variation of right atrial pressure; ΔPPplet: variation of pulse pressure determined by plethysmography; ΔVpeakaortic: variation of peak aortic flow velocity; ΔVpeakbrachial: variation of peak brachial flow velocity; ΔVPP: variation of arterial pulse wave pressure during the Valsalva maneuver; ΔVtiaortic: variation of the aortic flow velocity–time integral; PAOP: pulmonary artery occlusion pressure; CVP: central venous pressure; VPP: variation of pulse pressure; VSP: variation of systolic pulse; ΔDown: end-expiratory-minimum VSP component; GEDVi: global end-diastolic volume index; RVEDV: right ventricle end-diastolic volume; VSV: variation of systolic volume.
M. Ignacio Monge-Garcia is a consultant for Edwards Lifesciences.
The rest of authors declare no conflicts of interest.
Please cite this article as: Sabatier C, et al. Valoración de la precarga y la respuesta cardiovascular al aporte de volumen. Med Intensiva. 2012; 36:45–55.