
To determine the prognostic value of the biomarkers procalcitonin, interlukin-6 and C-reactive protein in septic patients.
DesignA cohort of 81 septic patients.
SettingCritical Care Unit. Dr. Peset Hospital. Valencia (Spain).
PatientsDivided according to sepsis classification (sepsis, severe sepsis and septic shock), source and two different groups (medical and postsurgical).
Variables analyzedQuantitative (procalcitonin, interleukin-6, C-reactive protein, lactate, age, Apache II and SOFA scores upon admission and after 3 and 7 days). Qualitative (ICU mortality, multiorgan failure development and sex). Statistical analysis: Mann–Whitney U-test for the comparison of quantitative variables, χ2 test for qualitative variables. Multivariate analysis with mortality and multiorgan failure as dependent variables and the described quantitative parameters as independent variables. ROC curves of the variables were found to be significant in the multivariate analysis.
ResultsSeptic shock patients showed greater mortality and more frequent multiorgan failure. Comparison of survivors versus deceased patients showed significant differences in Apache II score, interleukin-6 and lactate (p<0.001) upon admission and after 3 and 7 days. Similar findings applied to the comparison of patients with and without multiorgan failure, and on the same days. Procalcitonin only showed differences on days 3 and 7 (p=0.001). In the multivariate analysis with mortality as dependent variable, interleukin-6 proved significant on day 3 (OR 2.6). With multiorgan failure as dependent variable, only the SOFA score showed significance (OR 2.3). The Apache II and interleukin-6 ROC curves corresponding to day 3 showed areas of 0.80 and 0.86, respectively.
Conclusions(1) Interleukin-6 is an inflammatory biomarker with mortality prognostic value. (2) None of the biomarkers proved predictive of multiorgan failure.
Comprobar el valor pronóstico de los biomarcadores procalcitonina, interleukina 6 y proteína C reactiva en pacientes sépticos graves.
DiseñoCohorte de 81 pacientes críticos.
AmbitoUnidad de Críticos Hospital Dr. Peset. Valencia.
PacientesDivididos según el grado de sepsis (sepsis, sepsis severa, shock séptico), foco de sepsis y grupo (pacientes médicos y posquirúrgicos de alto riesgo).
Variables analizadasCuantitativas (procalcitonina, interleukina-6, proteína C reactiva, lactato, edad, Apache II y SOFA) al ingreso, 3.er y 7.° día de evolución. Cualitativas (mortalidad intra UCI, desarrollo Fallo Multiorgánico y sexo). Estadística: comparación variables cuantitativas con test U de Mann–Whitney; las cualitativas con test de χ2; análisis multivariante variables dependientes mortalidad y fallo multiorgánico e independientes las cuantitativas descritas; curvas ROC de las variables significativas en el multivariante.
ResultadosPacientes con shock séptico fallecieron más y desarrollaron más fallo multiorgánico. Comparación entre vivos y fallecidos, mostró diferencias significativas Apache II, interleukina-6 y lactato (p <0.001) al ingreso, 3.er y 7.° día. Entre pacientes con fallo multiorgánico y sin él, también y los mismos días. La procalcitonina mostró diferencias solo en 3.er y 7.° día (p=0,001). Análisis multivariante con variable dependiente mortalidad la interleukina-6 mostró significación al 3.er día (O.R. 2,6). Con variable dependiente fallo multiorgánico solo SOFA tuvo significación (O.R. 2,3). Curva ROC Apache II e interleukina-6 3.er día mostró área 0,80 y 0,86 respectivamente.
Conclusiones1) La interleukina-6 es un biomarcador inflamatorio con valor pronóstico de mortalidad; 2) Ningún biomarcador tuvo valor predictivo de fallo multiorgánico.
In situations of severe sepsis, the mortality rate ranges from 21% to 81% in cases of septic shock.1 Since its incidence has increased in recent years,2 it has been necessary to launch a medical intervention campaign3 designed to reduce these mortality figures.
The consensus conference of 2001 established that the most important consideration in sepsis is the securing of an early diagnosis in the first stages of the inflammatory response to the infection, with quantification of its severity; it is therefore a priority concern to identify the signs and symptoms that can lead us to suspect sepsis.4,5 The signs and symptoms specific of sepsis initially may not appear, and the microbiological diagnosis may take even days. However, if vigorous and early treatment measures are not adopted (fluid therapy, vasoactive drugs and empirical antibiotic treatment), the risk of multiorgan failure (MOF)6 and of patient death is high.7
The diagnostic application of inflammatory markers could help differentiate between infectious and non-infectious processes, while prognostic applications could predict the severity of a pathological process or disease—allowing us to implement an appropriate treatment plan,8–10 with assessment of the response obtained.11–14
The present study analyzes certain inflammatory markers [procalcitonin (PCT), interleukin-6 (IL-6) and C-reactive protein (CRP)], based on their capacity to afford an early prediction of the severity of sepsis (hypothesis), and evaluating their capacity to predict mortality and the development of multiorgan failure (objectives). Such determinations together with the Apache II and SOFA severity scores may allow us to offer earlier adequate treatment for sepsis, and thus contribute to lessen patient mortality.
Materials and methodsFrom a series of 129 critically ill patients with two or more criteria of systemic inflammatory response syndrome (SIRS) forming part of a study on inflammatory markers in SIRS started in our Department in the year 2008, we selected 81 cases in which the underlying etiology was of an infectious nature and which met criteria of sepsis.4 Patient screening and randomization were conducted on a consecutive basis, and informed consent to inclusion in the study was either obtained from the patients themselves or from their closest relatives, according to the protocol approved by the Ethics Committee of our hospital.
The patients were stratified according to the degree of sepsis, based on the classification of the American College of Chest Physicians/Society of Critical Care Medicine15 and posteriorly ratified by other authors16 (sepsis, severe sepsis and septic shock). We also determined the septic focus (pulmonary, abdominal, urinary, catheter, unknown, others [including neurological, skin and soft parts, as well as endocarditis of infectious origin]). The patients were divided into two groups: acute, non-coronary clinical disease and postoperative patients.
Patient age and days of stay were analyzed as quantitative variables, along with PCT, IL-6, CRP, serum lactate, and the Apache II and SOFA scores upon admission (first 24h) and after 3 and 7 days in the Intensive Care Unit (ICU), with a view to assessing their evolution during patient stay in the ICU.
The qualitative study variables were patient gender, the development of MOF, and mortality in the ICU.
PCT was determined using TRACE technology, which measures the signal produced from an immune complex with a time delay. The technique involves the transfer of non-irradiating energy from a donor (cryptate) to a receptor (light-capturing protein, XL665). Intensification of the cryptate fluorescent signal takes place, allowing measurement of the fluorescence. The measured signal is proportional to the concentration of the test analyte being measured (procalcitonin), with values between 0.5 and 10ng/ml.17 The following results are considered valid: <0.5=negative infection risk; 0.5–2=moderate infection risk; 2–10=high risk of progression toward severe systemic infection; and >10=high probability of severe sepsis or septic shock.18
CRP in turn was determined based on an antigen-antibody reaction technique, with normal values between 0 and 10mg/l.19
IL-6 was determined by solid phase sequential ELISA with chemiluminescence—normal values corresponding to <9.7pg/ml.20
Lastly, serum lactate was determined in arterial blood with a Radiometer ABL-700 analyzer, with values between 0.5 and 2.2mmol/l.
Statistical analysis: Logarithmic transformation was decided in order to better process the variable IL-6, due to the very high levels recorded in some patients (sometimes in excess of 1000pg/ml). A descriptive study was made, including the focus of sepsis. Comparison of the quantitative variables was carried out using the Mann–Whitney U-test, while qualitative variables were contrasted with the chi-squared test. Multivariate logistic regression analysis was performed referred to the day of admission and after 3 and 7 days in the ICU—the dependent variables being mortality and MOF, and the independent variables PCT, IL-6, CRP, patient age and the Apache II and SOFA scores. Lastly, receiver operating characteristic (ROC) curves were plotted corresponding to the variables found to show significance in the multivariate analysis, with the corresponding areas and 95% confidence intervals (95%CI). The curves were compared (between IL-6 log upon admission and after 3 days, and between IL-6 after 3 days and the Apache II score on the third day) based on the chi-squared homogeneity of areas test. The SPSS version 15 statistical package for MS Windows was used throughout, except for comparison of the ROC curves, where use was made of the Epidat version 3.1 package. Statistical significance was considered for p<0.05
ResultsDescriptive analysis: The sample size consisted of 81 patients (43 males and 38 females), with a median age and duration of stay in the ICU of 62 years and 7 days, respectively.
Fifty-five patients belonged to the acute clinical disease group (67.9%) (20 community-acquired pneumonias, 12 cases of sepsis of urological origin, 15 cases of catheter-related sepsis, 6 cases of bacterial meningitis, and 2 patients with bacterial endocarditis and positive blood cultures), while 26 patients belonged to the postoperative group (32.1%)(23 cases of peritonitis, 2 overinfected abdominal aortic aneurysms, and a patient with Fournier gangrene).
The foci of sepsis were: pulmonary in 20 patients (24.7%), abdominal in 19 (23.5%), urinary in 12 (14.8%), catheter-related in 15 (18.5%), others in 9 (11.1%), and unknown in 6 (7.4%).
Degree of sepsis: sepsis in 3 patients (3.7%), severe sepsis in 29 (35.8%) and septic shock in 49 (60.5%).
A total of 27 patients died (33.3% of the total), and 58 developed MOF (71.6% of the total).
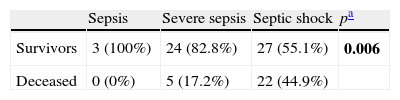
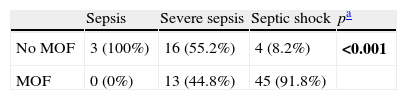
Comparison of qualitative variables: As can be seen in Tables 1 and 2, the degree of sepsis exerted a strong influence upon both mortality and the development of MOF; in this context, the patients with septic shock suffered greater mortality and showed a higher incidence of MOF.
Comparison degree of sepsis/mortality.
| Sepsis | Severe sepsis | Septic shock | pa | |
| Survivors | 3 (100%) | 24 (82.8%) | 27 (55.1%) | 0.006 |
| Deceased | 0 (0%) | 5 (17.2%) | 22 (44.9%) |
Chi-squared test.
Comparison degree of sepsis/development of MOF.
| Sepsis | Severe sepsis | Septic shock | pa | |
| No MOF | 3 (100%) | 16 (55.2%) | 4 (8.2%) | <0.001 |
| MOF | 0 (0%) | 13 (44.8%) | 45 (91.8%) |
Chi-squared test.
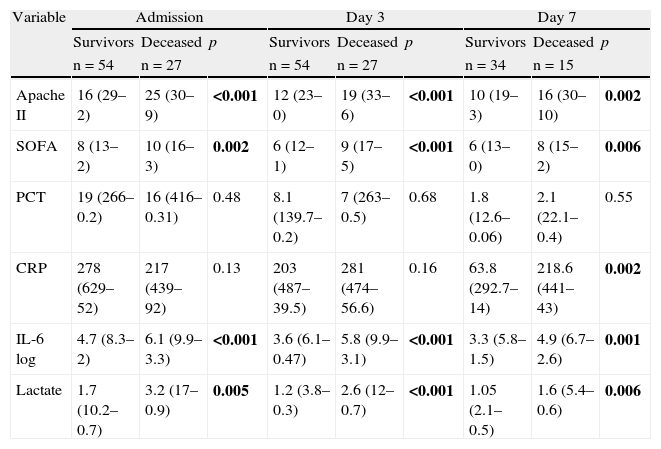
Bivariate analysis: (1) Comparison between survivors and deceased patients: as can be seen in Table 3, the patients who died showed significant differences with respect to the survivors in terms of the Apache II score, SOFA score, IL-6 log and lactate upon admission and after 3 and 7 days in the ICU. The CRP levels only showed significant differences in the patients who died but were still alive on day 7—this probably being related to the greater seriousness of their condition.
Comparison of quantitative variables between survivors and deceased patients.
| Variable | Admission | Day 3 | Day 7 | ||||||
| Survivors | Deceased | p | Survivors | Deceased | p | Survivors | Deceased | p | |
| n=54 | n=27 | n=54 | n=27 | n=34 | n=15 | ||||
| Apache II | 16 (29–2) | 25 (30–9) | <0.001 | 12 (23–0) | 19 (33–6) | <0.001 | 10 (19–3) | 16 (30–10) | 0.002 |
| SOFA | 8 (13–2) | 10 (16–3) | 0.002 | 6 (12–1) | 9 (17–5) | <0.001 | 6 (13–0) | 8 (15–2) | 0.006 |
| PCT | 19 (266–0.2) | 16 (416–0.31) | 0.48 | 8.1 (139.7–0.2) | 7 (263–0.5) | 0.68 | 1.8 (12.6–0.06) | 2.1 (22.1–0.4) | 0.55 |
| CRP | 278 (629–52) | 217 (439–92) | 0.13 | 203 (487–39.5) | 281 (474–56.6) | 0.16 | 63.8 (292.7–14) | 218.6 (441–43) | 0.002 |
| IL-6 log | 4.7 (8.3–2) | 6.1 (9.9–3.3) | <0.001 | 3.6 (6.1–0.47) | 5.8 (9.9–3.1) | <0.001 | 3.3 (5.8–1.5) | 4.9 (6.7–2.6) | 0.001 |
| Lactate | 1.7 (10.2–0.7) | 3.2 (17–0.9) | 0.005 | 1.2 (3.8–0.3) | 2.6 (12–0.7) | <0.001 | 1.05 (2.1–0.5) | 1.6 (5.4–0.6) | 0.006 |
Median (maximum-minimum). p-Value according to Mann–Whitney U-test.
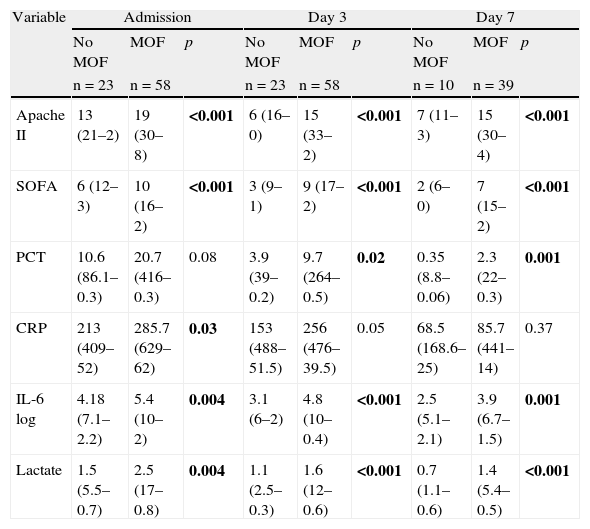
(2) Comparison between patients who developed MOF and those who did not: as can be seen in Table 4, there were significant differences between the two groups in terms of the variables Apache II score, SOFA score, IL-6 log and lactate upon admission and after 3 and 7 days in the ICU. In the case of PCT, differences were also observed from day 3 of admission. In contrast, CRP only showed differences between the two groups upon admission (p=0.03).
Comparison of quantitative variables in septic patients with and without MOF. Median (maximum–minimum).
| Variable | Admission | Day 3 | Day 7 | ||||||
| No MOF | MOF | p | No MOF | MOF | p | No MOF | MOF | p | |
| n=23 | n=58 | n=23 | n=58 | n=10 | n=39 | ||||
| Apache II | 13 (21–2) | 19 (30–8) | <0.001 | 6 (16–0) | 15 (33–2) | <0.001 | 7 (11–3) | 15 (30–4) | <0.001 |
| SOFA | 6 (12–3) | 10 (16–2) | <0.001 | 3 (9–1) | 9 (17–2) | <0.001 | 2 (6–0) | 7 (15–2) | <0.001 |
| PCT | 10.6 (86.1–0.3) | 20.7 (416–0.3) | 0.08 | 3.9 (39–0.2) | 9.7 (264–0.5) | 0.02 | 0.35 (8.8–0.06) | 2.3 (22–0.3) | 0.001 |
| CRP | 213 (409–52) | 285.7 (629–62) | 0.03 | 153 (488–51.5) | 256 (476–39.5) | 0.05 | 68.5 (168.6–25) | 85.7 (441–14) | 0.37 |
| IL-6 log | 4.18 (7.1–2.2) | 5.4 (10–2) | 0.004 | 3.1 (6–2) | 4.8 (10–0.4) | <0.001 | 2.5 (5.1–2.1) | 3.9 (6.7–1.5) | 0.001 |
| Lactate | 1.5 (5.5–0.7) | 2.5 (17–0.8) | 0.004 | 1.1 (2.5–0.3) | 1.6 (12–0.6) | <0.001 | 0.7 (1.1–0.6) | 1.4 (5.4–0.5) | <0.001 |
p-Value according to Mann–Whitney U-test.
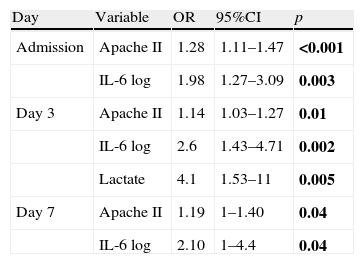
Multivariate analysis: Only the results of the variables that proved statistically significant are shown. (1) Dependent variable mortality: as can be seen in Table 5, and in addition to the Apache II score, IL-6 log and lactate were identified as an independent variables for mortality, with odds ratio (OR) of 2.6 and 4.1, respectively, on day 3 of admission.
Multivariate logistic regression analysis. Dependent variable mortality.
| Day | Variable | OR | 95%CI | p |
| Admission | Apache II | 1.28 | 1.11–1.47 | <0.001 |
| IL-6 log | 1.98 | 1.27–3.09 | 0.003 | |
| Day 3 | Apache II | 1.14 | 1.03–1.27 | 0.01 |
| IL-6 log | 2.6 | 1.43–4.71 | 0.002 | |
| Lactate | 4.1 | 1.53–11 | 0.005 | |
| Day 7 | Apache II | 1.19 | 1–1.40 | 0.04 |
| IL-6 log | 2.10 | 1–4.4 | 0.04 |
OR, odds ratio; 95%CI, 95% confidence interval.
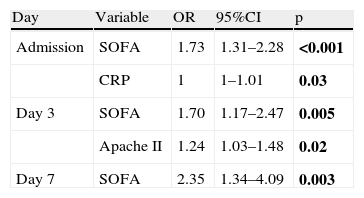
(2) Dependent variable MOF: as can be seen in Table 6, only the SOFA score was identified as an independent variable for MOF, with an adequate OR. None of the inflammatory markers had sufficient statistical significance to predict MOF.
Multivariate logistic regression analysis. Dependent variable multiorgan failure.
| Day | Variable | OR | 95%CI | p |
| Admission | SOFA | 1.73 | 1.31–2.28 | <0.001 |
| CRP | 1 | 1–1.01 | 0.03 | |
| Day 3 | SOFA | 1.70 | 1.17–2.47 | 0.005 |
| Apache II | 1.24 | 1.03–1.48 | 0.02 | |
| Day 7 | SOFA | 2.35 | 1.34–4.09 | 0.003 |
OR, odds ratio; 95%CI, 95% confidence interval.
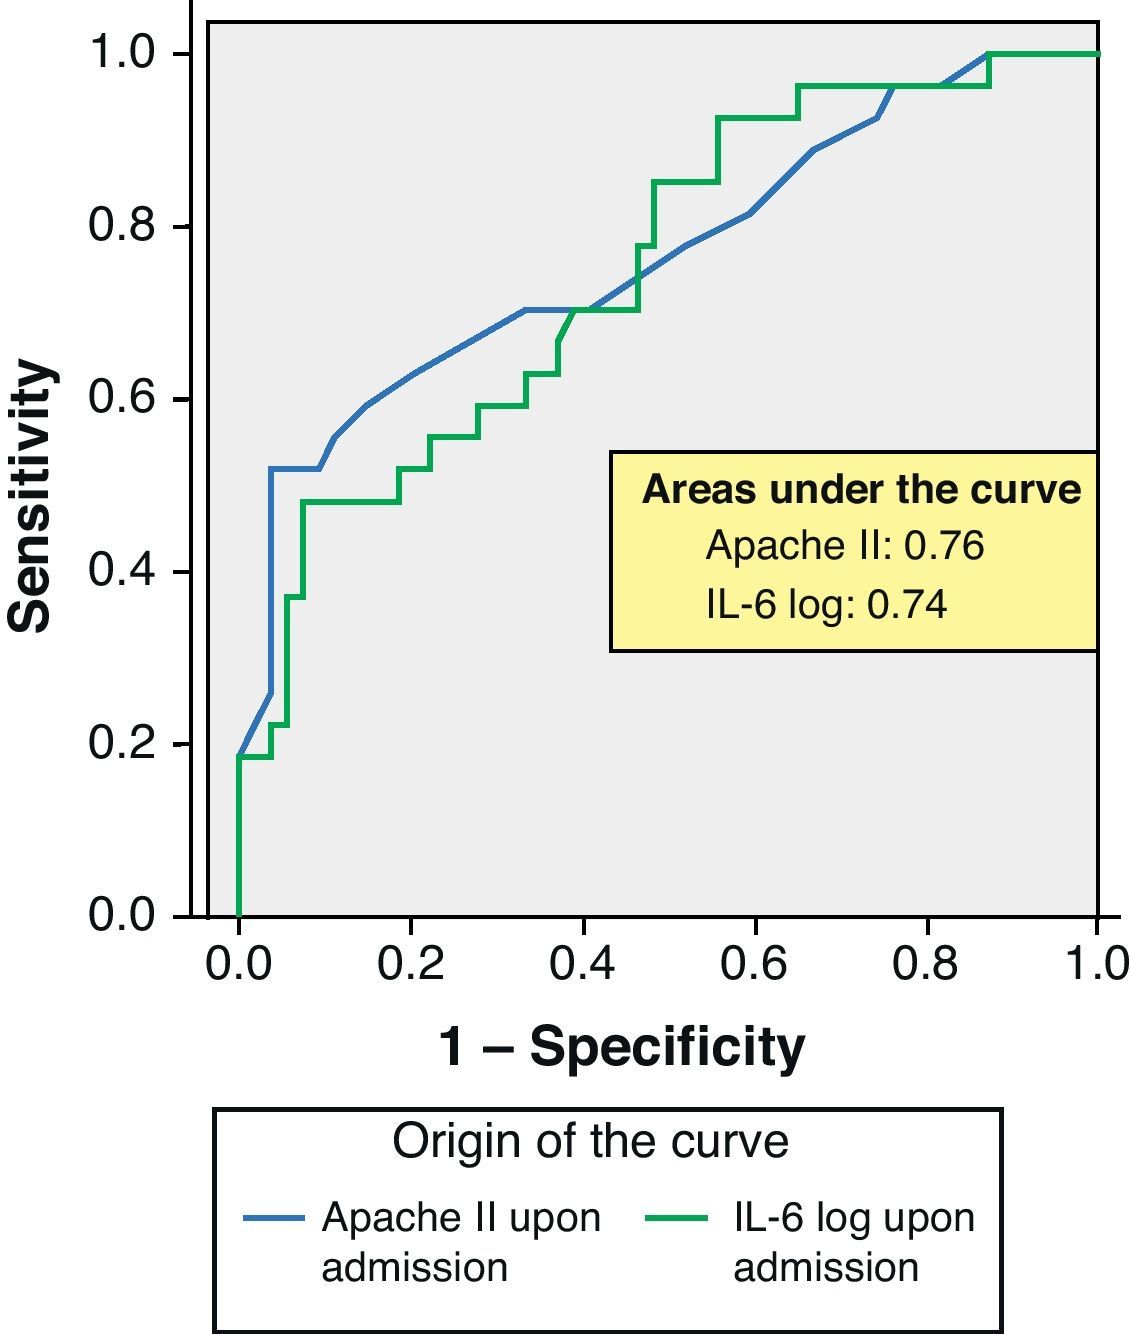
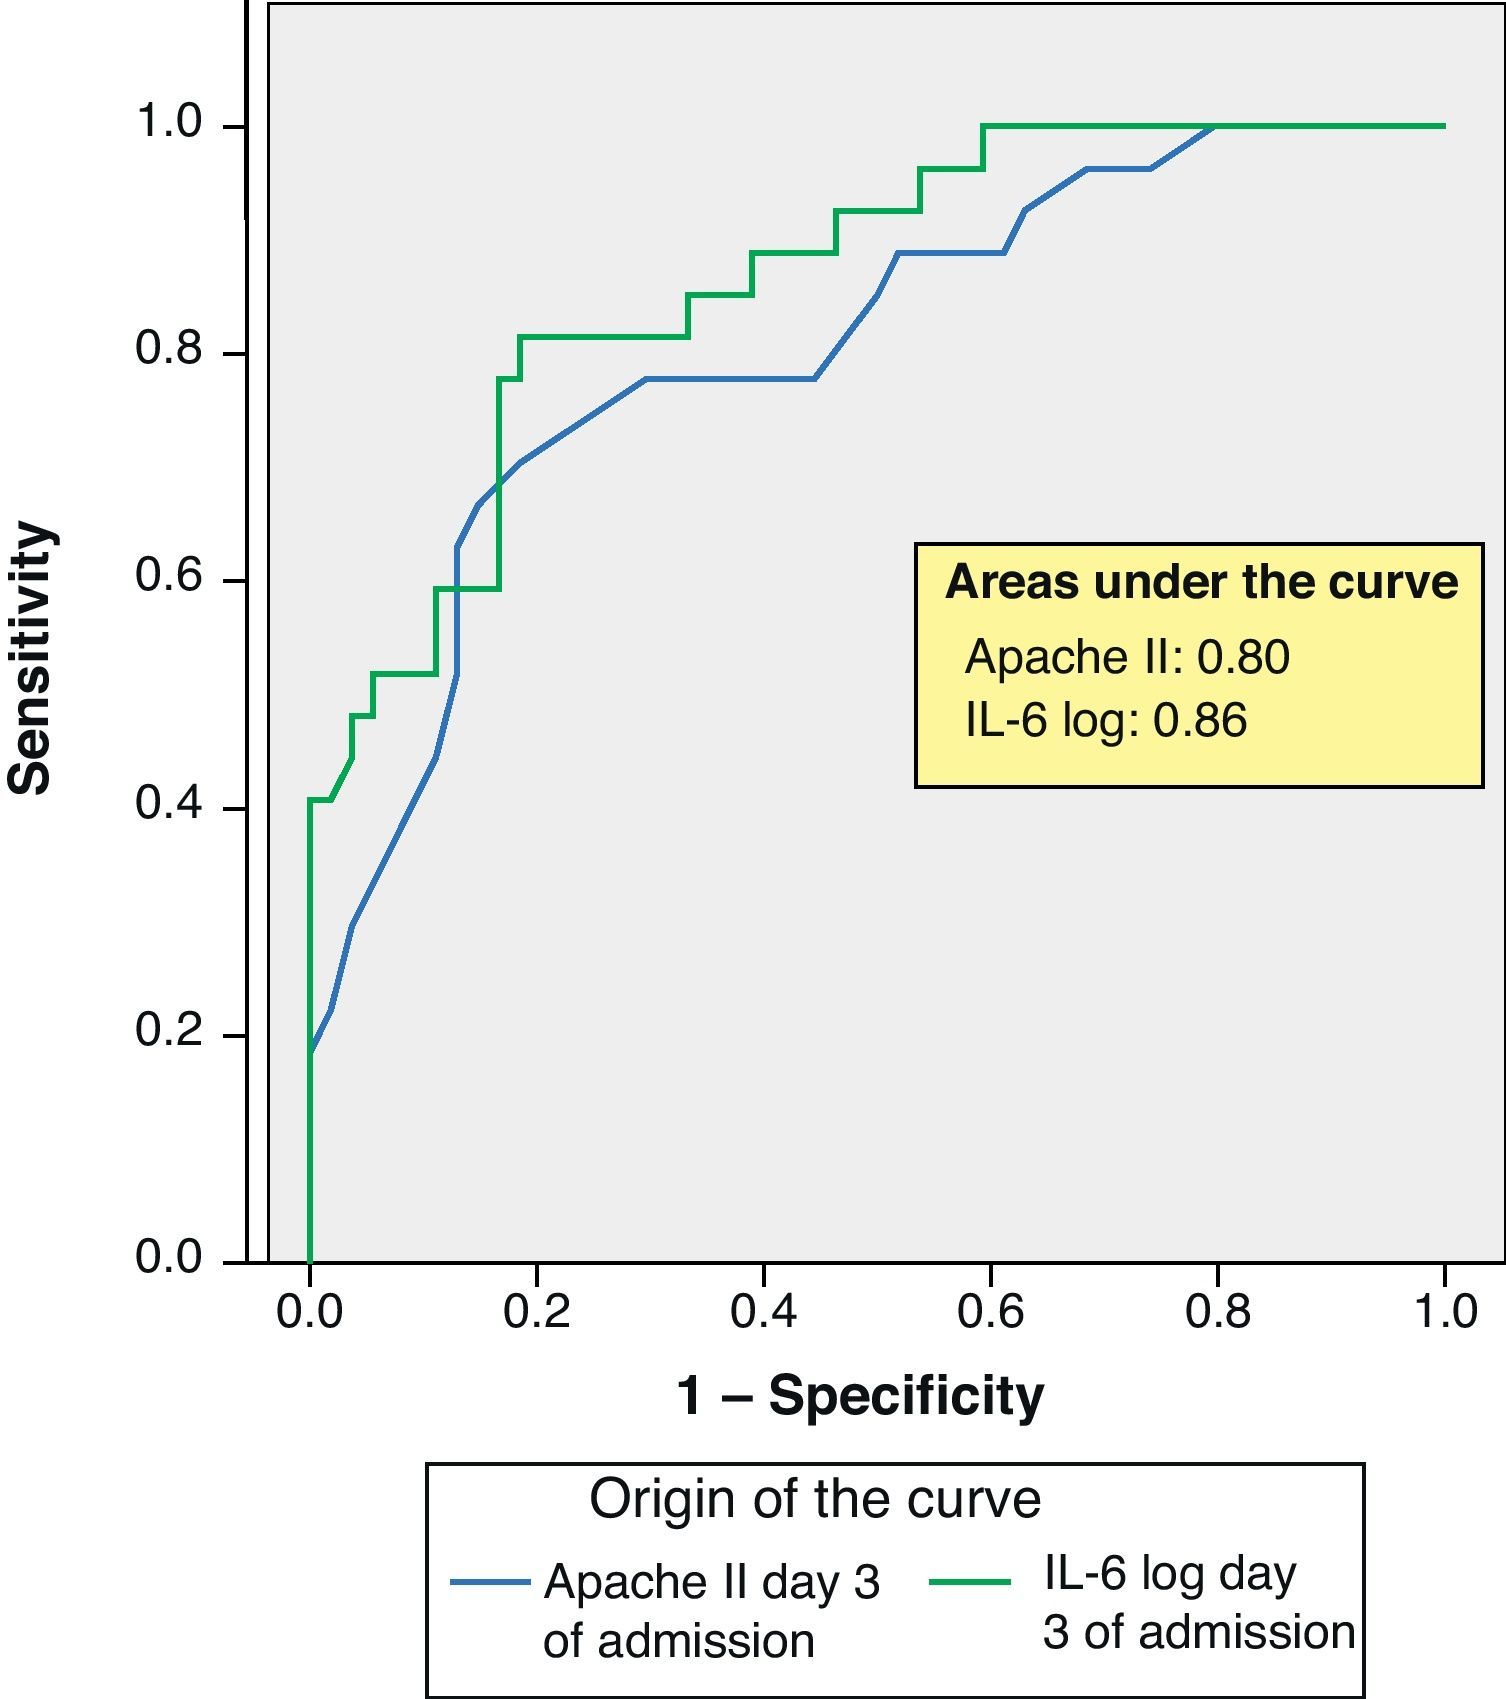
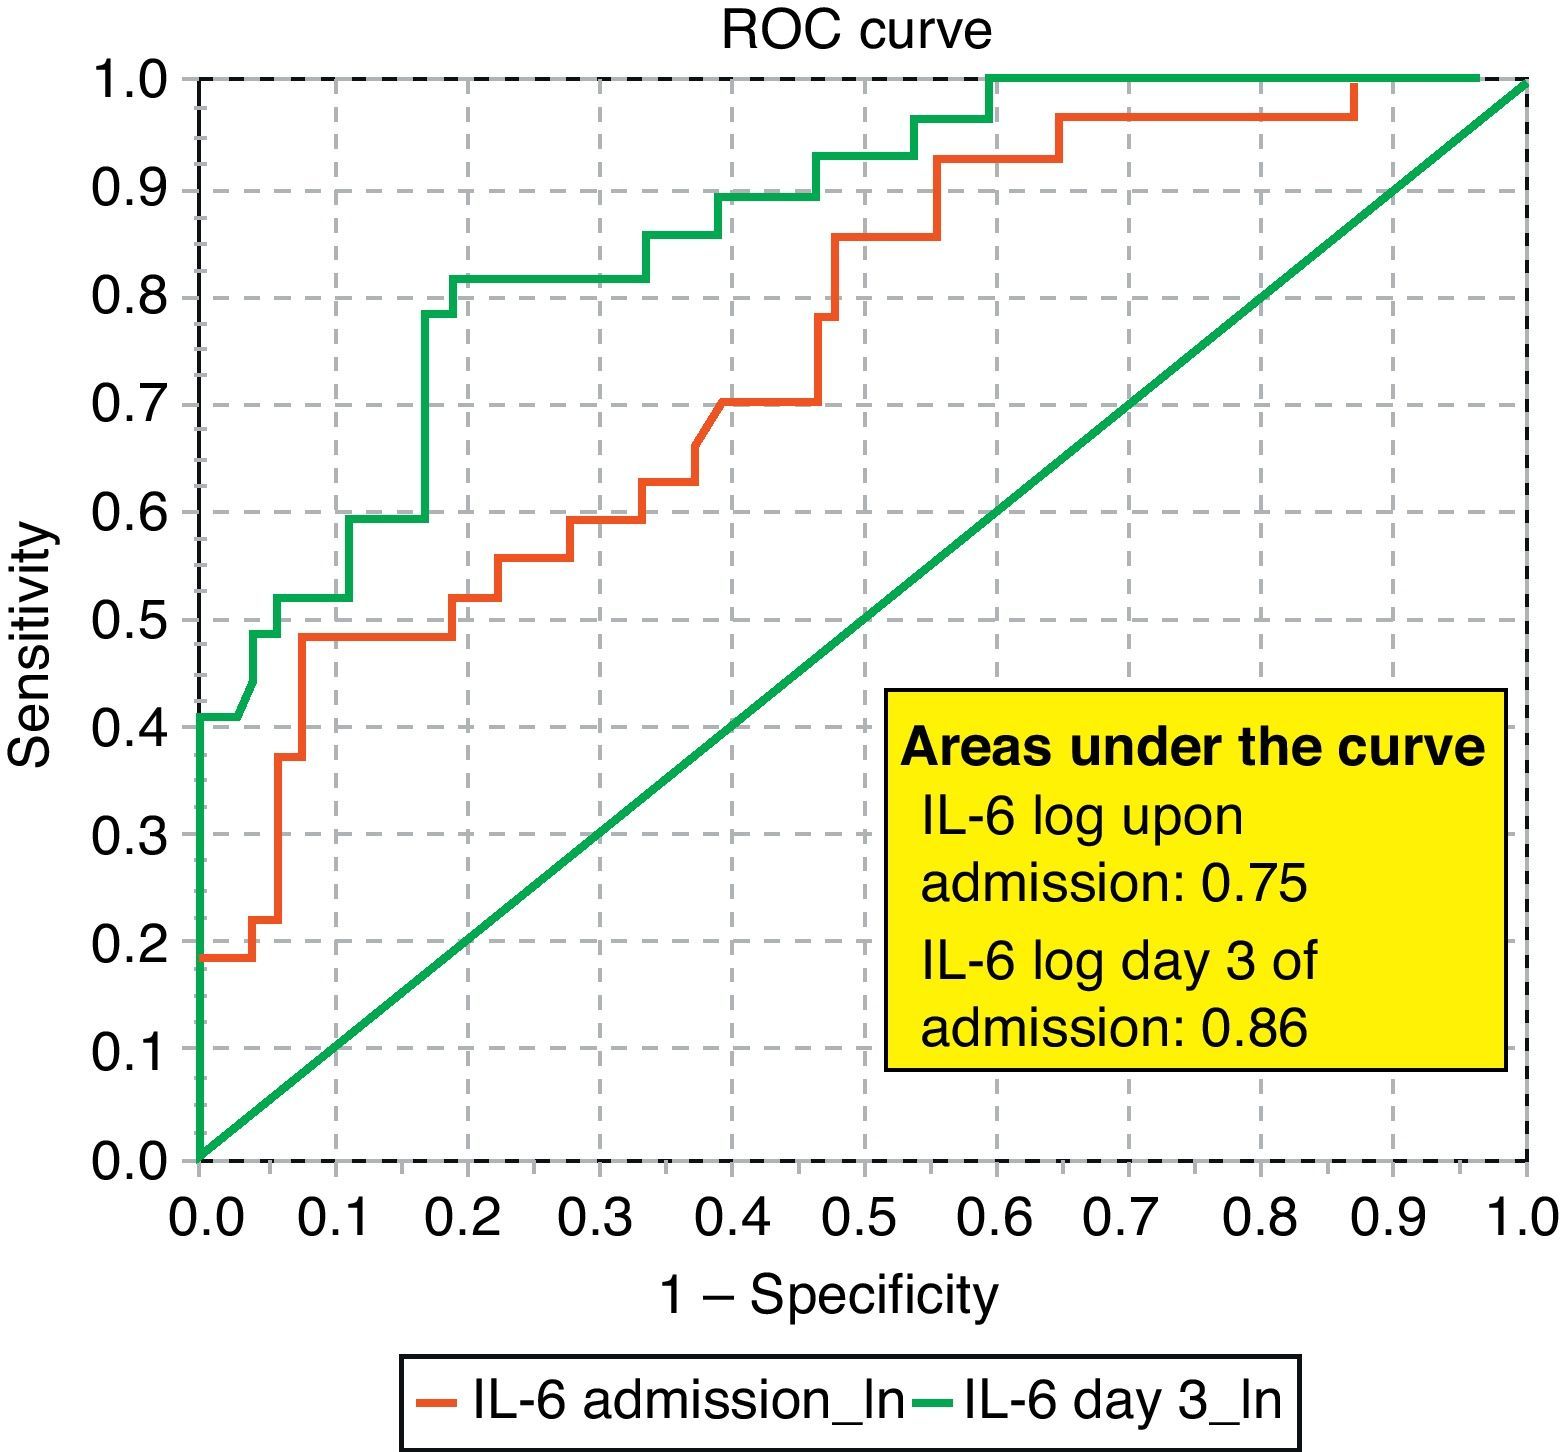
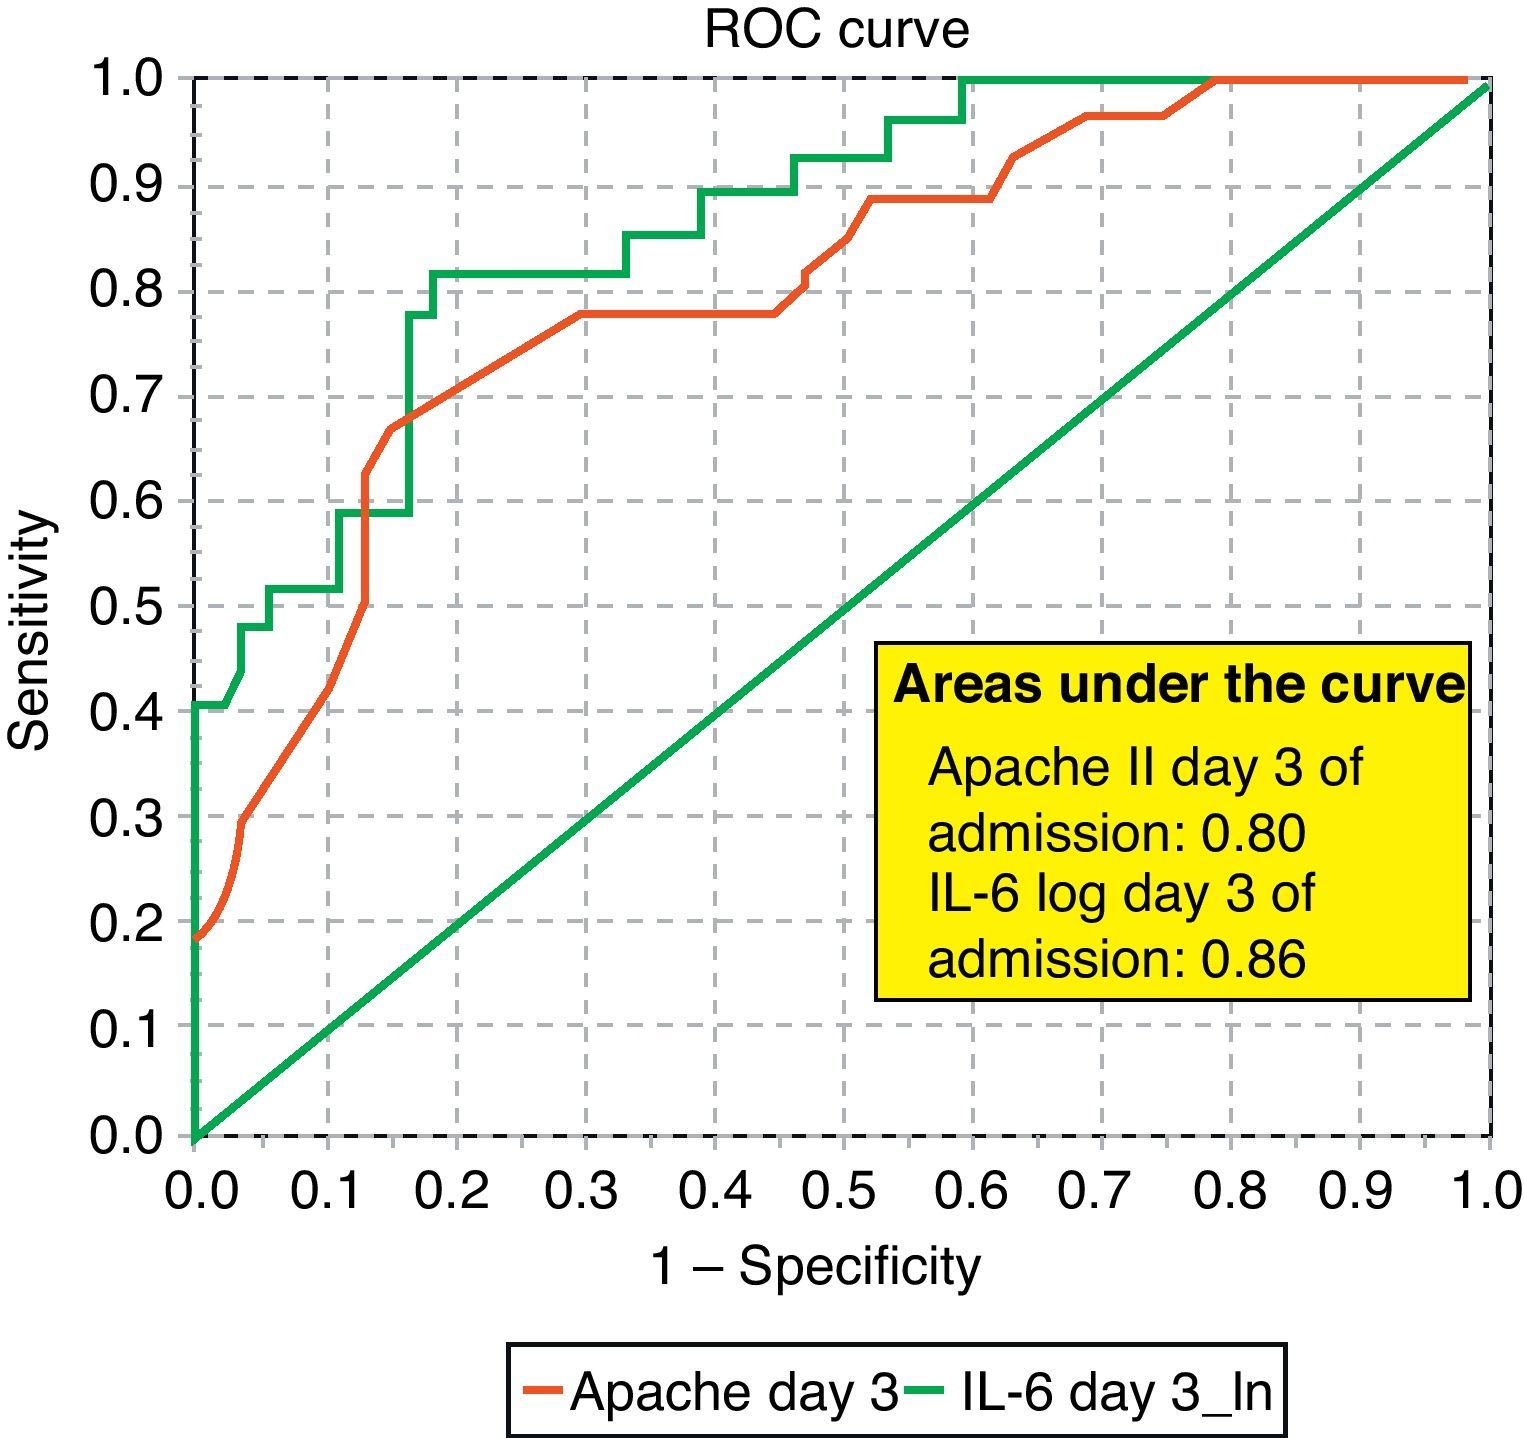
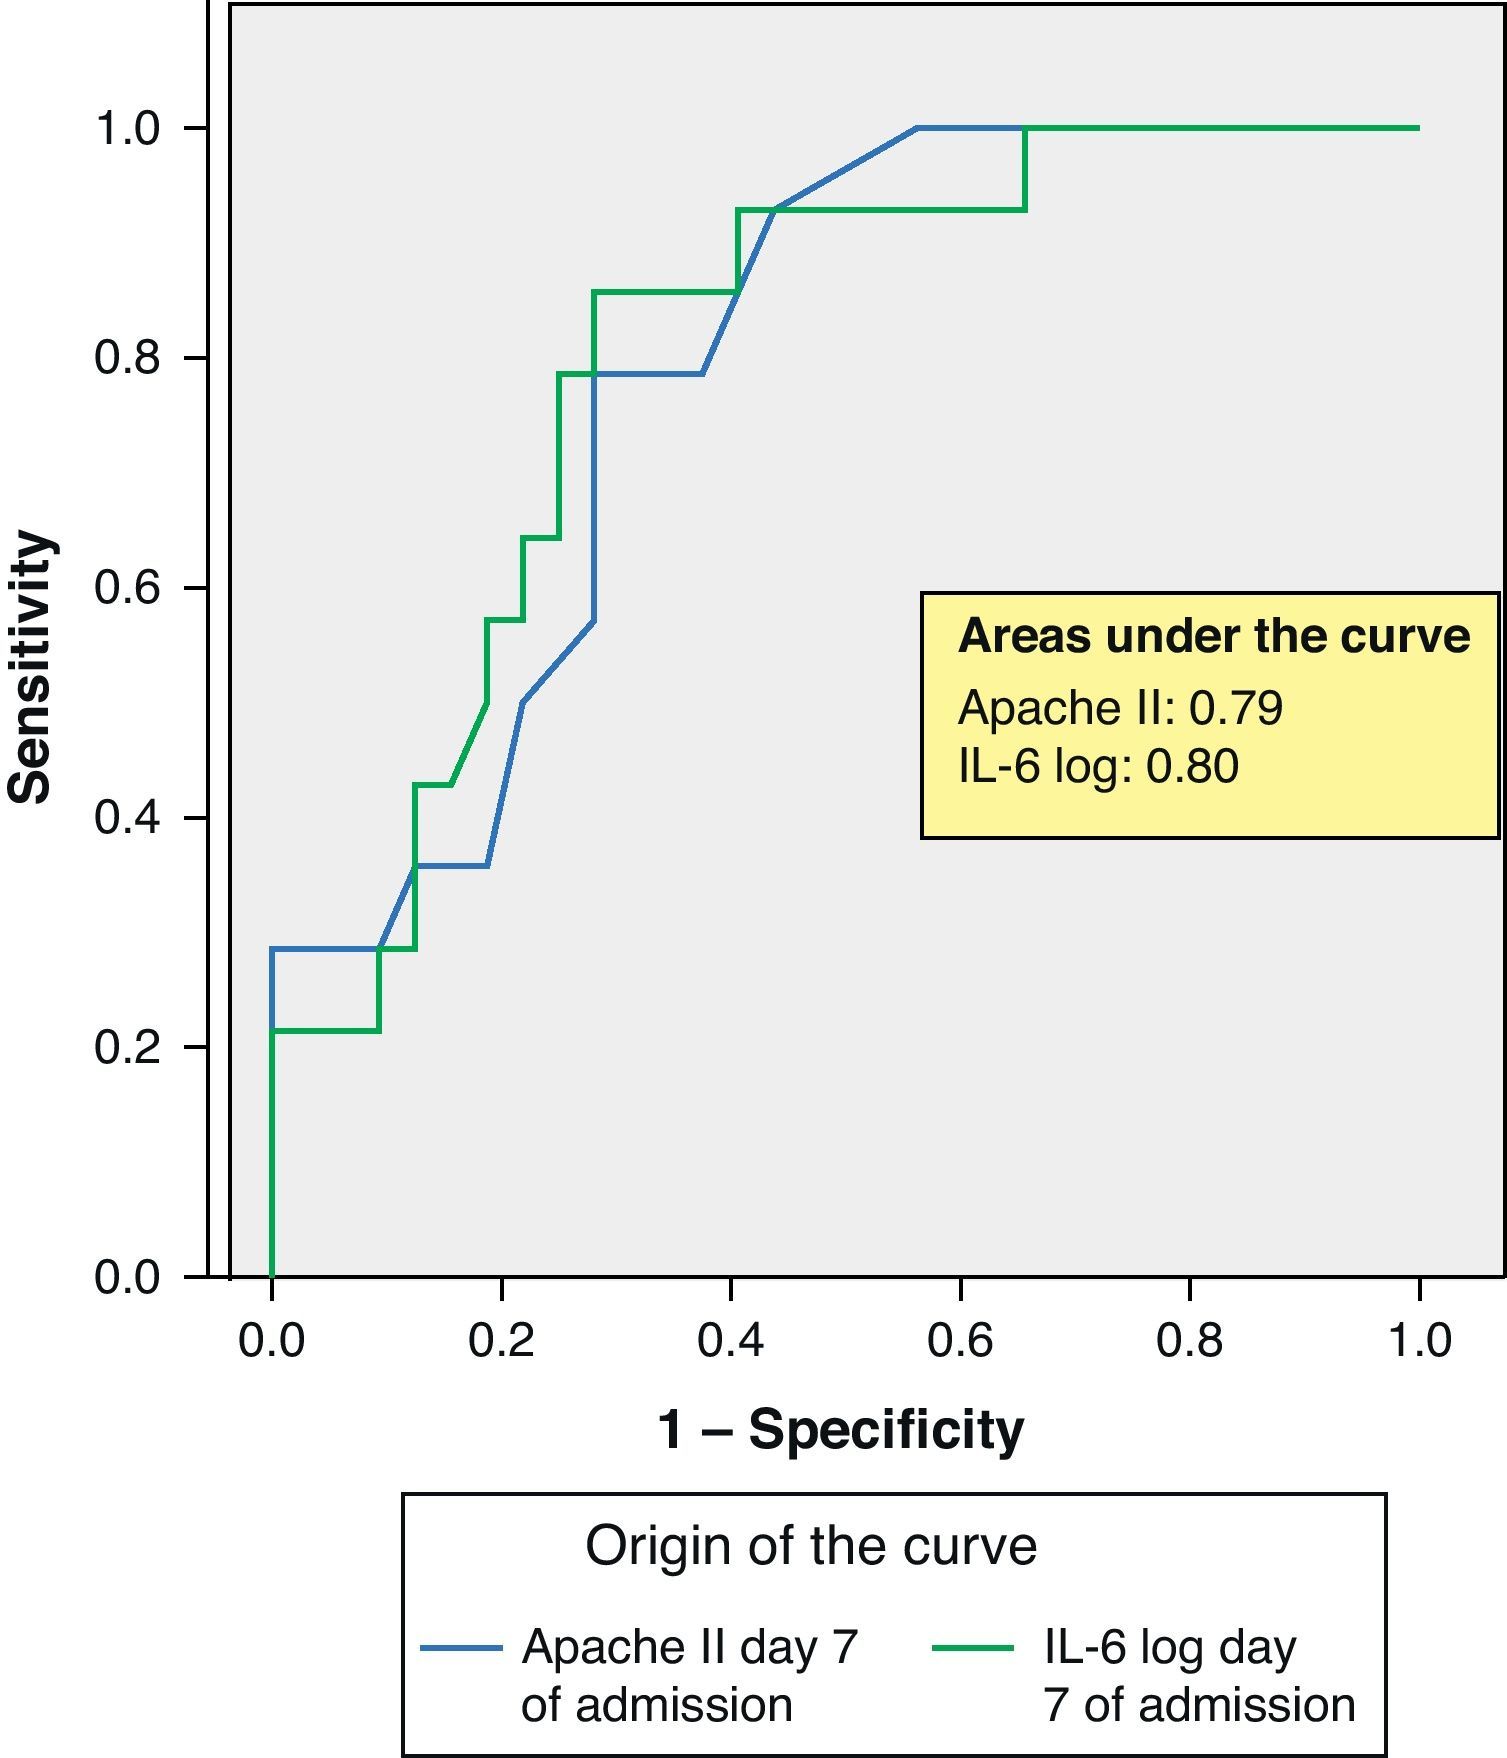
ROC curves: The curves corresponding to the Apache II score and IL-6 log upon admission presented areas of 0.76 (95%CI 0.65–0.88) and 0.74 (95%CI 0.63–0.86), respectively (Fig. 1). On day 3 of admission the areas were 0.80 (95%CI 0.70–0.90) and 0.86 (95%CI 0.78–0.94), respectively, i.e. much better than upon admission (Fig. 2). The comparison of the different curves corresponding to IL-6 log upon admission and on day 3 yielded significant differences (p=0.01) (Fig. 3), though significance was not observed on comparing the ROC curves of the Apache II score and IL-6 log on day 3 of admission (p=0.30) (Fig. 4). On day 7 of admission to the ICU, the area was 0.79 (95%CI 0.66–0.92) for the Apache II score and 0.80 (95%CI 0.67–0.93) for IL-6 log (Fig. 5). No comparisons were made between the ROC curves on day 7, since the sample size had decreased considerably as a result of patient death or discharge from the ICU.


The role of inflammatory markers in the diagnosis of sepsis and in the evaluation of its severity has been investigated, though the results obtained have been varied and even contradictory,21 probably as a consequence of the small sample sizes involved in the studies conducted to date.
Based on the recommendations of Vaschetto and Protti,21 we evaluated three different inflammatory markers (PCT, IL-6 and CRP) in septic patients, comparing both their capacity to predict mortality in the ICU and their MOF predicting potential versus other clinico-biological markers such as the Apache II and SOFA scores, and serum lactate.
According to the results obtained, IL-6 is clearly a predictor of mortality, particularly on the third day of admission, as reflected by the ROC curves and their comparisons (upon admission and after 3 days in the ICU). In this context, IL-6 shows a better area under the ROC curve than the Apache II score; as a result, it can be concluded that IL-6 is a better predictor of mortality than the Apache II score and may serve to complement the latter in many cases, since comparison of the two curves shows no differences. Some authors have confirmed our findings,22 while others have reported a strong correlation between IL-6 and mortality in patients with severe sepsis and MOF.23
Another significant finding is that serum lactate, particularly on day 3 of admission to the ICU, also shows mortality predicting capacity, though this variable was not the main focus of our study. Most authors agree that lactate is a very important severity biomarker particularly in shock patients, reflecting tissue hypoperfusion, and generally shows a correlation to serious patient conditions and a fatal outcome.24–26 According to our experience, patients with septic shock and a positive blood culture who on day 3 of admission exhibit serum lactate values of over 2.45mmol/l suffer increased mortality (non-published personal observations). Neither PCT nor CRP was found to be predictive of mortality in our population of patients.
Likewise, none of the inflammatory markers in our study were found to be predictive of MOF, with performances that did not exceed that of the SOFA score, though important differences were noted particularly in serum IL-6 between the patients who developed MOF and those who did not—in the same way as the PCT concentration from day 3 and particularly on day 7 of admission to the ICU. This latter finding was probably related to the increased severity of these patients, since there were also important differences in the Apache II scores.
Conflicts of interestThe authors declare that they have no conflicts of interest.
Please cite this article as: Miguel-Bayarri V, et al. Valor pronóstico de los biomarcadores procalcitonina, interleukina 6 y proteína C reactiva en la sepsis grave. Med Intensiva. 2012;36:556–62.