

Sepsis is an infection-caused syndrome, that leads to life-threatening organ damage. We aim to develop machine learning models with large-scale data to predict sepsis patients’ mortality.
Designwe extracted sepsis patients from two databases, Medical Information Mart for Intensive Care IV (MIMIC-IV) as a train set and Philips eICU Collaborative Research Database as a test set.
SettingICUs in multicenter hospitals in the USA during 2012–2019.
Patients or participantsA total of 21,680 sepsis-3 patients are included in the study, in which, 3771 patients were dead and 17,909 survived during hospitalization, respectively.
InterventionsNo interventions.
Main variables of interestBasic information, examination items during hospitalization and some medication and treatment information are incorporated into analyzed. Seven different models were built with a Support vector machine, Decision Tree Classifier, Random Forest, Gradients Boosting, Multiple Layer Perception, Xgboost, light Gradients Boosting to predict dead or live during hospitalization.
ResultsAlgorithms with an AUC value in the test set of the top three: light GBM, GBM, Xgboost. Considering the performance of the training set and the test set, the light GBM model performs best, and then the parameters of the model were adjusted, after that the AUC value was 0.99 in the train set, 0.96 in the test set, respectively.
ConclusionsModels built with light GBM algorithm from real-world sepsis patients from electronic health records accurately predict whether sepsis patients are dead and can be incorporated into clinical decision tools to enhance the prognosis of the patient and prevent adverse outcomes.
Desarrollar modelos de aprendizaje automático con datos a gran escala para predecir la mortalidad de los pacientes con sepsis.
DiseñoExtrajimos pacientes con sepsis de 2 bases de datos: MIMIC-IV como conjunto de entrenamiento y eICU-CRD como conjunto de prueba.
ÁmbitoUna UCI de un hospital multicéntrico de EE. UU. durante 2012-2019.
Pacientes o participantesSe incluyó en el estudio a un total de 21.680 pacientes con sepsis-3, de los cuales 3.771 fallecieron y 17.909 sobrevivieron durante la hospitalización.
IntervencionesSin intervenciones.
Principales variables de interésSe analizaron informaciones básicas, ítems de examen durante la hospitalización y algunos datos de medicación y tratamiento. Se utilizaron 7 modelos diferentes, por ejemplo, la GBM impulsado, para predecir la mortalidad o superviviencia durante la hospitalización.
ResultadosLos 3 primeros valores de AUC en el conjunto de pruebas fueron: GBM, GBM, Xgboost. Considerando el rendimiento del conjunto de entrenamiento y el conjunto de prueba, el modelo máquina de gradiente ligero impulsado funciona mejor; una vez se ajustaron los parámetros del modelo, el valor de AUC fue 0,99 en el conjunto de entrenamiento y 0,96 en el conjunto de prueba.
ConclusionesLos modelos de pacientes con sepsis del mundo real construidos con el algoritmo de la GBM impulsado a partir de registros de salud electrónicos predicen con precisión si los pacientes con sepsis morirán. También se pueden incorporar a las herramientas de decisión clínica para prevenir resultados adversos.
Sepsis, a common syndrome in intensive care units (ICU), is associated with the first leading cause of mortality in critically ill patients. It can cause significant health and economic burden that has attracted the government's attention and the public worldwide.1 Globally, there were an estimated 48.9 million sepsis cases and 11 million sepsis-related deaths in 2017. The numbers of death and new sepsis patients far exceed the numbers of myocardial infarction, or lung, breast, and prostate cancer combined.2–4 In developed countries, the incidence of severe sepsis is 4.00 cases per 1000 population, and in ICU, the incidence of sepsis is 20.6% in China.5–7 The cost of sepsis treatment in the United States has exceeded $20 billion, accounting for 5.2% of the total clinical cost in American hospitals in 2009, placing a substantial financial burden on patients and health care.8,9
Early and precautious sepsis diagnosis has been a hot topic of research in emergency medicine, critical care, and infectious diseases. However, the risk factors for sepsis death are currently not precise and comprehensive. Age is one of the risk factors for sepsis; studies have demonstrated that sepsis-related mortality has been reported to be almost 80% in patients above 80 years of age admitted to the intensive care unit (ICU).10 Body temperature is also a complicated risk factor because fever can make the imbalance of oxygen demand and supply even more severe. Zhang's study also has shown that antipyretic therapy has little effect on patient outcomes.11 On the other hand, some clinical lab items, such as Ang-2, Lactate, and PCT, have been widely used to detect sepsis prognosis and patient survival situations.12,13 Some laboratory hematologic biomarkers have shortcomings, such as poor stability, tedious process, and low predictive performance. Therefore, it is urgent to build a reliable and effective model for predicting the prognosis of sepsis based on multi-dimensional and multi-variable big data. Early and accurate identification of sepsis patients with a high risk of in-hospital death can help ICU physicians make optimal clinical decisions, which can, in turn, improve their clinical outcomes.14
Some scoring tools, such as the simplified acute physiology score (SAPS), the sequential organ failure assessment (SOFA) score, and so on, have been developed to assess the severity of critically ill patients.15,16 However, those severity scores systems were created and validated many years ago. The performance of predicting the development of some diseases among critical ill patients is not good because the facilities, techniques, and ideas for treating the patients have improved over time.17 Some scholars have recently created novel or modified classical score systems. Karakike et al. studied that the early change of SOFA can predict sepsis 28-day mortality (AUROC is 0.84), but the change takes seven days, so some patients cannot be predicted.18 As a clinical sign, Mottling can predict 14-day survival in patients with septic shock.19 National Early Warning Score 2 can also predict whether sepsis patients survive the first 72h after admission.20
With the accumulation of big data and the development of techniques for data storage, machine learning methods have attracted considerable research attention. In medicine, artificial intelligence (AI) algorithms are used in various fields such as medical imaging, pathology, electronic medical records, drug design, and bioinformatics. In 2017, Luregn J. et al. demonstrated that a pediatric sepsis score was established based on logistic regression to find relevant variables about sepsis death from 4403 children, and the AUC is 0.817 (95% CI (confidence interval) 0.779–0.855).21 In order to find some essential factors in predicting sepsis diagnosis, Fleuren published a meta-analysis review of sepsis predictive diagnosis in 2020, and their diagnostic test accuracy assessed by the AUROC ranged from 0.68 to 0.99 in the ICU.22 Based on real-world data, Hou established a 30-day death prediction model for patients with sepsis 3.0, and their XG boost model performs best (AUC: 0.857, 95% CI 0.839–0.876).23
To our knowledge, the current model of predicting whether patients meted criteria Sepsis 3.0 will die in hospital are not well-performance and lack a variety of comparative research papers with more significant numbers of machine learning utilizations and more recent information from the hospital. We do a study based on real-world data, which explores the performance of different machine learning algorithms and compares the performance of the classic logistic regression, using a new whole ICU database – Medical Information Mart for Intensive Care IV (MIMIC-IV) and also provides external databases – eICU Collaborative Research Database, a Multicenter database.
MethodSource of dataBeth Israel Deaconess Medical Center is a US preeminent academic medical center whose medical information system and equipment are high-advanced. Massachusetts Institute of Technology and Philips Health Care helped the hospital build an open-resource and high-quality database – Medical Information Mart for Intensive Care IV(MIMIC-IV).24 Currently, the MIMIC-IV contains more than 200,000 hospital admissions between 2008 and 2019 (inclusive). Compared with the MIMIC-III, the MIMIC-IV has some data such as demographics, vital signs, laboratory tests, drugs, continuous renal replacement therapy detailed parameters, machine ventilation, and so on; however, survival follow-up data after discharge are not yet available. The MIMIC-IV also updated some new data, adding data for patients in the emergency department and the hospital before the ICU. The documents International Classification of Diseases and Ninth/Tenth Revision (ICD-9/ICD-10) are included in the database. The other is the Philips electronic intensive unit Collaborative Research Databases (eICU-CRD), a multicenter clinical database of 795,780 patients admitted to 348 ICUs that houses data from the United States between 2014 and 2015.25 Those data are on the PhysioNet website (https://physionet.org/content/) and can only be downloaded after passing the Protecting Human Research Participants course. We complied with all relevant ethical regulations for the work and completed human subjects training through the CITI program (Record ID: 31260254). After the MIMIC-IV and eICU-CRD data were downloaded, PostgreSQL (version 10) was used for deployment visualization and localization on a personal computer.
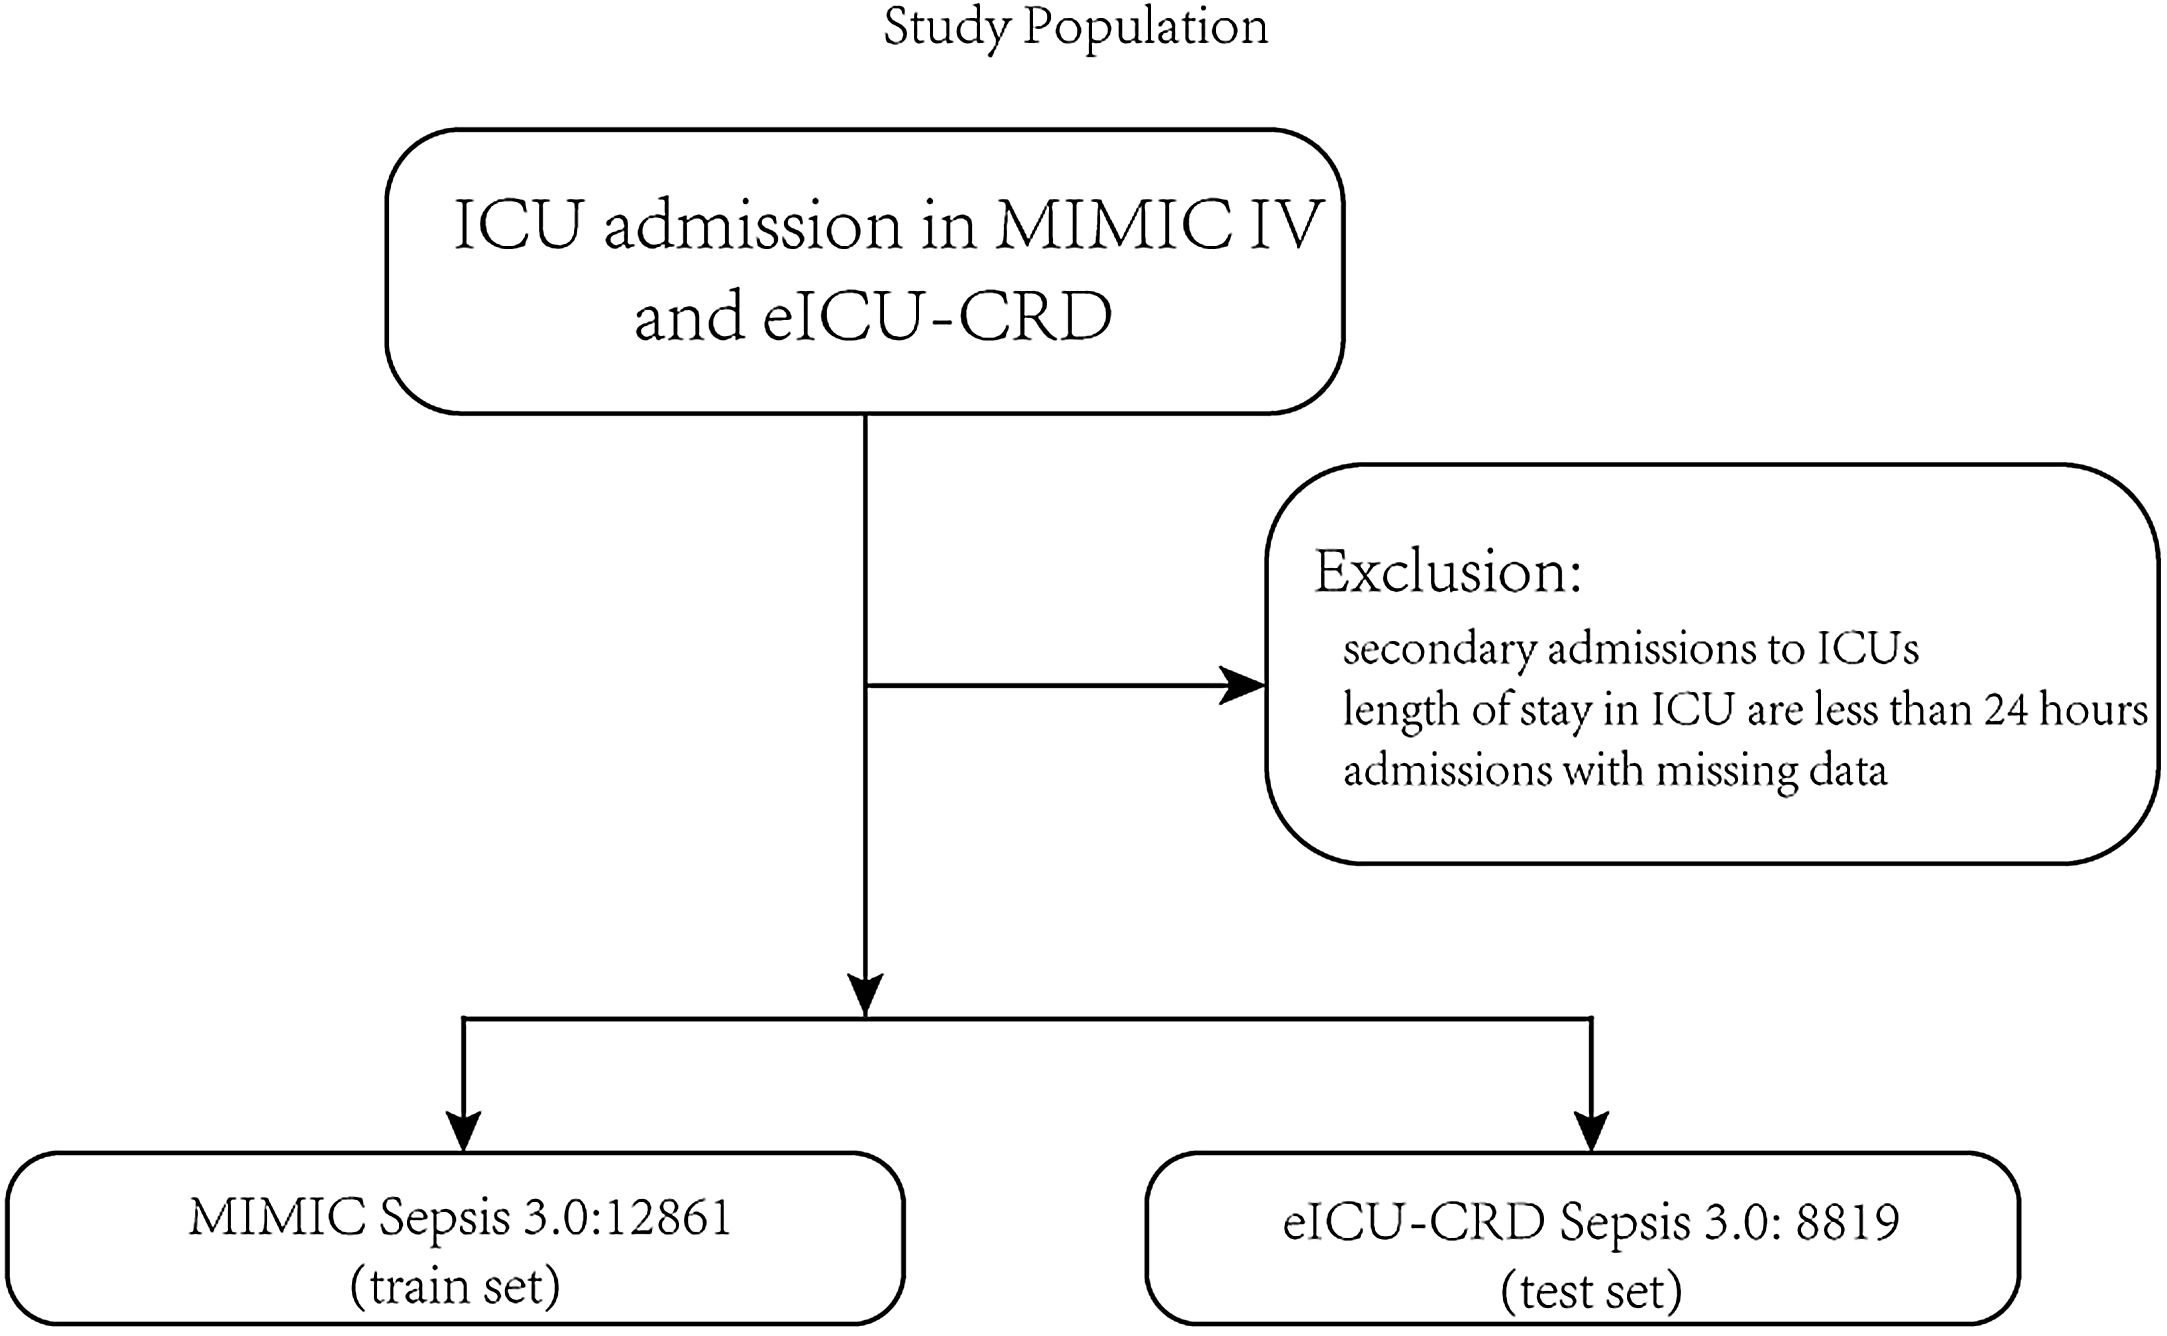
PatientsThe patients were identified in the MIMIC-IV database from 2008 to 2019 as the train set and the eICU-CRD database from 2014 to 2015 as the test set. Adult patients diagnosed with sepsis-3 were included in our study.1 The inclusion criteria were as follows: (1) patients who were older than 18 years old; (2) length of stay in the ICU was over 24h to ensure sufficient data for analysis; (3) patients the diagnosed with sepsis according to The Third International Consensus Definitions for Sepsis and Septic Shock (sepsis-3), SOFA≥2 and suspected infection in MIMIC-IV, and in the eICU-CRD, diagnosis sepsis 3.0 is used for sepsis patients with ‘sepsis’ and ‘septic’ in the discharge diagnosis and SOFA≥2 because there is no bacterial culture information, and the detailed codes can be found on the git-hub code; (4) patients who were the first admission in ICU. In this study, variables extracted from the database cover patients’ gender, age, height, weight, race, and various historical disease information. Clinical information of the patients includes different laboratory items, urine output, vasopressors, mechanical ventilation, GCS score, etc. The detailed code for extracting the data we uploaded to the git-hub site (https://github.com/BboyT/sepsis_predict) and we refer to the code of Sepsis 3.0 in MIMIC.26 The detailed process of data extraction is shown in Fig. 1.
Study design and setting
The following items in the hospital were recorded and used to build some prediction model: age, gender, weight, vital signs, and laboratory values of patients from the first 24h of ICU stay, which were extracted using pgAdmin PostgreSQL tools (version 10.17) and Navicat Premium (version 15.0.28). Because of the high sampling frequency, we use the maximum, minimum, and mean values when incorporating the characteristics of vital signs and related laboratory indicators. Furthermore, advanced cardiac life support (various vasopressors, continuous renal replacement therapy, etc.) and accompanying diseases (diabetes, arrhythmia, etc.) were accessed. After that, R software (version 4.1.2, CRAN) was used for further process. As it is common with missing data in the MIMIC-IV database, we removed the variables with more than 20% observations missing to facilitate and ensure the study's accuracy. However, for those with less than 20% missing or randomly missing data, we explored and visualized them with R Package «DataExplorer» and Package «mice» for further analysis. Missing values in the eICU-CRD set are also imputed with R Package «mice». We selected all variables in the feature screening part after removing missing values of more than 20% of items. We removed one variable from the Spearman coefficient correlation greater than 0.9 because the algorithm based on the tree-like model can filter out essential variables by themselves. The sample size in this feasibility study is enough, so the sample size was not calculated. The public code, supporting the MIMIC-IV and eICU documentation and generating the descriptive statistic, is publicly available, and contributions from the community of users are encouraged (https://github.com/MIT-LCP).
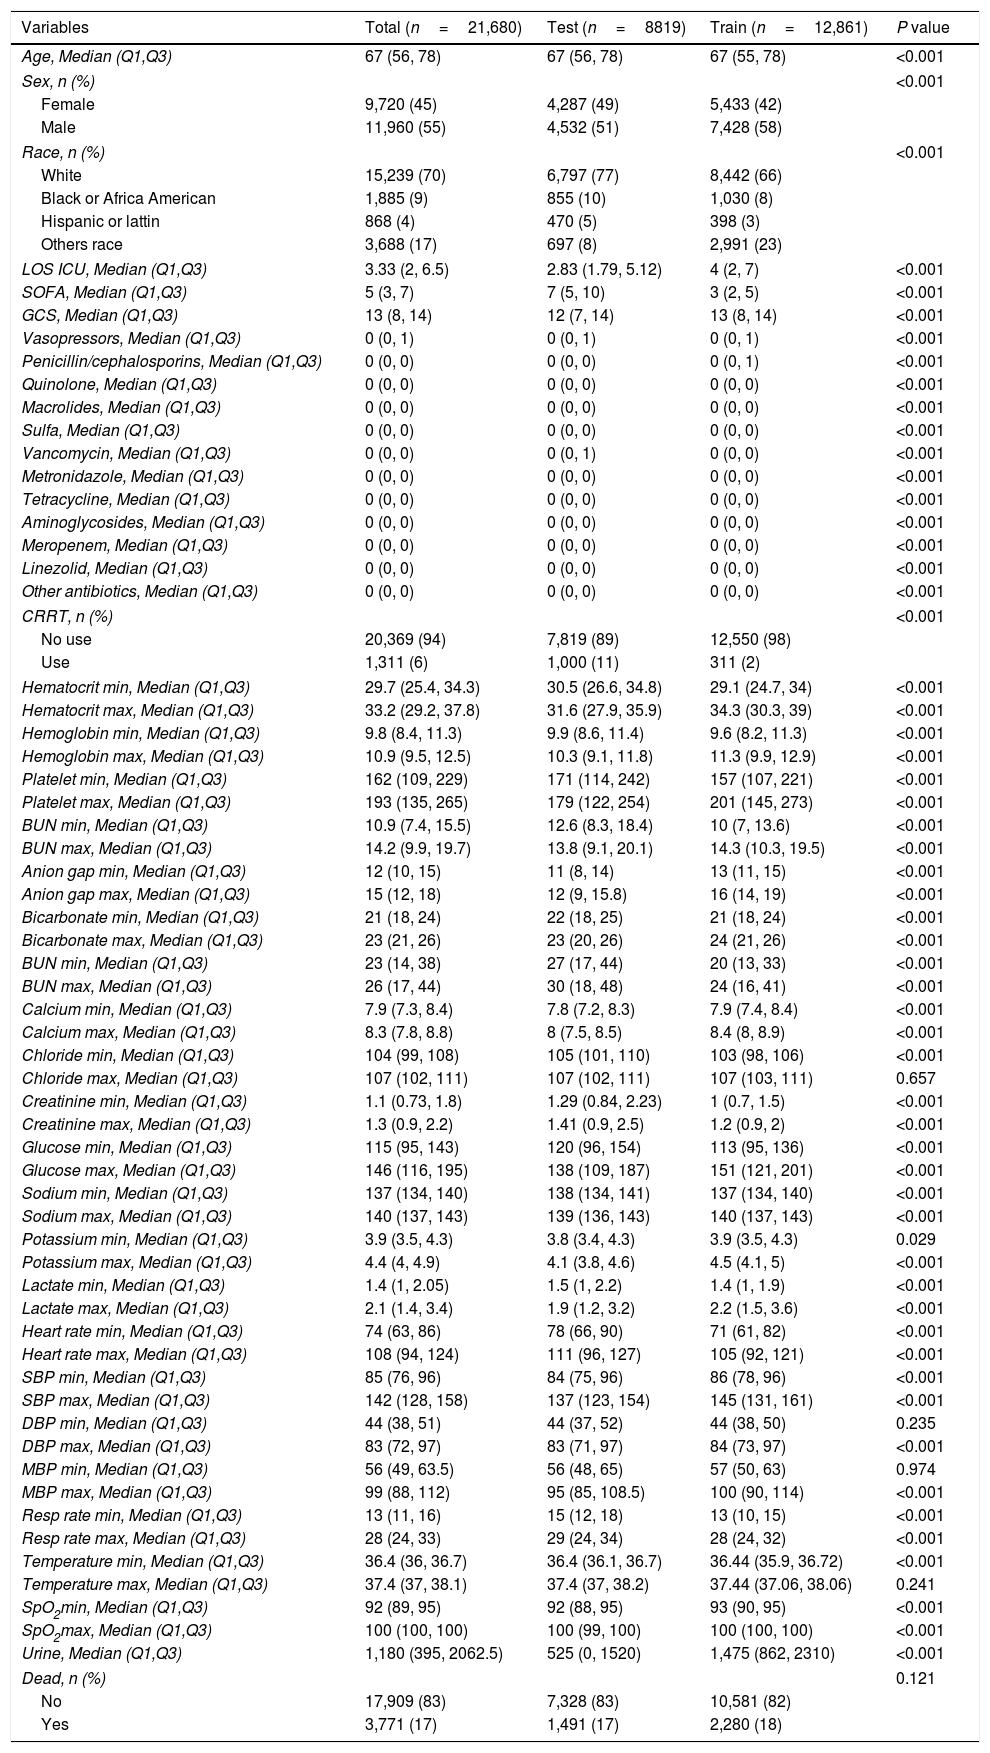
Statistical analysisPatients were divided into two groups between train cohorts and test cohorts during ICU, and variables were displayed and compared between groups (Table 1). Normally and non-normally distributed continuous variables were summarized as the mean±SD and the median, respectively. Continuous variables of normal distribution were tested by Kolmogorov–Smirnov test. Student's t-test, One-way ANOVA, Mann–Whitney U, or Kruskal–Wallis H test were used to compare continuous data of non-normally distribution, if appropriate. Categorical variables were expressed as numbers or percentages and assessed using the Chi-square test or Fisher's exact test according to different sample sizes as proper. All the analyses above were conducted using R Package «CBCgrps», and a p-value<0.05 was considered statistically significant.
Comparative baseline demographics of the train set and test set.
| Variables | Total (n=21,680) | Test (n=8819) | Train (n=12,861) | P value |
|---|---|---|---|---|
| Age, Median (Q1,Q3) | 67 (56, 78) | 67 (56, 78) | 67 (55, 78) | <0.001 |
| Sex, n (%) | <0.001 | |||
| Female | 9,720 (45) | 4,287 (49) | 5,433 (42) | |
| Male | 11,960 (55) | 4,532 (51) | 7,428 (58) | |
| Race, n (%) | <0.001 | |||
| White | 15,239 (70) | 6,797 (77) | 8,442 (66) | |
| Black or Africa American | 1,885 (9) | 855 (10) | 1,030 (8) | |
| Hispanic or lattin | 868 (4) | 470 (5) | 398 (3) | |
| Others race | 3,688 (17) | 697 (8) | 2,991 (23) | |
| LOS ICU, Median (Q1,Q3) | 3.33 (2, 6.5) | 2.83 (1.79, 5.12) | 4 (2, 7) | <0.001 |
| SOFA, Median (Q1,Q3) | 5 (3, 7) | 7 (5, 10) | 3 (2, 5) | <0.001 |
| GCS, Median (Q1,Q3) | 13 (8, 14) | 12 (7, 14) | 13 (8, 14) | <0.001 |
| Vasopressors, Median (Q1,Q3) | 0 (0, 1) | 0 (0, 1) | 0 (0, 1) | <0.001 |
| Penicillin/cephalosporins, Median (Q1,Q3) | 0 (0, 0) | 0 (0, 0) | 0 (0, 1) | <0.001 |
| Quinolone, Median (Q1,Q3) | 0 (0, 0) | 0 (0, 0) | 0 (0, 0) | <0.001 |
| Macrolides, Median (Q1,Q3) | 0 (0, 0) | 0 (0, 0) | 0 (0, 0) | <0.001 |
| Sulfa, Median (Q1,Q3) | 0 (0, 0) | 0 (0, 0) | 0 (0, 0) | <0.001 |
| Vancomycin, Median (Q1,Q3) | 0 (0, 0) | 0 (0, 1) | 0 (0, 0) | <0.001 |
| Metronidazole, Median (Q1,Q3) | 0 (0, 0) | 0 (0, 0) | 0 (0, 0) | <0.001 |
| Tetracycline, Median (Q1,Q3) | 0 (0, 0) | 0 (0, 0) | 0 (0, 0) | <0.001 |
| Aminoglycosides, Median (Q1,Q3) | 0 (0, 0) | 0 (0, 0) | 0 (0, 0) | <0.001 |
| Meropenem, Median (Q1,Q3) | 0 (0, 0) | 0 (0, 0) | 0 (0, 0) | <0.001 |
| Linezolid, Median (Q1,Q3) | 0 (0, 0) | 0 (0, 0) | 0 (0, 0) | <0.001 |
| Other antibiotics, Median (Q1,Q3) | 0 (0, 0) | 0 (0, 0) | 0 (0, 0) | <0.001 |
| CRRT, n (%) | <0.001 | |||
| No use | 20,369 (94) | 7,819 (89) | 12,550 (98) | |
| Use | 1,311 (6) | 1,000 (11) | 311 (2) | |
| Hematocrit min, Median (Q1,Q3) | 29.7 (25.4, 34.3) | 30.5 (26.6, 34.8) | 29.1 (24.7, 34) | <0.001 |
| Hematocrit max, Median (Q1,Q3) | 33.2 (29.2, 37.8) | 31.6 (27.9, 35.9) | 34.3 (30.3, 39) | <0.001 |
| Hemoglobin min, Median (Q1,Q3) | 9.8 (8.4, 11.3) | 9.9 (8.6, 11.4) | 9.6 (8.2, 11.3) | <0.001 |
| Hemoglobin max, Median (Q1,Q3) | 10.9 (9.5, 12.5) | 10.3 (9.1, 11.8) | 11.3 (9.9, 12.9) | <0.001 |
| Platelet min, Median (Q1,Q3) | 162 (109, 229) | 171 (114, 242) | 157 (107, 221) | <0.001 |
| Platelet max, Median (Q1,Q3) | 193 (135, 265) | 179 (122, 254) | 201 (145, 273) | <0.001 |
| BUN min, Median (Q1,Q3) | 10.9 (7.4, 15.5) | 12.6 (8.3, 18.4) | 10 (7, 13.6) | <0.001 |
| BUN max, Median (Q1,Q3) | 14.2 (9.9, 19.7) | 13.8 (9.1, 20.1) | 14.3 (10.3, 19.5) | <0.001 |
| Anion gap min, Median (Q1,Q3) | 12 (10, 15) | 11 (8, 14) | 13 (11, 15) | <0.001 |
| Anion gap max, Median (Q1,Q3) | 15 (12, 18) | 12 (9, 15.8) | 16 (14, 19) | <0.001 |
| Bicarbonate min, Median (Q1,Q3) | 21 (18, 24) | 22 (18, 25) | 21 (18, 24) | <0.001 |
| Bicarbonate max, Median (Q1,Q3) | 23 (21, 26) | 23 (20, 26) | 24 (21, 26) | <0.001 |
| BUN min, Median (Q1,Q3) | 23 (14, 38) | 27 (17, 44) | 20 (13, 33) | <0.001 |
| BUN max, Median (Q1,Q3) | 26 (17, 44) | 30 (18, 48) | 24 (16, 41) | <0.001 |
| Calcium min, Median (Q1,Q3) | 7.9 (7.3, 8.4) | 7.8 (7.2, 8.3) | 7.9 (7.4, 8.4) | <0.001 |
| Calcium max, Median (Q1,Q3) | 8.3 (7.8, 8.8) | 8 (7.5, 8.5) | 8.4 (8, 8.9) | <0.001 |
| Chloride min, Median (Q1,Q3) | 104 (99, 108) | 105 (101, 110) | 103 (98, 106) | <0.001 |
| Chloride max, Median (Q1,Q3) | 107 (102, 111) | 107 (102, 111) | 107 (103, 111) | 0.657 |
| Creatinine min, Median (Q1,Q3) | 1.1 (0.73, 1.8) | 1.29 (0.84, 2.23) | 1 (0.7, 1.5) | <0.001 |
| Creatinine max, Median (Q1,Q3) | 1.3 (0.9, 2.2) | 1.41 (0.9, 2.5) | 1.2 (0.9, 2) | <0.001 |
| Glucose min, Median (Q1,Q3) | 115 (95, 143) | 120 (96, 154) | 113 (95, 136) | <0.001 |
| Glucose max, Median (Q1,Q3) | 146 (116, 195) | 138 (109, 187) | 151 (121, 201) | <0.001 |
| Sodium min, Median (Q1,Q3) | 137 (134, 140) | 138 (134, 141) | 137 (134, 140) | <0.001 |
| Sodium max, Median (Q1,Q3) | 140 (137, 143) | 139 (136, 143) | 140 (137, 143) | <0.001 |
| Potassium min, Median (Q1,Q3) | 3.9 (3.5, 4.3) | 3.8 (3.4, 4.3) | 3.9 (3.5, 4.3) | 0.029 |
| Potassium max, Median (Q1,Q3) | 4.4 (4, 4.9) | 4.1 (3.8, 4.6) | 4.5 (4.1, 5) | <0.001 |
| Lactate min, Median (Q1,Q3) | 1.4 (1, 2.05) | 1.5 (1, 2.2) | 1.4 (1, 1.9) | <0.001 |
| Lactate max, Median (Q1,Q3) | 2.1 (1.4, 3.4) | 1.9 (1.2, 3.2) | 2.2 (1.5, 3.6) | <0.001 |
| Heart rate min, Median (Q1,Q3) | 74 (63, 86) | 78 (66, 90) | 71 (61, 82) | <0.001 |
| Heart rate max, Median (Q1,Q3) | 108 (94, 124) | 111 (96, 127) | 105 (92, 121) | <0.001 |
| SBP min, Median (Q1,Q3) | 85 (76, 96) | 84 (75, 96) | 86 (78, 96) | <0.001 |
| SBP max, Median (Q1,Q3) | 142 (128, 158) | 137 (123, 154) | 145 (131, 161) | <0.001 |
| DBP min, Median (Q1,Q3) | 44 (38, 51) | 44 (37, 52) | 44 (38, 50) | 0.235 |
| DBP max, Median (Q1,Q3) | 83 (72, 97) | 83 (71, 97) | 84 (73, 97) | <0.001 |
| MBP min, Median (Q1,Q3) | 56 (49, 63.5) | 56 (48, 65) | 57 (50, 63) | 0.974 |
| MBP max, Median (Q1,Q3) | 99 (88, 112) | 95 (85, 108.5) | 100 (90, 114) | <0.001 |
| Resp rate min, Median (Q1,Q3) | 13 (11, 16) | 15 (12, 18) | 13 (10, 15) | <0.001 |
| Resp rate max, Median (Q1,Q3) | 28 (24, 33) | 29 (24, 34) | 28 (24, 32) | <0.001 |
| Temperature min, Median (Q1,Q3) | 36.4 (36, 36.7) | 36.4 (36.1, 36.7) | 36.44 (35.9, 36.72) | <0.001 |
| Temperature max, Median (Q1,Q3) | 37.4 (37, 38.1) | 37.4 (37, 38.2) | 37.44 (37.06, 38.06) | 0.241 |
| SpO2min, Median (Q1,Q3) | 92 (89, 95) | 92 (88, 95) | 93 (90, 95) | <0.001 |
| SpO2max, Median (Q1,Q3) | 100 (100, 100) | 100 (99, 100) | 100 (100, 100) | <0.001 |
| Urine, Median (Q1,Q3) | 1,180 (395, 2062.5) | 525 (0, 1520) | 1,475 (862, 2310) | <0.001 |
| Dead, n (%) | 0.121 | |||
| No | 17,909 (83) | 7,328 (83) | 10,581 (82) | |
| Yes | 3,771 (17) | 1,491 (17) | 2,280 (18) | |
Abbreviation: LOS ICU, length of stay in ICU; WBC, white blood cells; BUN, blood urea nitrogen; SBP, systolic blood pressure; DBP, diastolic blood pressure; MBP, mean arterial pressure; Resp rate, respiratory rate; SOFA, Sequential Organ Failure Assessment; GCS, Glasgow Coma Scale; CRRT, continuous renal replacement therapy.
The dataset was split into two groups to develop the models: MIMIC-IV as a training set and eICU-CRD as a test set. Before training, we normalized all continuous variables. To solve the class imbalance problem, we use the sampling method of ‘ClusterCentroids’ from the ‘imblearn’ package in Python. In the classical logistic regression model, we used the Lasso regression method to screen variables and then construct a predictive model for hospitalized sepsis patients. Predictive models based machine learning were built with (1) Support vector machine (SVM); (2) Decision Tree Classifier; (3) Random Forest; (4) Gradients Boosting (GBM); (5) Multiple Layer Perception (MLP); (6) Xgboost; (7) light Gradients Boosting. Firstly, in the model-comparison phase, we tested and compared the performances of the seven predictive models by the area under curves (AUCs) of the receiver operating characteristic curves (ROC), Precision and Recall curves, and F1 Score. The F1 score is the harmonic mean of precision and recall, calculated using (2*precision*recall)/(precision+recall). The cross-validation procedure was repeated five times (5-fold cross-validation). Then, we selected the model that achieved the highest overall diagnostic value for further optimizing the parameters using the grid tuning method. Thirdly, all features used by the model were ranked by characteristic importance. The models are built using python language, version 3.6.
ResultsThe study flow charts for both cohorts are shown in Fig. 1.
A total of 21,680 patients were enrolled in the study. 12,861 patients of the training cohort and 8819 patients of the test cohort could be diagnosed as sepsis patients according to the Sepsis-3 criteria and were included in the analysis. A comparison of baseline characteristics between the train and test cohorts is summarized in Table 1, and baseline characteristics between the dead patients during hospital and survival patients in Supplementary Table 1.
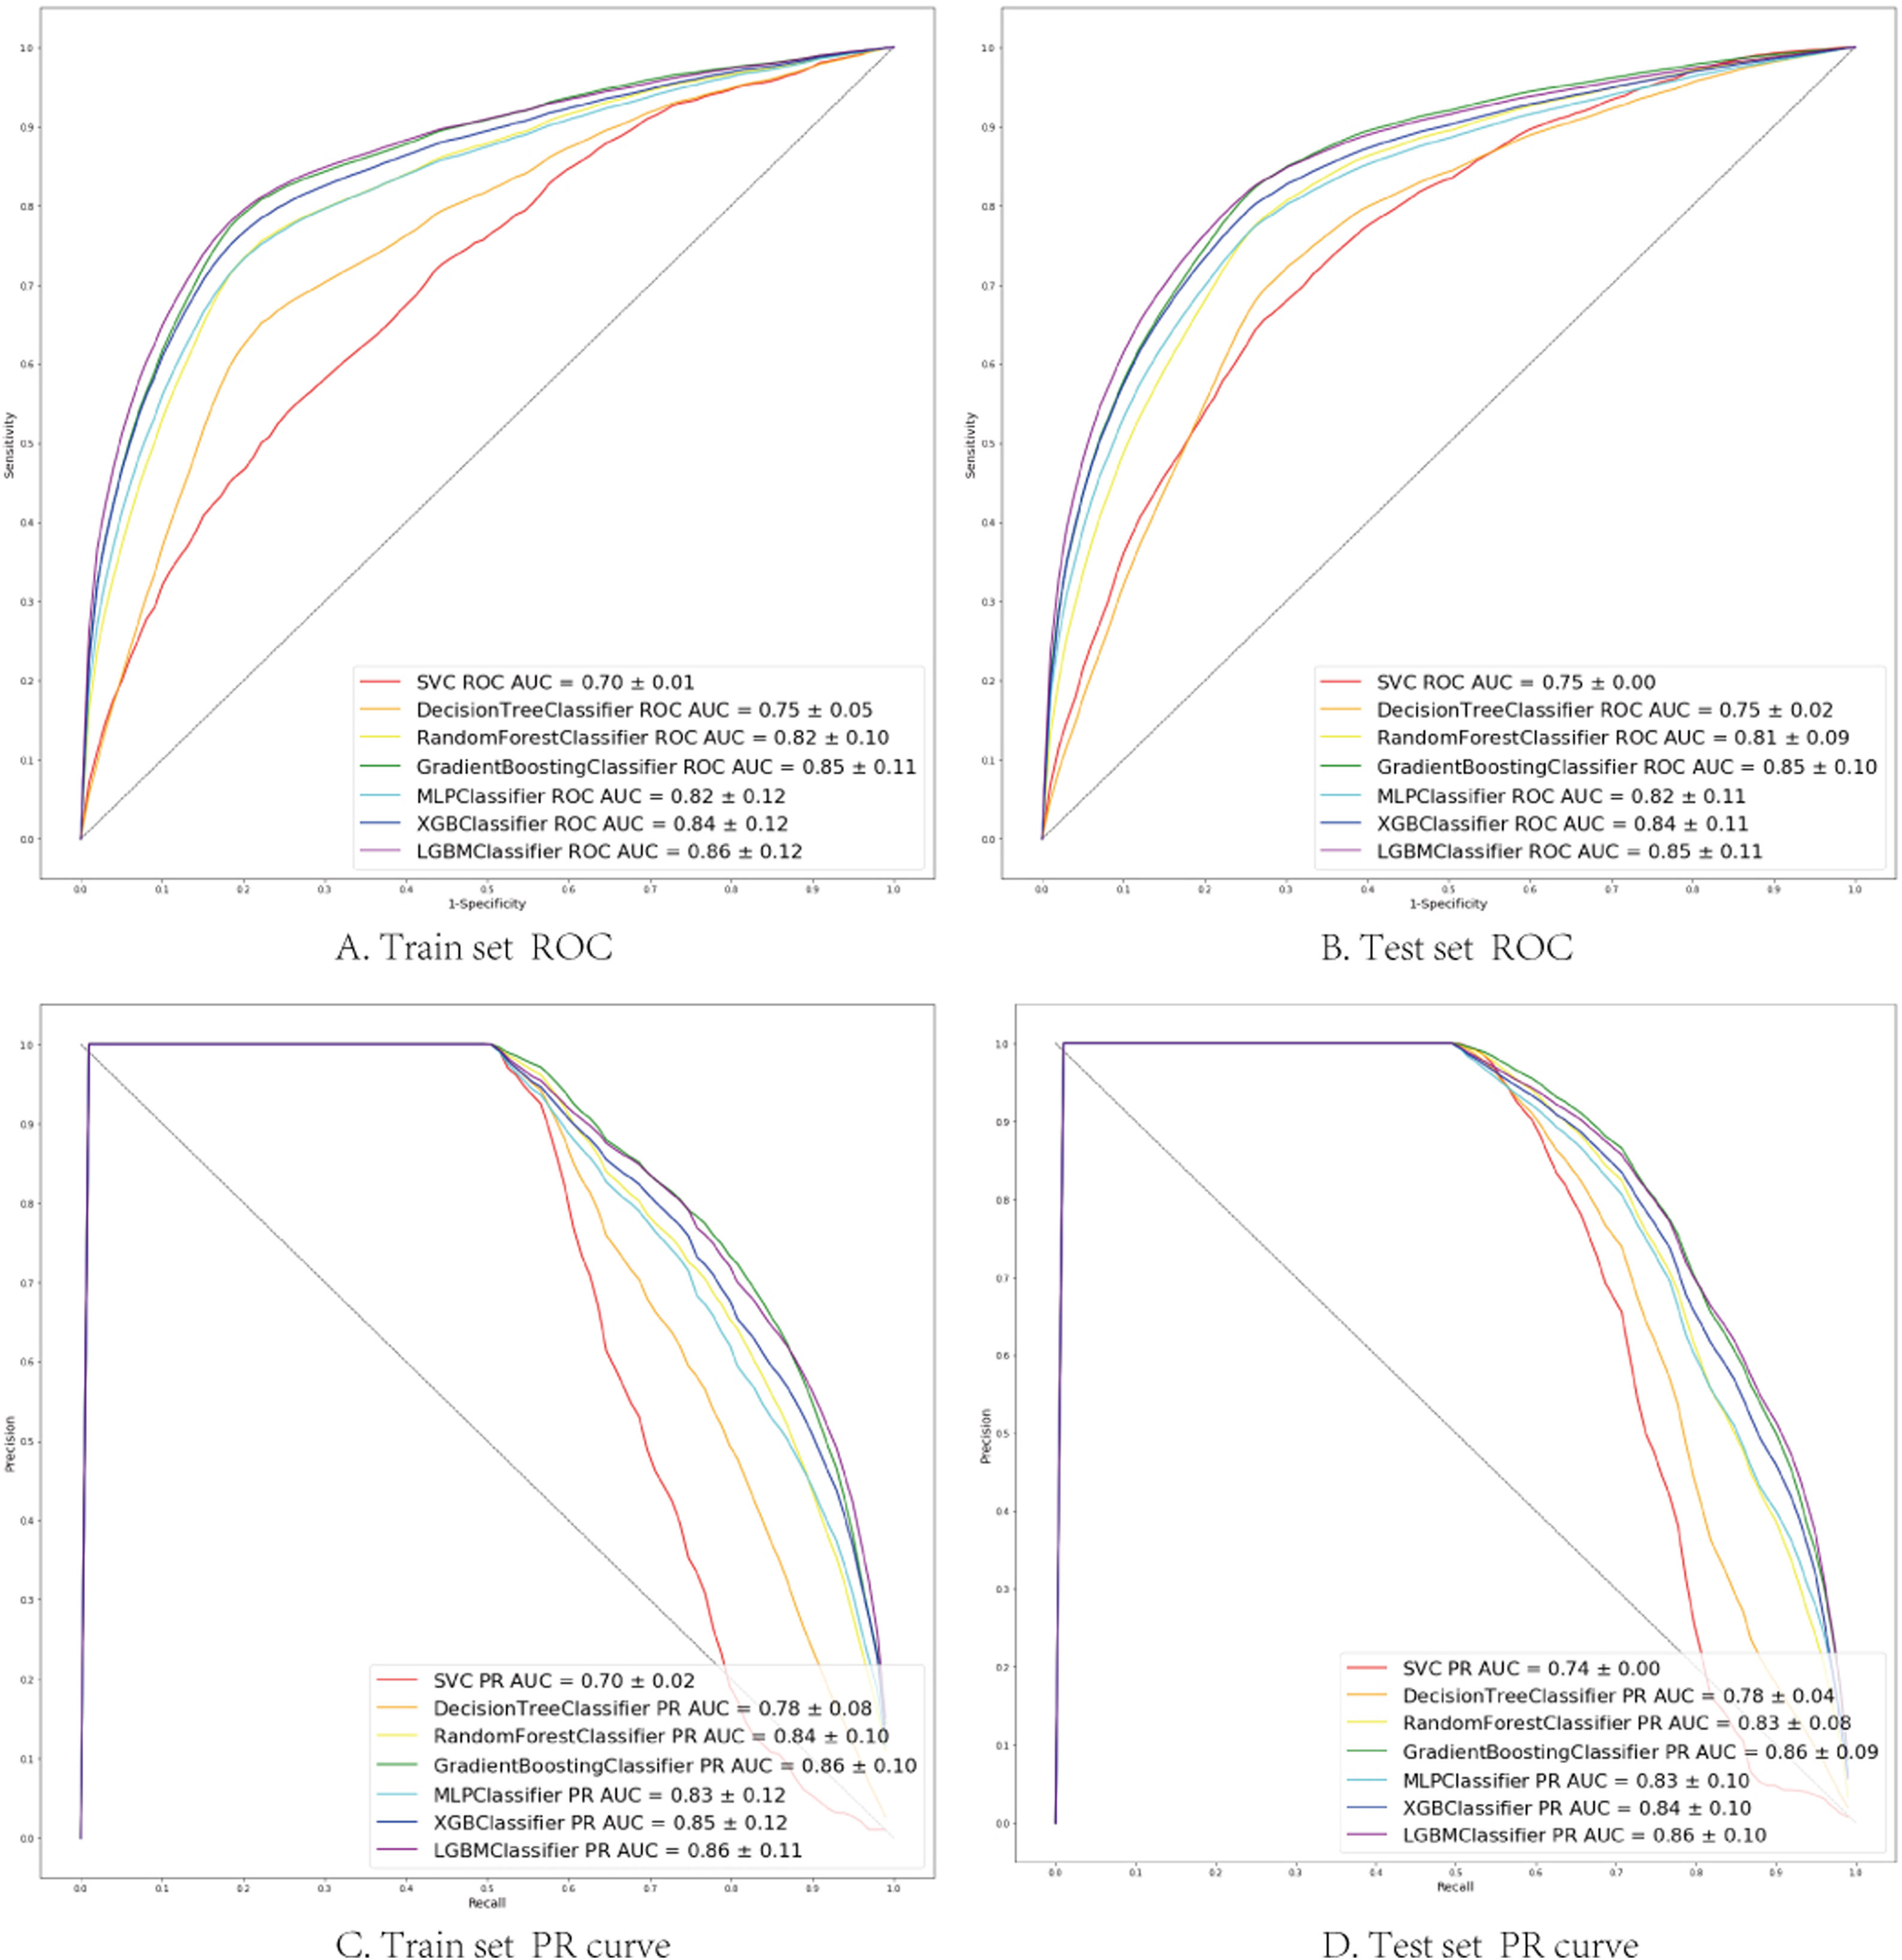
The seven algorithms were trained on the MIMIC-IV set and tested on the eICU-CRD set while building the model's process. The results of various machine learning models are presented using ROC curves, Precision-Recall curve, and F1 Score. In the training set, SVM prediction performance is the worst (AUC:0.70), while the light GBM prediction performance is the best (AUC:0.86). Algorithms with an AUC value of more than 0.80 are: GBM (AUC:0.85), Xgboost (AUC:0.84), Multi-layer perception (AUC:0.82) and Random Forest (AUC:0.82) (Fig. 2).
 Seven machine learning algorithms of ROC Curve (AUC mean±Std.) of the train set, test set; (C, D) Seven machine learning algorithms of Precision-Recall Curve (AUC mean±Std.) of the train set, test set. SVC (support vector machine classifier); Decision Tree Classifier; Random Forest Classifier; Gradient Boosting Classifier (Gradient Boosting Machine, GBM); MLP Classifier (Multi-layer perceptron); XGB Classifier (Extreme Gradient Boosting); LGBM Classifier (light GBM).")
(A, B) Seven machine learning algorithms of ROC Curve (AUC mean±Std.) of the train set, test set; (C, D) Seven machine learning algorithms of Precision-Recall Curve (AUC mean±Std.) of the train set, test set. SVC (support vector machine classifier); Decision Tree Classifier; Random Forest Classifier; Gradient Boosting Classifier (Gradient Boosting Machine, GBM); MLP Classifier (Multi-layer perceptron); XGB Classifier (Extreme Gradient Boosting); LGBM Classifier (light GBM).
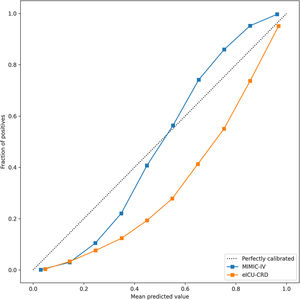
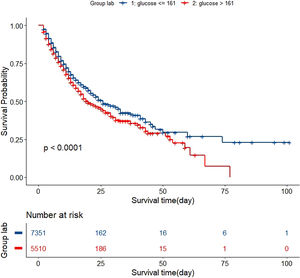
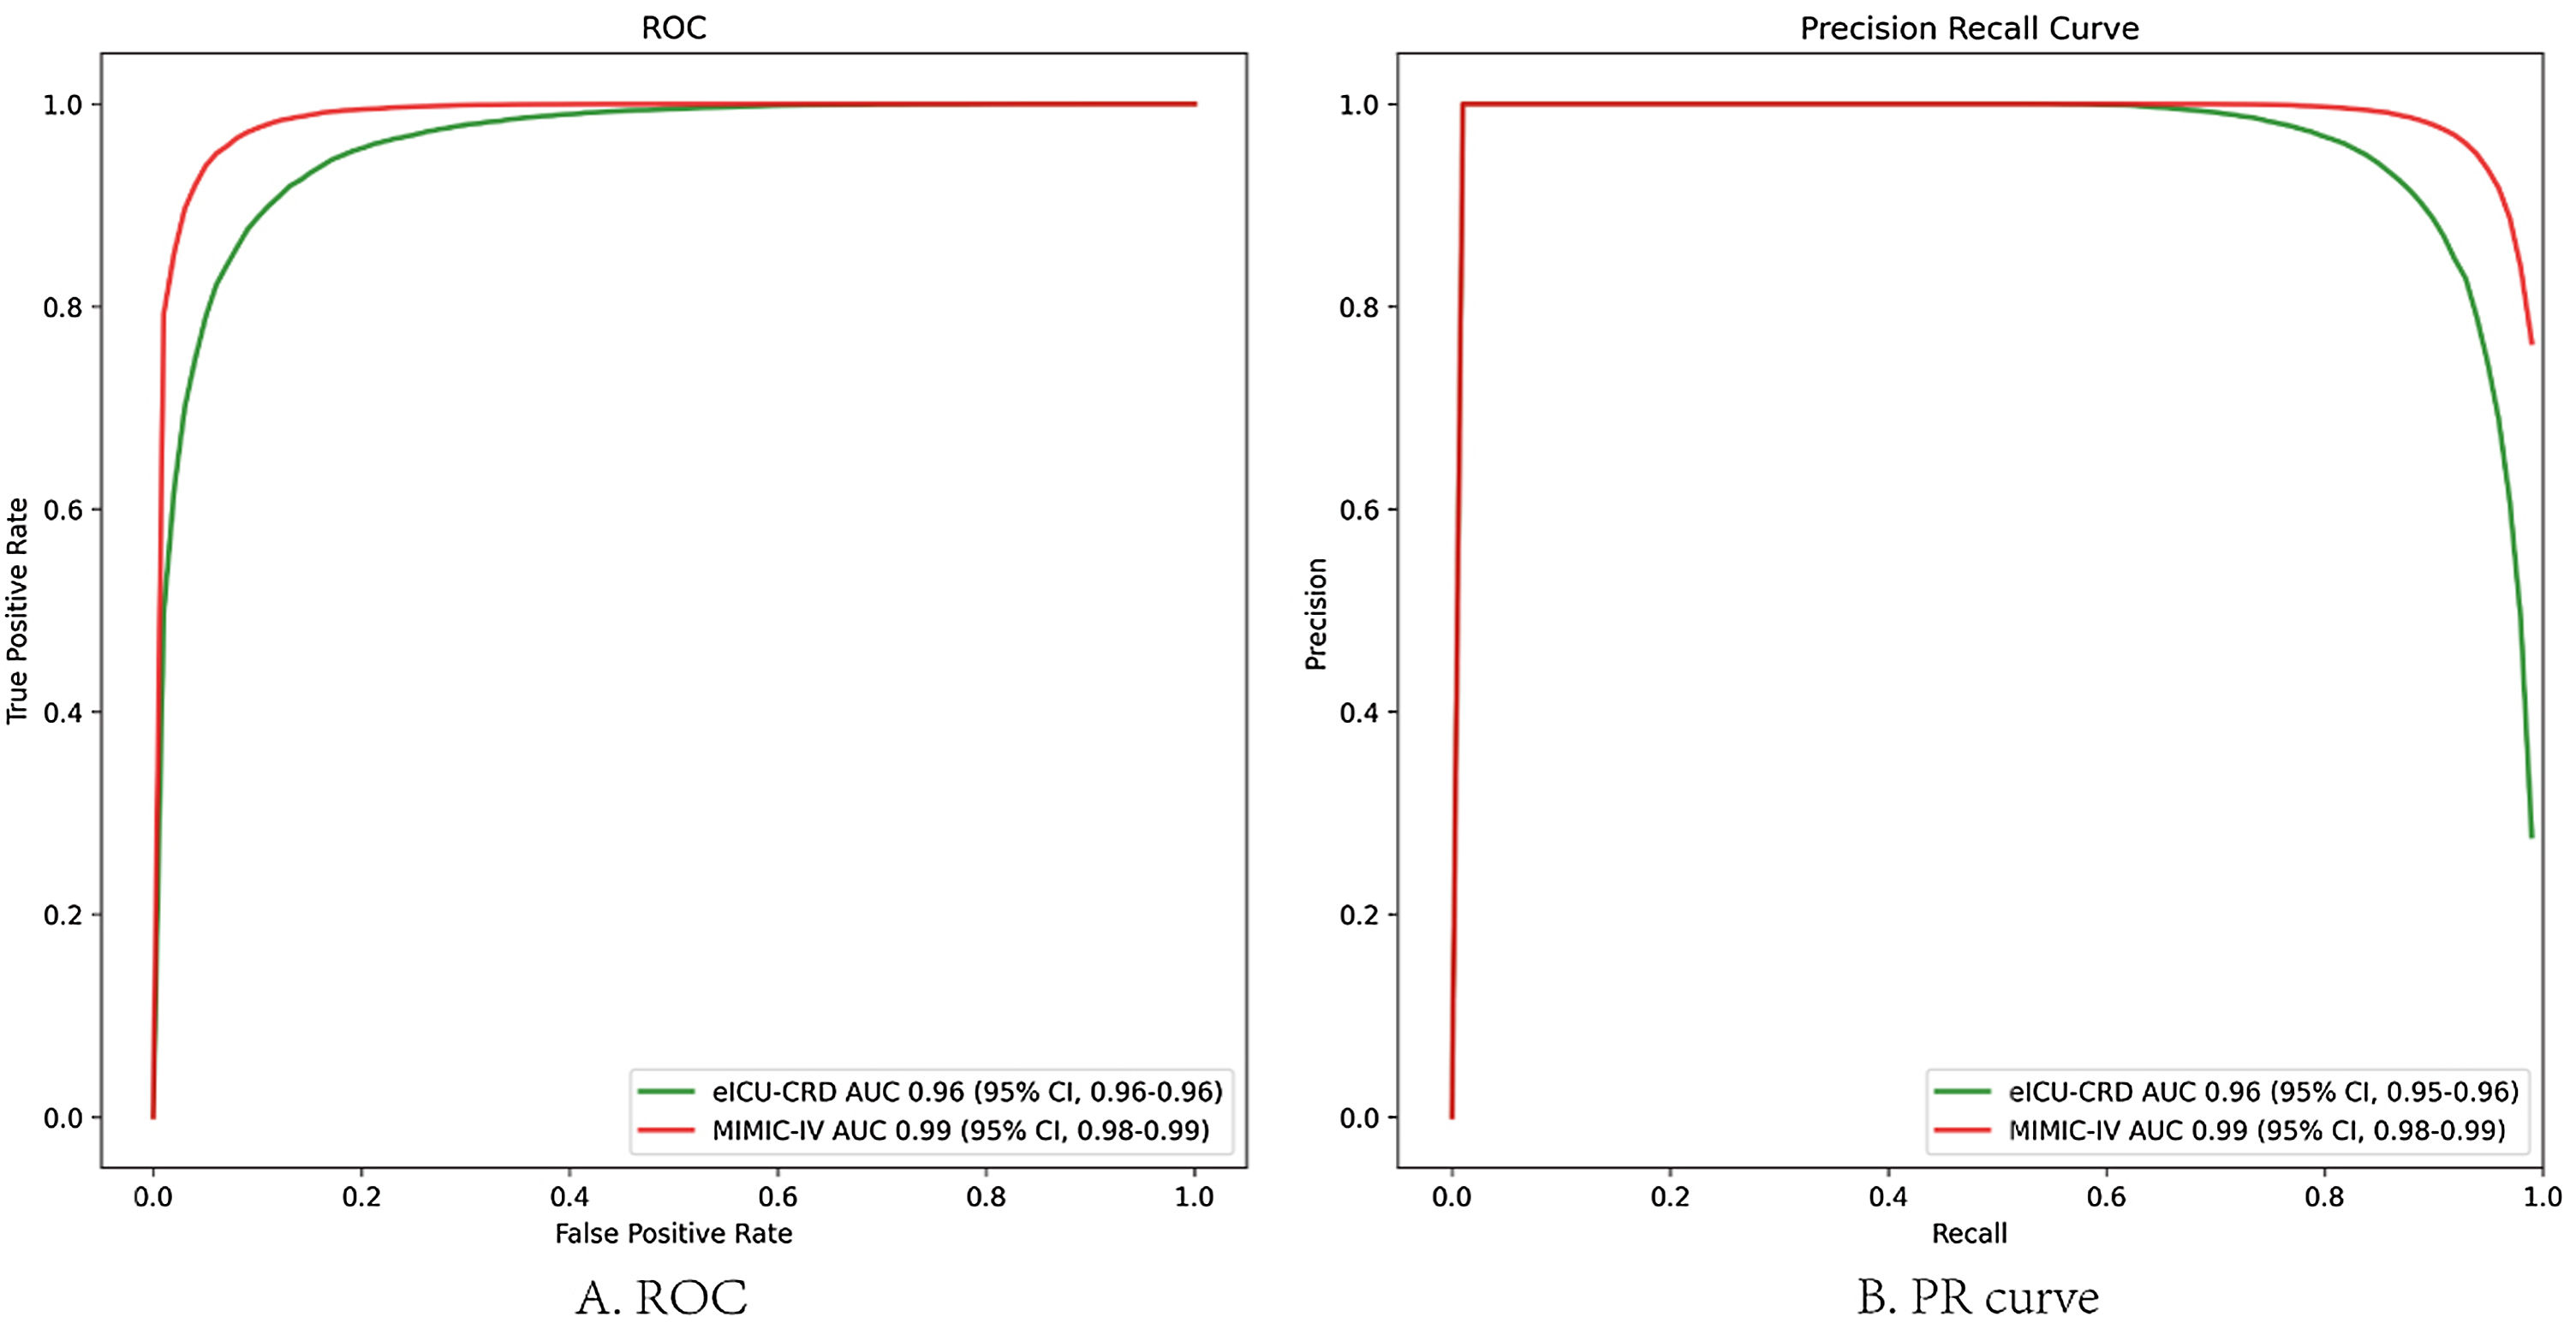
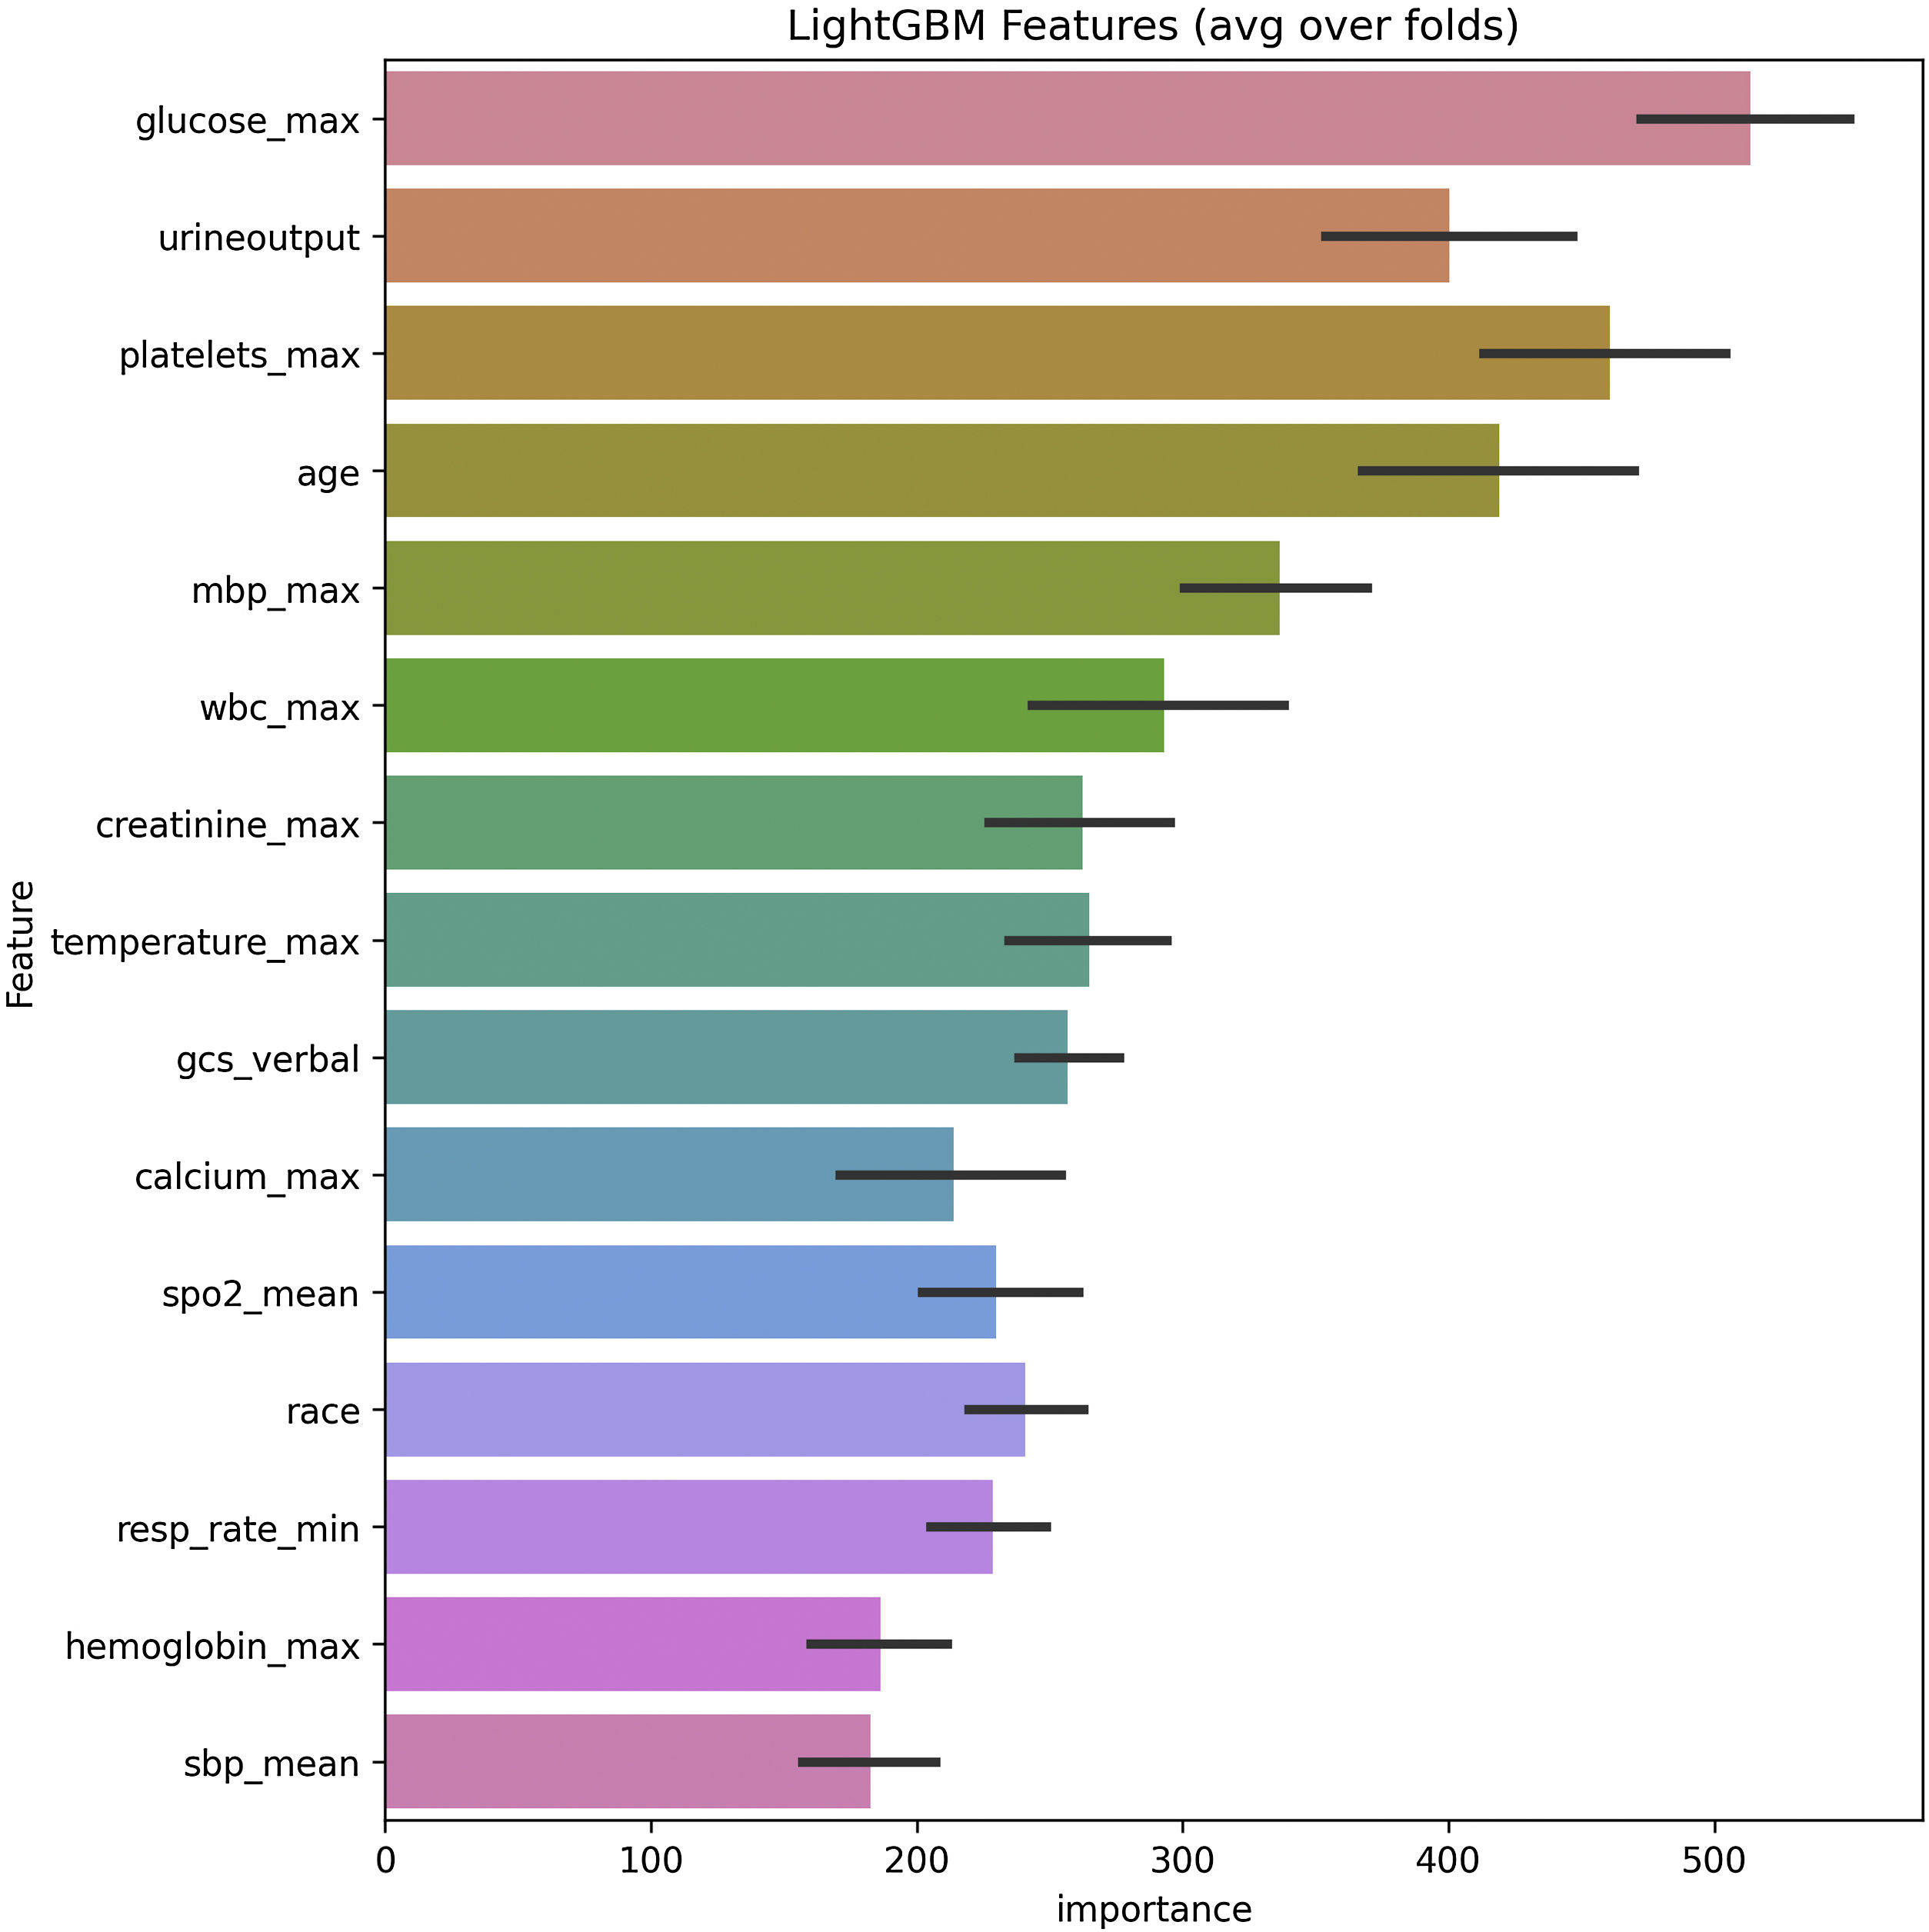
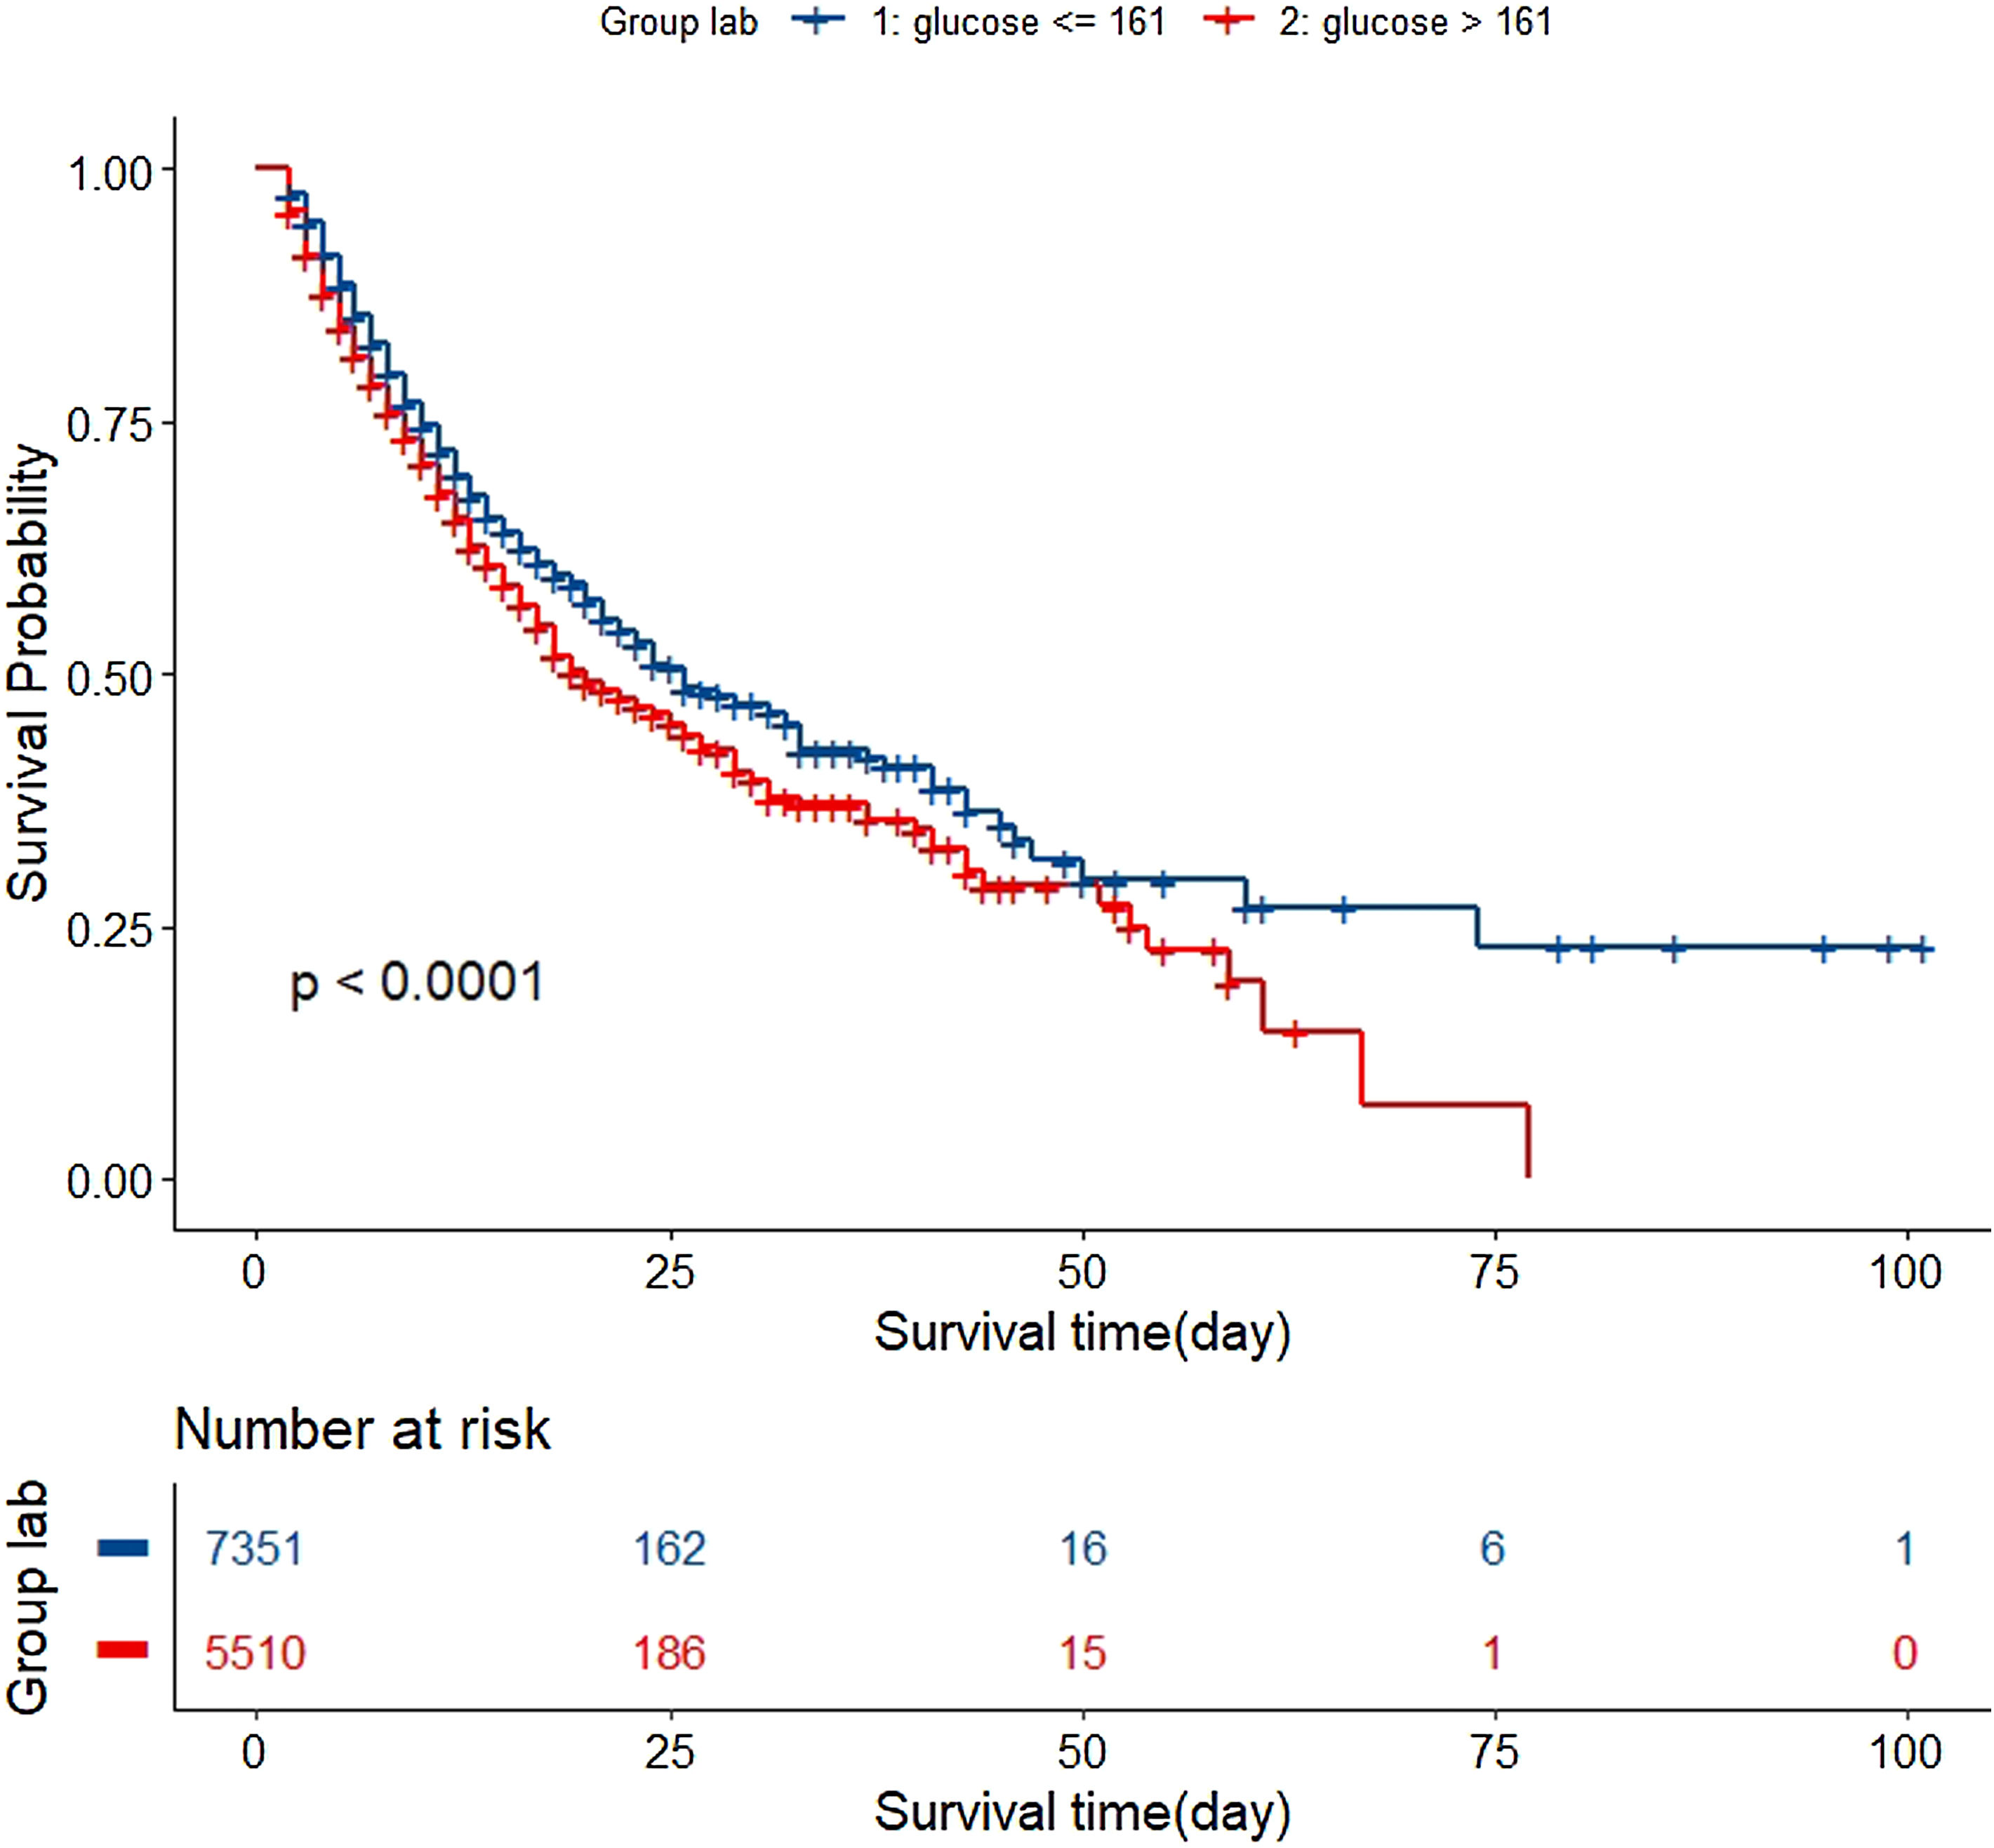
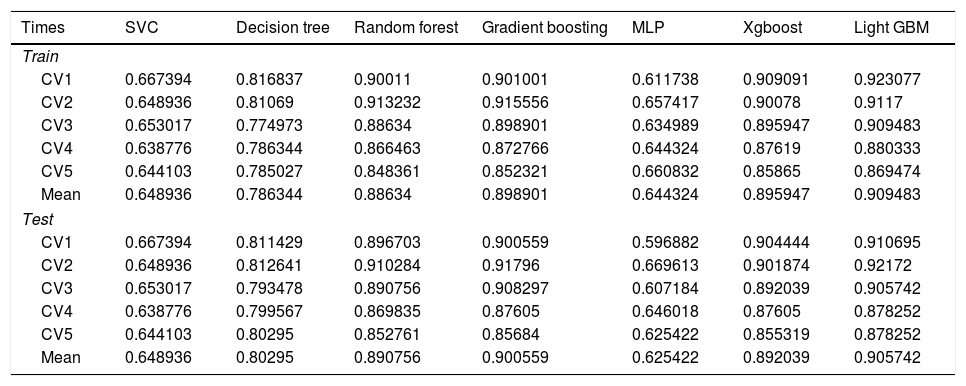
In the test set, the model performance is similar to that in the training set, and the SVM and the Decision Tree algorithm still has the lowest AUC value (0.75); however, light GBM and GBM is the best model(AUC:0.85), XgBoost is the third (AUC:0.84). Table 2 presents the F1 scores of the seven algorithms in the 5-fold cross-validation. Considering that the light GBM in the training set is the most and generalization is also good, the grid method adjusts the parameters to the optimization light GBM model. The detailed parameters are shown in the supplementary (supplementary Jupyter notebook). The model performance of the classical logistic regression model has a training set AUC of 0.76 and a test set AUC of 0.63, respectively (supplementary Jupyter notebook). Fig. 3 shows the performance of the light GBM algorithm after adjusting the parameters, which has an AUC of ROC of 0.99 (95%CI: 0.98–0.99) in the train set, 0.96 (95%CI:0.96–0.96) in test set; and area under PR curve (curve) value of >0.95 in two groups. In the supplementary Fig. 1, the calibration curve plots show a slight overestimation of mortality in the test set, while in the train set, it compares somewhat better. In order to find some relevant factors between sepsis and death, we also performed the feature importance ranking in the light GBM algorithm (Fig. 4). The ranking of important features shows that the top ten items are glucose, urine output, platelets, age, mean blood pressure, WBC, creatinine, temperature, GCS verbal, and calcium. We demonstrated the Kaplan Meier Curve of the top 1 item – glucose (Supplementary Fig. 2).
F1 scores in the train set and test set in the 5-fold cross-validation (CV).
| Times | SVC | Decision tree | Random forest | Gradient boosting | MLP | Xgboost | Light GBM |
|---|---|---|---|---|---|---|---|
| Train | |||||||
| CV1 | 0.667394 | 0.816837 | 0.90011 | 0.901001 | 0.611738 | 0.909091 | 0.923077 |
| CV2 | 0.648936 | 0.81069 | 0.913232 | 0.915556 | 0.657417 | 0.90078 | 0.9117 |
| CV3 | 0.653017 | 0.774973 | 0.88634 | 0.898901 | 0.634989 | 0.895947 | 0.909483 |
| CV4 | 0.638776 | 0.786344 | 0.866463 | 0.872766 | 0.644324 | 0.87619 | 0.880333 |
| CV5 | 0.644103 | 0.785027 | 0.848361 | 0.852321 | 0.660832 | 0.85865 | 0.869474 |
| Mean | 0.648936 | 0.786344 | 0.88634 | 0.898901 | 0.644324 | 0.895947 | 0.909483 |
| Test | |||||||
| CV1 | 0.667394 | 0.811429 | 0.896703 | 0.900559 | 0.596882 | 0.904444 | 0.910695 |
| CV2 | 0.648936 | 0.812641 | 0.910284 | 0.91796 | 0.669613 | 0.901874 | 0.92172 |
| CV3 | 0.653017 | 0.793478 | 0.890756 | 0.908297 | 0.607184 | 0.892039 | 0.905742 |
| CV4 | 0.638776 | 0.799567 | 0.869835 | 0.87605 | 0.646018 | 0.87605 | 0.878252 |
| CV5 | 0.644103 | 0.80295 | 0.852761 | 0.85684 | 0.625422 | 0.855319 | 0.878252 |
| Mean | 0.648936 | 0.80295 | 0.890756 | 0.900559 | 0.625422 | 0.892039 | 0.905742 |
 The ROC curve for the light GBM algorithm model; (B) the Precision–Recall curve for the light GBM algorithm model.")

This study uses seven machine learning algorithms and 12,861 sepsis patients to build models to predict death in hospitals. Compared to classic logistic regression, and other machine learning algorithms, light GBM demonstrated superior performance in the prognosis of sepsis patients during hospitalization. According to the ranking of feature importance, it is observed that the glucose, age, GCS, urine volume, and so on have a significant impact on promoting the death of patients in the hospital. To our knowledge, we are the first to use sepsis 3.0 patients from MIMIC-IV to build a predictive model based light GBM algorithm that enables physicians to identify the high risk of death in ICU. We also demonstrate the excellent generalization performance with multicenter data eICU-CRD.
The key to managing patients with sepsis is to clarify that sepsis is a medical emergency, like multiple traumas, acute myocardial infarction, and stroke, which are treatable.27,28 Early goal-directed intervention can significantly improve the prognosis of patients.29–32 Therefore, it is imperative to define further the factors influencing the prognosis of sepsis, establish an early prediction model for the development of sepsis death and multi-organ dysfunction, and stop the progression of sepsis as early as possible. Machine learning algorithms can be incorporated into the electronic medical records (EMR) to build auxiliary medical predictive models using real-world data that account for local hospital population information of clinical and inspection. These models can be subsequently used to guide clinicians to improve patients’ care so that patients can receive individualized treatment plans. These clinical decision tools can help identify at-risk patients who might benefit from ICU comprehensive treatment or cost-saving for patients’ families with sepsis. Theoretically, they can also be used to alert the family of sepsis patients if further treatment is needed or to make the family more receptive to the use of aggressive treatment options. This became possible due to the widespread use of EMR and its easy and instantaneous accessibility to clinicians and families of sepsis patients.
Compared with existing studies, Kong et al. built predictive in-hospital mortality of sepsis patients model based on the previous version of the MIMIC database, which did not include clinical information after 2012.33 In 2017, there was a prediction model for pediatric sepsis mortality; the model-based multivariable logistic regression performance yielded an AUC of 0.843.21 In contrast, our study used more than 12,000 more than 18-year-old patients. More importantly, our models included clinical data from 2012 to 2019 and utilized an excellent integrated algorithm – light GBM. After adjusting the model parameters, the model performance can achieve an AUC value of more than 90% in the train set. Wang Xun et al. in 2021, studied the MIMIC-III sepsis patients with Mu-Lightgbm and lightgbm model and the AUC were 0.93 and 0.91, respectively.34 Despite the excellent performance of their algorithm, however, they did not meet the sepsis 3.0 criteria in their patient section, and the data were used for patients from a decade ago.
Previous studies indicated that age and AKI are two critical factors associated with an increased risk of death.10,35 Elderly and severe kidney injury patients have a higher prevalence of sepsis and mortality.36 Glasgow Coma Scale (GCS) is widely used for the assessment of a patient's clinical condition, reflecting its utility in observing a patient's responsiveness, or so-called «consciousness level».37 Our model used GCS scores to explore the relationship between patient awareness and death. The results showed that the verbal score of GCS in light GBM algorithm had an essential role in predicting the outcome of patients. Patients with sepsis are prone to kidney injury, and sepsis is the leading cause of AKI.38 Urine volume is precisely the characteristic of AKI, which is also consistent with the clinical surroundings.39 Respiratory rate, body temperature, and lactate are essential parameters of sepsis severity.40,41 Breathing is affected by body temperature. Elevated body temperature is a common symptom in patients with sepsis. However, a cold type of shock can lead to hypothermia and death.
The relationship between blood glucose and prognosis in patients with sepsis has also been reported, and Critical Care reported the glycemic lability index had the good discrimination for mortality (area under the curve=0.67).42 Two multicenter studies also agreed with the glycemic lability index as a relevant variable in the prognosis of septic patients.43,44 Our model suggested that glycemic control and even further combining control of glycemic volatility can improve patient prognosis.
The result of the prediction model using logistic regression suggests that traditional conventional methods still have poorer predictive performance than machine learning algorithms. Compared to conventional Statistics, the utilization of AI provides an alternative approach to focusing on optimizing model performance. Seven machine learning methods show different performance, which may be caused by the various applications scenarios of the algorithms themselves. Support vector machines may have a better prediction performance for small sample data. Traditional decision tree models may have more errors because there are too many categories for model prediction classification. Multi-layer perceptron is easy to cause model overfitting.
In the future, more work will be done to predict the death of patients, not only in the in-hospital aspect of sepsis but also in the period after discharge from the hospital. It is also proposed to carry out a prediction for some other patients with a high risk of death, such as patients with severe neurology, patients with severe pancreatitis, etc. Moreover, we will continue to use the daily time-series data to build real-time predictions of in-hospital mortality and differentiate patients at high risk of death at 24 and 48h based on recurrent neural network algorithms.
There are several limitations to our study. Firstly, this study was a retrospective study with all of the inherent limitations of a retrospective study, such as selection bias. We included sepsis patients according to Sepsis 3.0 and a large population, which may make our model as highly generalizable as possible. Secondly, although the models have been validated externally, those models have not been prospectively validated in clinical practice. Third, our model utilized data from only the first day of the hospitalization period and the clinical information section used in models lacked the antibiotics data on usage dosage. We plan to use all the data during the patient's hospitalization in the future to achieve a real-time update of the results of the model to predict whether the patient survives or not.
ConclusionIn conclusion, we demonstrated the correlation between glucose, age, urine output, et al. and patients’ death and a patient individual mortality prediction model using light Gradient Boosting Machine algorithms to detect patients’ death during ICU in hospital. Our model can predict death with a good performance and generalization and outperformed conventional statistics and other machine learning algorithms in both the training and the test dataset.
Author's contributionChuanyu Bao wrote the paper and design the experimental.
Fuxing Deng analyzed data.
Shuangping Zhao conducted conception and design.
Availability of data and materialsThe datasets analyzed during the current study are available in the MIMIC-IV repository & eICU-CRD, https://physionet.org/content; and https://github.com/BboyT/sepsis_predict.
Consent for publicationNot applicable.
Conflicts of interestsAll authors have completed the ICMJE uniform disclosure form. The authors have no conflicts of interest to declare.
The lecture Zhongheng Zhang in Xiangya hospital inspires authors to study big data research. This work was supported by the Natural Science Foundation of Hunan Province of China [2020JJ4929]. The authors have completed the STROBE reporting checklist.