
There are many different methods for computing the Predisposition Infection Response Organ (PIRO) dysfunction score. We compared three PIRO methods (PIRO1 (Howell), PIRO2 (Rubulotta) and PIRO3 (Rathour)) for the stratification of mortality and high level of care admission in septic patients arriving at the Emergency Department (ED) of an Italian Hospital.
Design, setting and participantsWe prospectively collected clinical data of 470 patients admitted due to infection in the ED to compute PIRO according to three different methods. We tested PIRO variables for the prediction of mortality in the univariate analysis. Calculation and comparison were made of the area under the receiver operating curve (AUC) for the three PIRO methods, SOFA and qSOFA.
ResultsMost of the variables included in PIRO were related to mortality in the univariate analysis. Increased PIRO scores were related to higher mortality. In relation to mortality, PIRO 1 performed better than PIRO2 at 30 d ((AUC 0.77 (0.716–0.824) vs. AUC 0.699 (0.64–0.758) (p=0.03) and similarly at 60 d (AUC 0.767 (0.715–0.819) vs AUC 0.709 (0.656–0.763)(p=0.55)); PIRO1 performed similarly to PIRO3 (AUC 0.765 (0.71–0.82) at 30 d, AUC 0.754 (0.701–0.806) at 60 d, p=ns). Both PIRO1 and PIRO3 were as good as SOFA referred to mortality (AUC 0.758 (0.699, 0.816) at 30 d vs. AUC 0.738 (0.681, 0.795) at 60 d; p=ns). For high level of care admission, PIRO proved inferior to SOFA.
ConclusionsWe support the use of PIRO1, which combines ease of use and the best performance referred to mortality over the short term. PIRO2 proved to be less accurate and more complex to use, suffering from missing microbiological data in the ED setting.
Existen muchos métodos diferentes para calcular la escala PIRO (predisposición, infección respuesta, fallo orgánico). Comparamos 3 métodos (PIRO1 [Howell], PIRO2 [Rubolotta] y PIRO3 [Rathour]) para estratificar la mortalidad y el ingreso con alto nivel de cuidados en pacientes con sepsis atendidos en el servicio de urgencias (SU) de un hospital italiano.
Diseño, entorno y participantesRecopilamos datos clínicos prospectivos de 470 pacientes que llegaban con una infección al SU, con el fin de calcular la puntuación PIRO, de acuerdo con 3 métodos diferentes. Evaluamos las variables PIRO para la predicción de la mortalidad en un análisis monovariable. Calculamos y comparamos el área bajo la curva (AUC) característica de operación del receptor (ROC) de los 3 métodos PIRO, SOFA y qSOFA.
ResultadosLa mayoría de las variables incluidas en las puntuaciones PIRO estaban relacionadas con la mortalidad en un análisis de una sola variable. El aumento de la puntuación PIRO se relacionó con una mortalidad más elevada. En cuanto a la mortalidad, PIRO1 presentó un rendimiento mejor que PIRO2 a los 30 días (AUC 0,77 [0,716-0,824] frente a AUC 0,699 [0,64-0,758]; p=0,03) y similares a los 60 días (AUC 0,767 [0,715-0,819] frente a AUC 0,709 [0,656-0,763]; p=0,55); PIRO1 presentó un rendimiento similar al de PIRO3 (AUC 0,765 [0,71-0,82] a los 30 días, AUC 0,754 [0,701-0,806] a los 60 días; p=NS). Tanto PIRO1 como PIRO3 presentaron un rendimiento similar al de SOFA para la mortalidad (AUC 0,758 [0,699-0,816) al cabo de 30 días y AUC 0,738 [0,681-0,795] al cabo de 60 días; p=NS). En cuanto al ingreso con alto nivel de cuidados, las puntuaciones PIRO resultaron ser inferiores a SOFA.
ConclusionesApoyamos el uso de la puntuación PIRO1, que resulta fácil de usar, y presenta el mejor rendimiento en cuanto a la mortalidad a largo plazo. PIRO2 resultó ser menos precisa y más compleja de usar, y se vio afectada por problemas de falta de datos microbiológicos en el entorno del SU.
Sepsis is a complex process involving humoral and cellular immune reactions leading to systemic inflammatory and anti-inflammatory responses, and coagulation abnormalities.1 It should be recognized the enormous clinical heterogeneity of sepsis, that makes risk stratification for short term prediction difficult in these patients and response to therapeutic interventions not so predictable. Many scoring systems like Sequential Organ Failure Assessment (SOFA) and Quick SOFA (qSOFA) have been proposed, but their effectiveness is controversial. Furthermore, sepsis outcome is known to be related to host predisposition, host response and to the causal microorganism whereas SOFA evaluates exclusively organ dysfunction.2
A severity scoring system, suitable for all hospitalized patients with confirmed infection, is necessary to undertake meaningful comparisons between patient groups (stratifying patients at risk, assessing criteria for specific therapies, predicting outcomes and creating a framework for research purposes). The PIRO (Predisposition Infection Response Organ failure) system suggests that patients could be stratified for severity of disease and risk of mortality on the basis of their predisposing conditions, the nature and extent of the insult (infection), the nature and magnitude of the host response, and the degree of organ dysfunction.3–5 This challenging concept was only recently tested in the clinical field with different approaches4,6–11 and measuring heterogeneous outcomes.4,5,10,11 Moreover PIRO was used in settings that differ in patient's characteristics5,7,10,11 and type of infection8,9 thus limiting the universal validity of the score.
Several studies were conducted with the goal of identifying the meaningful variables for each field of the PIRO. The appropriate variables were found to be associated with a greater risk of incidence of sepsis and/or worse prognosis by multivariate logistic regression models.2,3,7 The derived β coefficient for each independent predictor was used with different methods to create a weighted integer score for each covariate2,3,7 and the resulting score was further tested.13,26,27
Nevertheless, many controversial points still exist on the PIRO practical application, due to the inclusion of diverse variables on one side and to several different methods that have been proposed for the interpretation of the PIRO score on the other one.2–4,7,12,13,26,27
Therefore, a great variability occurs among the different studies not only in the variables included in each PIRO system but also in the cut-offs that dichotomize each variable for the logistic regression and in the final weight assigned to each variable of the score.
The objective of our study is to validate a clinical staging system based on the PIRO concept to stratify patients referred to the ED of an Italian Hospital for mortality in the short and medium-term and for intensive care unit (ICU) admission. Since many different methods of computing PIRO score exist, we compared three PIRO methods proposed in the literature for stratification of the outcomes in our cohort.
Patients and methodsA prospective cohort study was conducted in a 300-bed university hospital over 6 months (August 2018–January 2019). All patients arriving for infections in the ED of XXXX Hospital were evaluated within the first 24h from arrival. Inclusion criteria were: (1) age>18 years, (2) clinical diagnosis of sepsis, (3) infection associated with at least 2 criteria of SIRS at presentation.
All patients that met the inclusion criteria were asked to participate in the study and were enrolled after written informed consent.
For each patient, the clinical chart was examined to collect demographic data, anamnestic, clinical and laboratory data and to calculate SOFA and qSOFA scores. Microbiological data from the results of blood cultures performed at arrival and the final diagnosis were collected. The review of the complete chart was used to exclude a posteriori patients without an evident diagnosis of sepsis (i.e. patients with SIRS due to non infective cause were excluded).
The study was approved by the Institutional Review Board and Ethical Committee and confidentiality ensured accordingly.
Predisposition Infection Response Organ failure (PIRO) scoreAs there is no standardized PIRO score, the data collected included all sepsis-related variables which were grouped according to each PIRO components based on the literature evidence2–18:
- •
for Predisposition (P) component we selected age14 heart failure, chronic obstructive pulmonary disease (COPD),18 chronic liver disease (CLD), diabetes,16 chronic kidney disease (CKD),19 alcoholism, pressure ulcers, immunocompromission (corticosteroid therapy, chemotherapy, radiotherapy, HIV, AIDS),22 neoplasm,25 urinary permanent catheterization and being nursing home (NH) resident15–26
- •
for Infection (I) component we selected site of infection (respiratory, urinary, intra-abdominal, neurological, skin and soft tissues, bone, catheter), specific microorganism identification in blood cultures7 and we evaluated if the infection was hospital-acquired;
- •
for Response (R) component we selected body temperature, heart rate, respiratory rate, white blood cells count, C-reactive protein and procalcitonin7;
- •
for Organ failure (O) component we selected Glasgow Coma Scale, platelets/prothrombin time, creatinine, respiratory failure (PO2/FiO2 ratio), bilirubin, systolic blood pressure and lactates7.
When a PIRO variable was not available (i.e. microbiological data) we assigned a normal value for this PIRO parameter, in line with previous studies.3,4,7 When PIRO was impossible to compute for the absence of a specific data the case was excluded from the analysis.
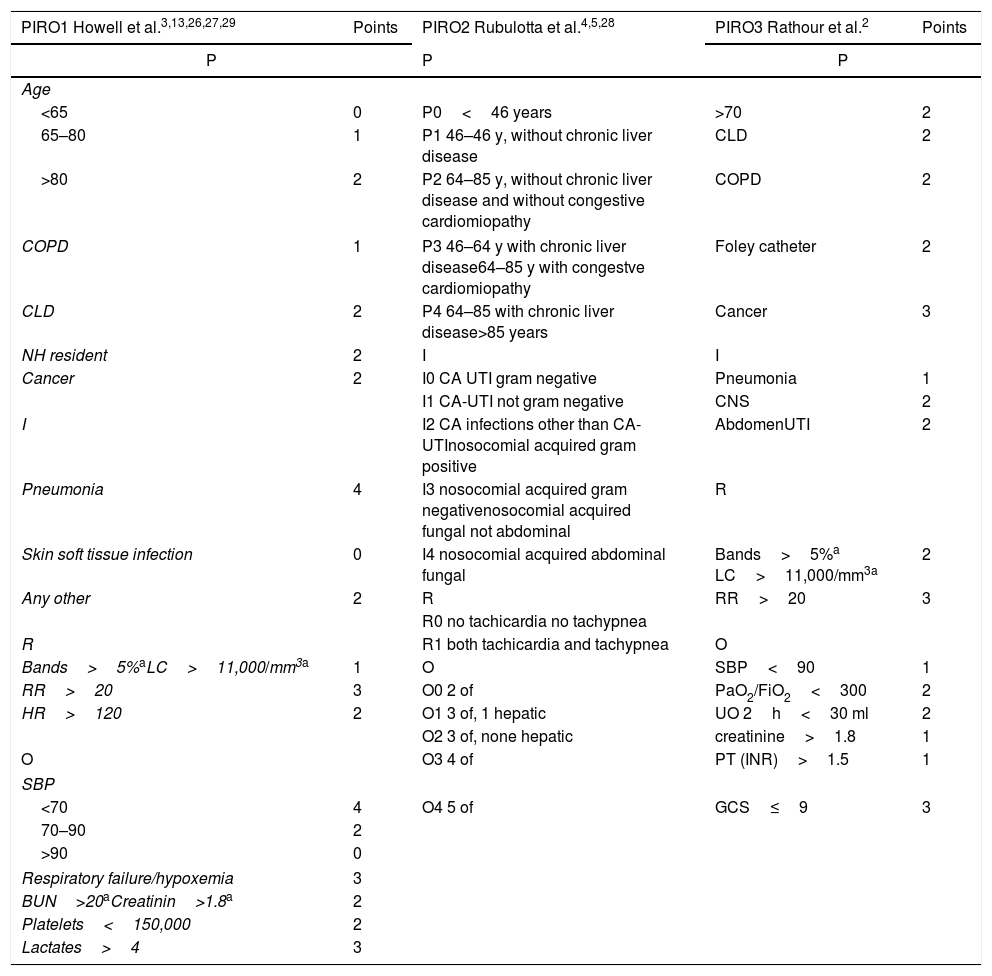
We selected and tested in our cohort the three main methods derived from the literature review: PIRO1 (derived by Howell et al.3,13,26,27,29), PIRO2 (derived by Rubulotta et al.4,5,28 and PIRO3 (derived by Rathour et al.2) that are described in Table 1.
Variables and points assigned to each variable for the three PIRO methods PIRO 1,3,13,26,27,29 PIRO24,5,28 and PIRO3.2 P, PREDISPOSITION; I, INFECTION; R, RESPONSE; O, ORGAN FAILURE; CLD, chronic liver disease; COPD, Chronic Obstructive pulmonary disease; NH, nursing home; CA, community-acquired; UTI, urinary tract infection; RR, respiratory rate; HR, heart rate; CNS, central nervous system; UO, urine output; OF, organ failure; SBP, Systolic blood pressure; BUN, blood urea nitrogen; GCS, Glasgow coma scale; PT, prothrombin time; INR, International normalized ratio; PaO2, arterial oxygen partial pressure; FiO2, fractional inspired oxygen.
| PIRO1 Howell et al.3,13,26,27,29 | Points | PIRO2 Rubulotta et al.4,5,28 | PIRO3 Rathour et al.2 | Points |
|---|---|---|---|---|
| P | P | P | ||
| Age | ||||
| <65 | 0 | P0<46 years | >70 | 2 |
| 65–80 | 1 | P1 46–46 y, without chronic liver disease | CLD | 2 |
| >80 | 2 | P2 64–85 y, without chronic liver disease and without congestive cardiomiopathy | COPD | 2 |
| COPD | 1 | P3 46–64 y with chronic liver disease64–85 y with congestve cardiomiopathy | Foley catheter | 2 |
| CLD | 2 | P4 64–85 with chronic liver disease>85 years | Cancer | 3 |
| NH resident | 2 | I | I | |
| Cancer | 2 | I0 CA UTI gram negative | Pneumonia | 1 |
| I1 CA-UTI not gram negative | CNS | 2 | ||
| I | I2 CA infections other than CA-UTInosocomial acquired gram positive | AbdomenUTI | 2 | |
| Pneumonia | 4 | I3 nosocomial acquired gram negativenosocomial acquired fungal not abdominal | R | |
| Skin soft tissue infection | 0 | I4 nosocomial acquired abdominal fungal | Bands>5%a LC>11,000/mm3a | 2 |
| Any other | 2 | R | RR>20 | 3 |
| R0 no tachicardia no tachypnea | ||||
| R | R1 both tachicardia and tachypnea | O | ||
| Bands>5%aLC>11,000/mm3a | 1 | O | SBP<90 | 1 |
| RR>20 | 3 | O0 2 of | PaO2/FiO2<300 | 2 |
| HR>120 | 2 | O1 3 of, 1 hepatic | UO 2h<30 ml | 2 |
| O2 3 of, none hepatic | creatinine>1.8 | 1 | ||
| O | O3 4 of | PT (INR)>1.5 | 1 | |
| SBP | ||||
| <70 | 4 | O4 5 of | GCS≤9 | 3 |
| 70–90 | 2 | |||
| >90 | 0 | |||
| Respiratory failure/hypoxemia | 3 | |||
| BUN>20aCreatinin>1.8a | 2 | |||
| Platelets<150,000 | 2 | |||
| Lactates>4 | 3 | |||
For practical constraints we used total leucocytes count greater than 11,000 per mm3 (11.0×10⁹ per L) instead of bands percentage and creatinine greater than 1.8mg/dl instead of blood urea nitrogen elevation. These cut-offs were deemed clinically equivalent because used in previous studies.7,2,11,19,29
The study outcomes were short-term mortality (30 days), medium-term mortality (60 days) and admission to a high level of care unit from the ED (namely ICU and High Dependency Unit (HDU)) and secondary high level of care unit admission (namely after admission in regular ward for deterioration of the clinical conditions). Outcomes were collected by electronic records and by phone call.
We compared the accuracy of the three methods described above to predict the outcomes. Furthermore, we compared the PIRO score with SOFA and qSOFA scores, considered as part of the standard assessment to predict adverse outcomes in septic patients and to define high- and low-risk categories.12
A sample size of 140 was considered large enough to test the non inferiority of each PIRO method to SOFA (with a type I error of 0.05 and a power of 0.8) using “easy ROC: a web-tool for ROC curve analysis” version 1.3.1. Continuous variables were described as medians and inter-quartile ranges (IQR). Categorical variables were described with absolute frequencies and percentages. Mann–Whitney tests were used in univariate analysis to compare continuous values between subgroups with different outcomes (survivors and non-survivors). For categorical variables, these comparisons were performed using Chi-Square test or Fisher exact test when appropriate.
Logical categories of classification were built from PIRO results like in previous studies.3,4,13 We calculated frequencies of patients in each logical category, in the whole population and in the two groups defined by the outcome mortality. Finally, we calculated the mortality ratio for each PIRO logical category.
Discriminative performance between survival and mortality and between admission in ICU and admission in a regular ward was assessed using Area Under the Receiver Operator Characteristics Curve (AUC) analysis. We calculated confidence interval at 95% (CI95%) for all AUCs to assess if the null hypothesis (AUC=0.50) was included in the interval. De Long test was performed to compare ROC curves. All tests were two-tailed and a p-value of 0.05 or less was considered statistically significant.
All statistical analyses were carried out using SAS Software Version 9.216 and R Version 3.5.2 (Eggshell Igloo, 2018-12-20).17
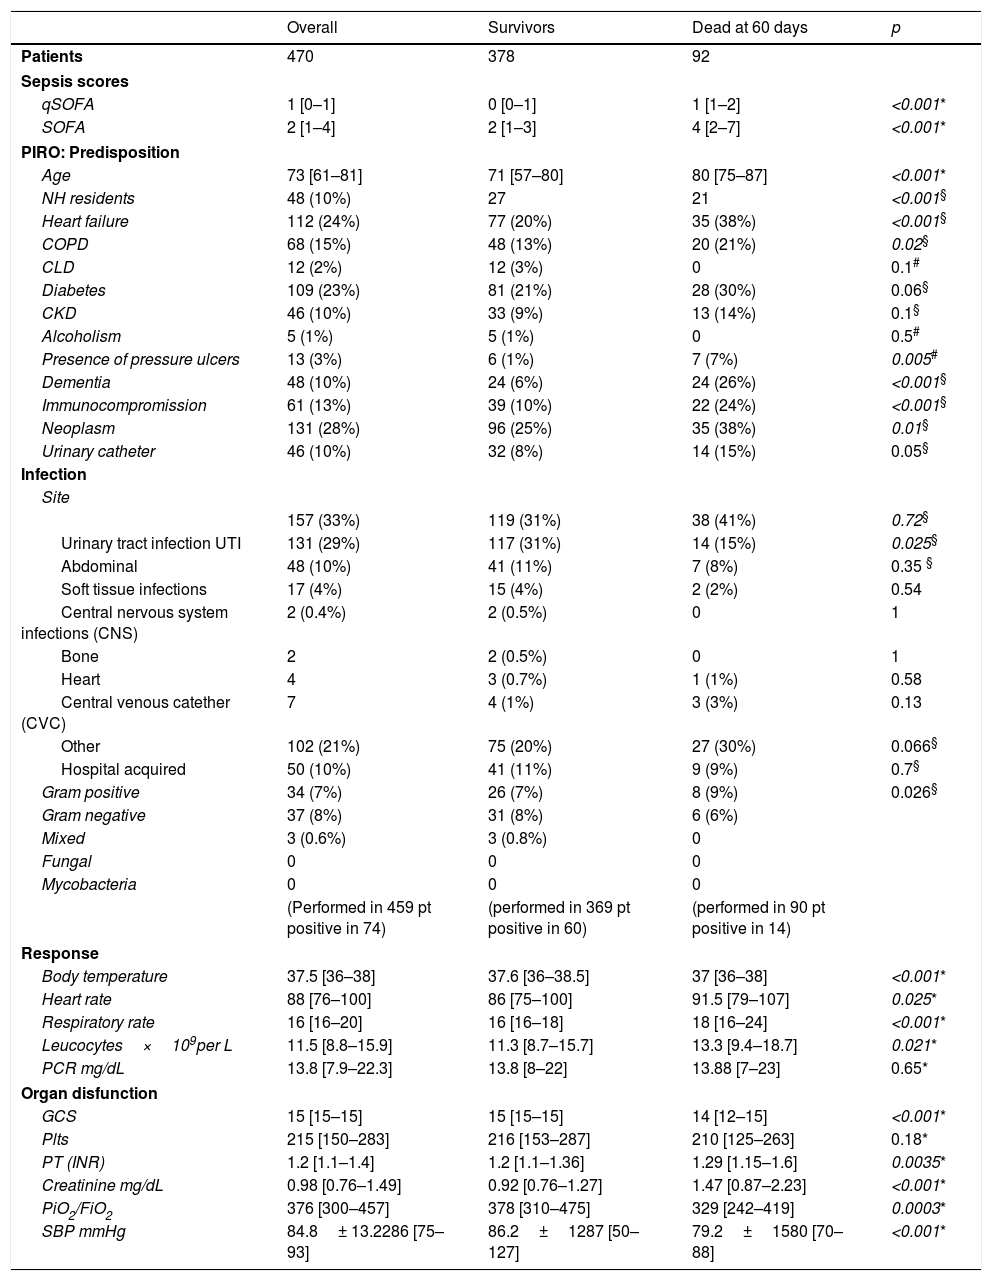
ResultsIn the study period, 511 patients with sepsis were evaluated. 41 patients alternatively were excluded a posteriori, had missing values that prevent score calculation or were lost at follow-up, leaving 470 patients for the final analysis. Male preponderance was noted 267/203. Median age was 73 [61–81]. Patients characteristics are shown in Table 2 together with descriptive statistics for the variables included in PIRO score.
Detailed results of clinical scores, frequencies of patients (and percentages in brackets) with predisposing factors, frequencies of patients with infection in different sites and by different pathogens, means and standard deviation or median and interquartile ranges for age and response variables.
| Overall | Survivors | Dead at 60 days | p | |
|---|---|---|---|---|
| Patients | 470 | 378 | 92 | |
| Sepsis scores | ||||
| qSOFA | 1 [0–1] | 0 [0–1] | 1 [1–2] | <0.001* |
| SOFA | 2 [1–4] | 2 [1–3] | 4 [2–7] | <0.001* |
| PIRO: Predisposition | ||||
| Age | 73 [61–81] | 71 [57–80] | 80 [75–87] | <0.001* |
| NH residents | 48 (10%) | 27 | 21 | <0.001§ |
| Heart failure | 112 (24%) | 77 (20%) | 35 (38%) | <0.001§ |
| COPD | 68 (15%) | 48 (13%) | 20 (21%) | 0.02§ |
| CLD | 12 (2%) | 12 (3%) | 0 | 0.1# |
| Diabetes | 109 (23%) | 81 (21%) | 28 (30%) | 0.06§ |
| CKD | 46 (10%) | 33 (9%) | 13 (14%) | 0.1§ |
| Alcoholism | 5 (1%) | 5 (1%) | 0 | 0.5# |
| Presence of pressure ulcers | 13 (3%) | 6 (1%) | 7 (7%) | 0.005# |
| Dementia | 48 (10%) | 24 (6%) | 24 (26%) | <0.001§ |
| Immunocompromission | 61 (13%) | 39 (10%) | 22 (24%) | <0.001§ |
| Neoplasm | 131 (28%) | 96 (25%) | 35 (38%) | 0.01§ |
| Urinary catheter | 46 (10%) | 32 (8%) | 14 (15%) | 0.05§ |
| Infection | ||||
| Site | ||||
| 157 (33%) | 119 (31%) | 38 (41%) | 0.72§ | |
| Urinary tract infection UTI | 131 (29%) | 117 (31%) | 14 (15%) | 0.025§ |
| Abdominal | 48 (10%) | 41 (11%) | 7 (8%) | 0.35 § |
| Soft tissue infections | 17 (4%) | 15 (4%) | 2 (2%) | 0.54 |
| Central nervous system infections (CNS) | 2 (0.4%) | 2 (0.5%) | 0 | 1 |
| Bone | 2 | 2 (0.5%) | 0 | 1 |
| Heart | 4 | 3 (0.7%) | 1 (1%) | 0.58 |
| Central venous catether (CVC) | 7 | 4 (1%) | 3 (3%) | 0.13 |
| Other | 102 (21%) | 75 (20%) | 27 (30%) | 0.066§ |
| Hospital acquired | 50 (10%) | 41 (11%) | 9 (9%) | 0.7§ |
| Gram positive | 34 (7%) | 26 (7%) | 8 (9%) | 0.026§ |
| Gram negative | 37 (8%) | 31 (8%) | 6 (6%) | |
| Mixed | 3 (0.6%) | 3 (0.8%) | 0 | |
| Fungal | 0 | 0 | 0 | |
| Mycobacteria | 0 | 0 | 0 | |
| (Performed in 459 pt positive in 74) | (performed in 369 pt positive in 60) | (performed in 90 pt positive in 14) | ||
| Response | ||||
| Body temperature | 37.5 [36–38] | 37.6 [36–38.5] | 37 [36–38] | <0.001* |
| Heart rate | 88 [76–100] | 86 [75–100] | 91.5 [79–107] | 0.025* |
| Respiratory rate | 16 [16–20] | 16 [16–18] | 18 [16–24] | <0.001* |
| Leucocytes×109per L | 11.5 [8.8–15.9] | 11.3 [8.7–15.7] | 13.3 [9.4–18.7] | 0.021* |
| PCR mg/dL | 13.8 [7.9–22.3] | 13.8 [8–22] | 13.88 [7–23] | 0.65* |
| Organ disfunction | ||||
| GCS | 15 [15–15] | 15 [15–15] | 14 [12–15] | <0.001* |
| Plts | 215 [150–283] | 216 [153–287] | 210 [125–263] | 0.18* |
| PT (INR) | 1.2 [1.1–1.4] | 1.2 [1.1–1.36] | 1.29 [1.15–1.6] | 0.0035* |
| Creatinine mg/dL | 0.98 [0.76–1.49] | 0.92 [0.76–1.27] | 1.47 [0.87–2.23] | <0.001* |
| PiO2/FiO2 | 376 [300–457] | 378 [310–475] | 329 [242–419] | 0.0003* |
| SBP mmHg | 84.8± 13.2286 [75–93] | 86.2±1287 [50–127] | 79.2±1580 [70–88] | <0.001* |
CLD, chronic liver disease; COPD, chronic obstructive pulmonary disease; CKD, chronic kidney disease; NH, nursing home; UTI, urinary tract infection; SBP, Systolic blood pressure; BUN, blood urea nitrogen; GCS, Glasgow coma scale; PCR, reactive Protein C; PT, prothrombin time; INR, International normalized ratio; PaO2, arterial oxygen partial pressure; FiO2, fractional inspired oxygen.
Comparison between survivors and non-survivors at 60 days are made by Mann–Whitney test.
We compared demographic and PIRO variables in the subgroup of patients that are alive at 60 days with the subgroup that died within 60 days.
Patients in the poor outcome group were significantly older and had a higher score at SOFA and qSOFA by comparison with the survivors’ group.
Among the P components, all comorbid conditions except CLD and alcoholism were more represented in the non-survivors’ group. The prevalence of heart failure, dementia, immunocompromission, neoplasm and pressure ulcers was significantly higher in the poor outcome subgroup.
When examining I components urinary tract infections (UTI) were more represented in the survivor's group, the other variables did not show significant differences.
97% of patients (459) underwent a blood culture test at arrival and a specific microorganism was identified in 16% of cases (74). When examining the survivors, 369 (98%) underwent a blood culture test and among these a specific pathogen (blood culture positivity) was identified in 60 cases. In the non-survivor's group 90 patients (98%) underwent blood culture test and 15 patients had a positive result. The causal microorganism (when detected by culture strains) is shown in Table 2.
Among R components the strongest difference was seen for body temperature and respiratory rate values, followed by heart rate and leucocyte count: non survivors had higher respiratory and heart rate, had higher leucocytes and lower body temperature.
All O components except platelets count were significantly associated with mortality: as a matter of fact, survivors had higher GCS, better renal and respiratory function, higher blood pressure and less coagulative disorders (details in Table 2).
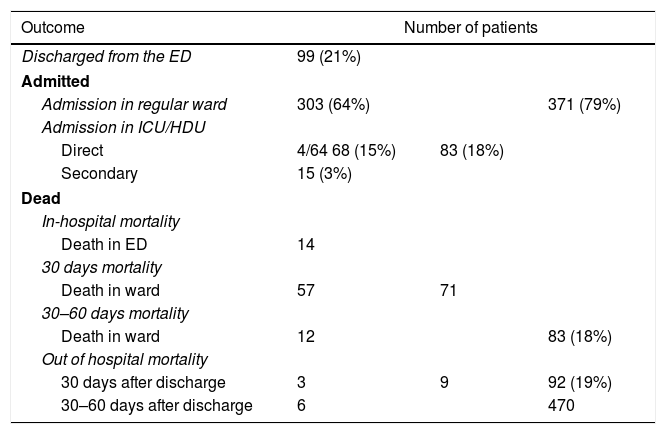
The overall mortality at 60 days was 19% (92 patients), 74 of them died in the first 30 days from recruitment. The in-hospital mortality at 60 days was 18% (83 patients). 14 patients died in the ED, 69 during the hospital stay (details in Table 3).
Description of number of patients (percentage in brackets) for each outcome in study. Discharged patients, admitted patients in general ward and in high-intensity-of-care wards (namely High Dependency Unit HDU and Intensive Care Unit ICU) and mortality in the hospital (H) and out of hospital are detailed separately for short and medium-term follow up (30 and 60 days).
| Outcome | Number of patients | ||
|---|---|---|---|
| Discharged from the ED | 99 (21%) | ||
| Admitted | |||
| Admission in regular ward | 303 (64%) | 371 (79%) | |
| Admission in ICU/HDU | |||
| Direct | 4/64 68 (15%) | 83 (18%) | |
| Secondary | 15 (3%) | ||
| Dead | |||
| In-hospital mortality | |||
| Death in ED | 14 | ||
| 30 days mortality | |||
| Death in ward | 57 | 71 | |
| 30–60 days mortality | |||
| Death in ward | 12 | 83 (18%) | |
| Out of hospital mortality | |||
| 30 days after discharge | 3 | 9 | 92 (19%) |
| 30–60 days after discharge | 6 | 470 | |
All but 99 patients were admitted. 83 out of the 371 inpatients (18%) were admitted to the ICU/HDU, of whom 68 were admitted directly from the ED, whereas the remaining 15 were admitted to the ICU/HDU indirectly from a regular ward (Table 3).
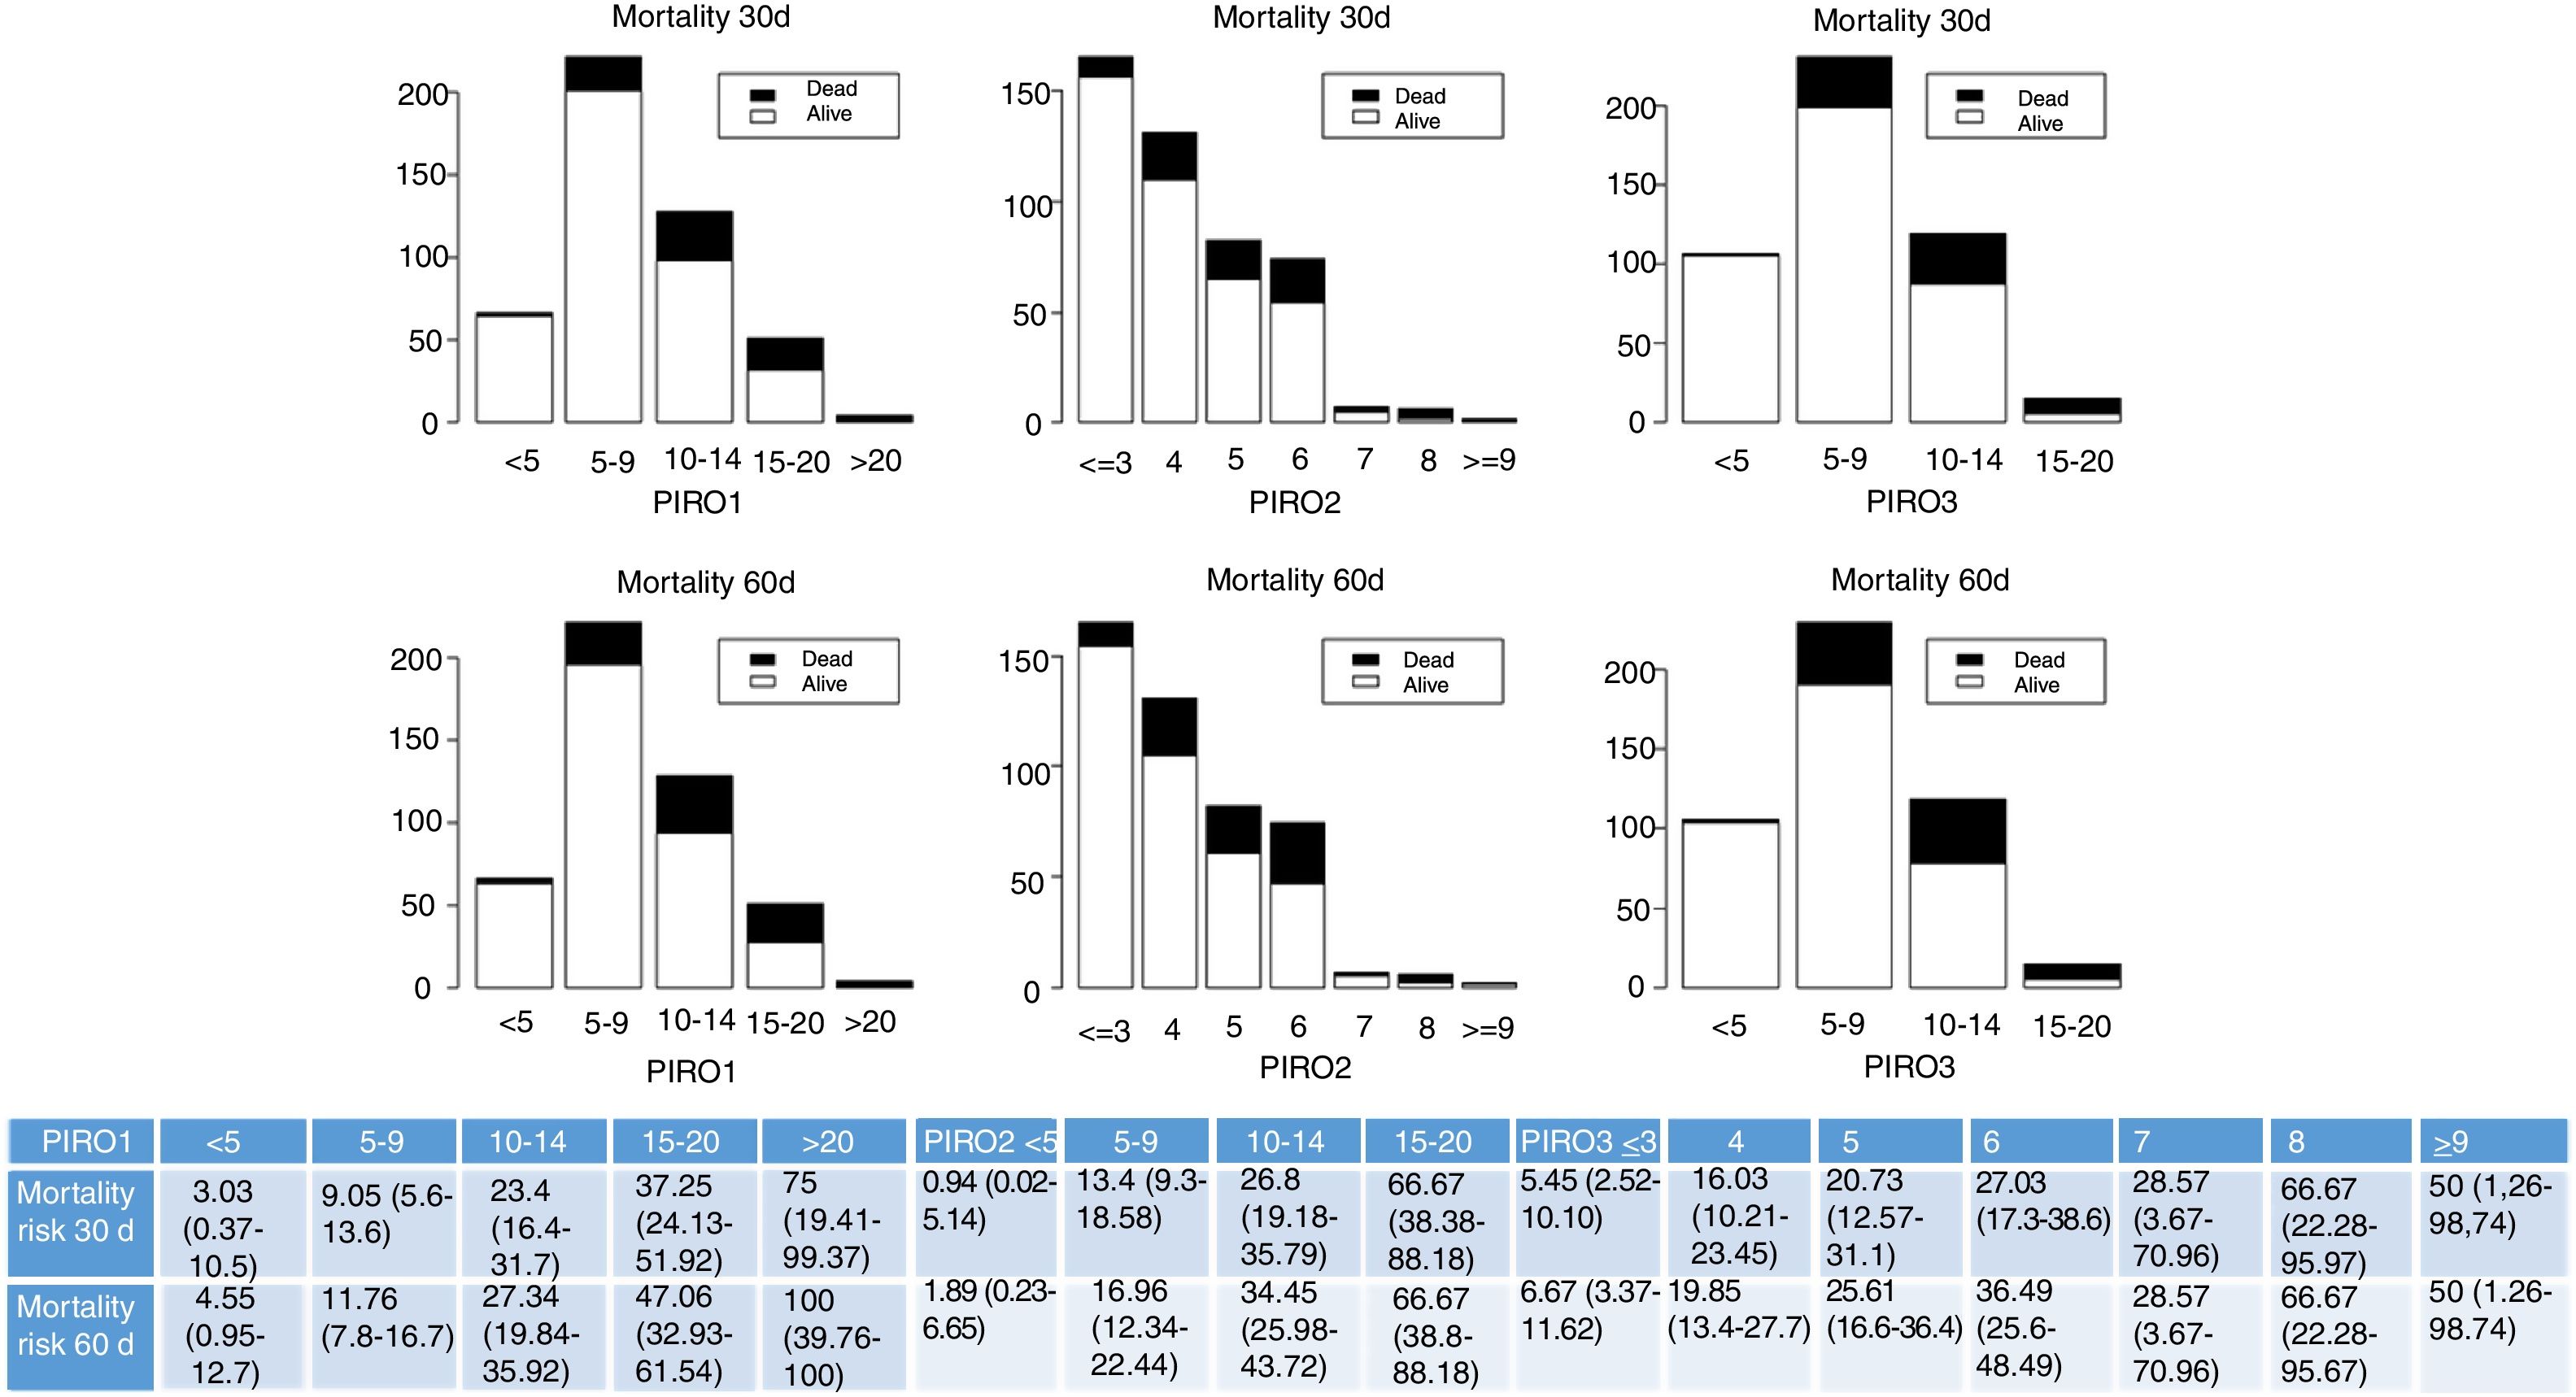
Fig. 1 shows the distribution of patients according to the different PIRO scores PIRO1,3 PIRO2,4 PIRO3.2 We grouped the patients into logical categories for each score and we displayed absolute frequencies for each category. Mortality risk, namely the proportion of patients that died increased with the increase of PIRO score.
, for each category and each score, is also presented in the table at the bottom.")
Frequencies of patients in each group according to logical categories derived by PIRO score are represented. Survivors are white columns and non-survivors are in black for each category. Mortality is described in the short- and medium-term separately. Results are presented for each different PIRO: PIRO1,2 PIRO2,4 PIRO3.2 Mortality risk, namely the proportion of patients that died and that survived (confidence interval 95% in brackets), for each category and each score, is also presented in the table at the bottom.
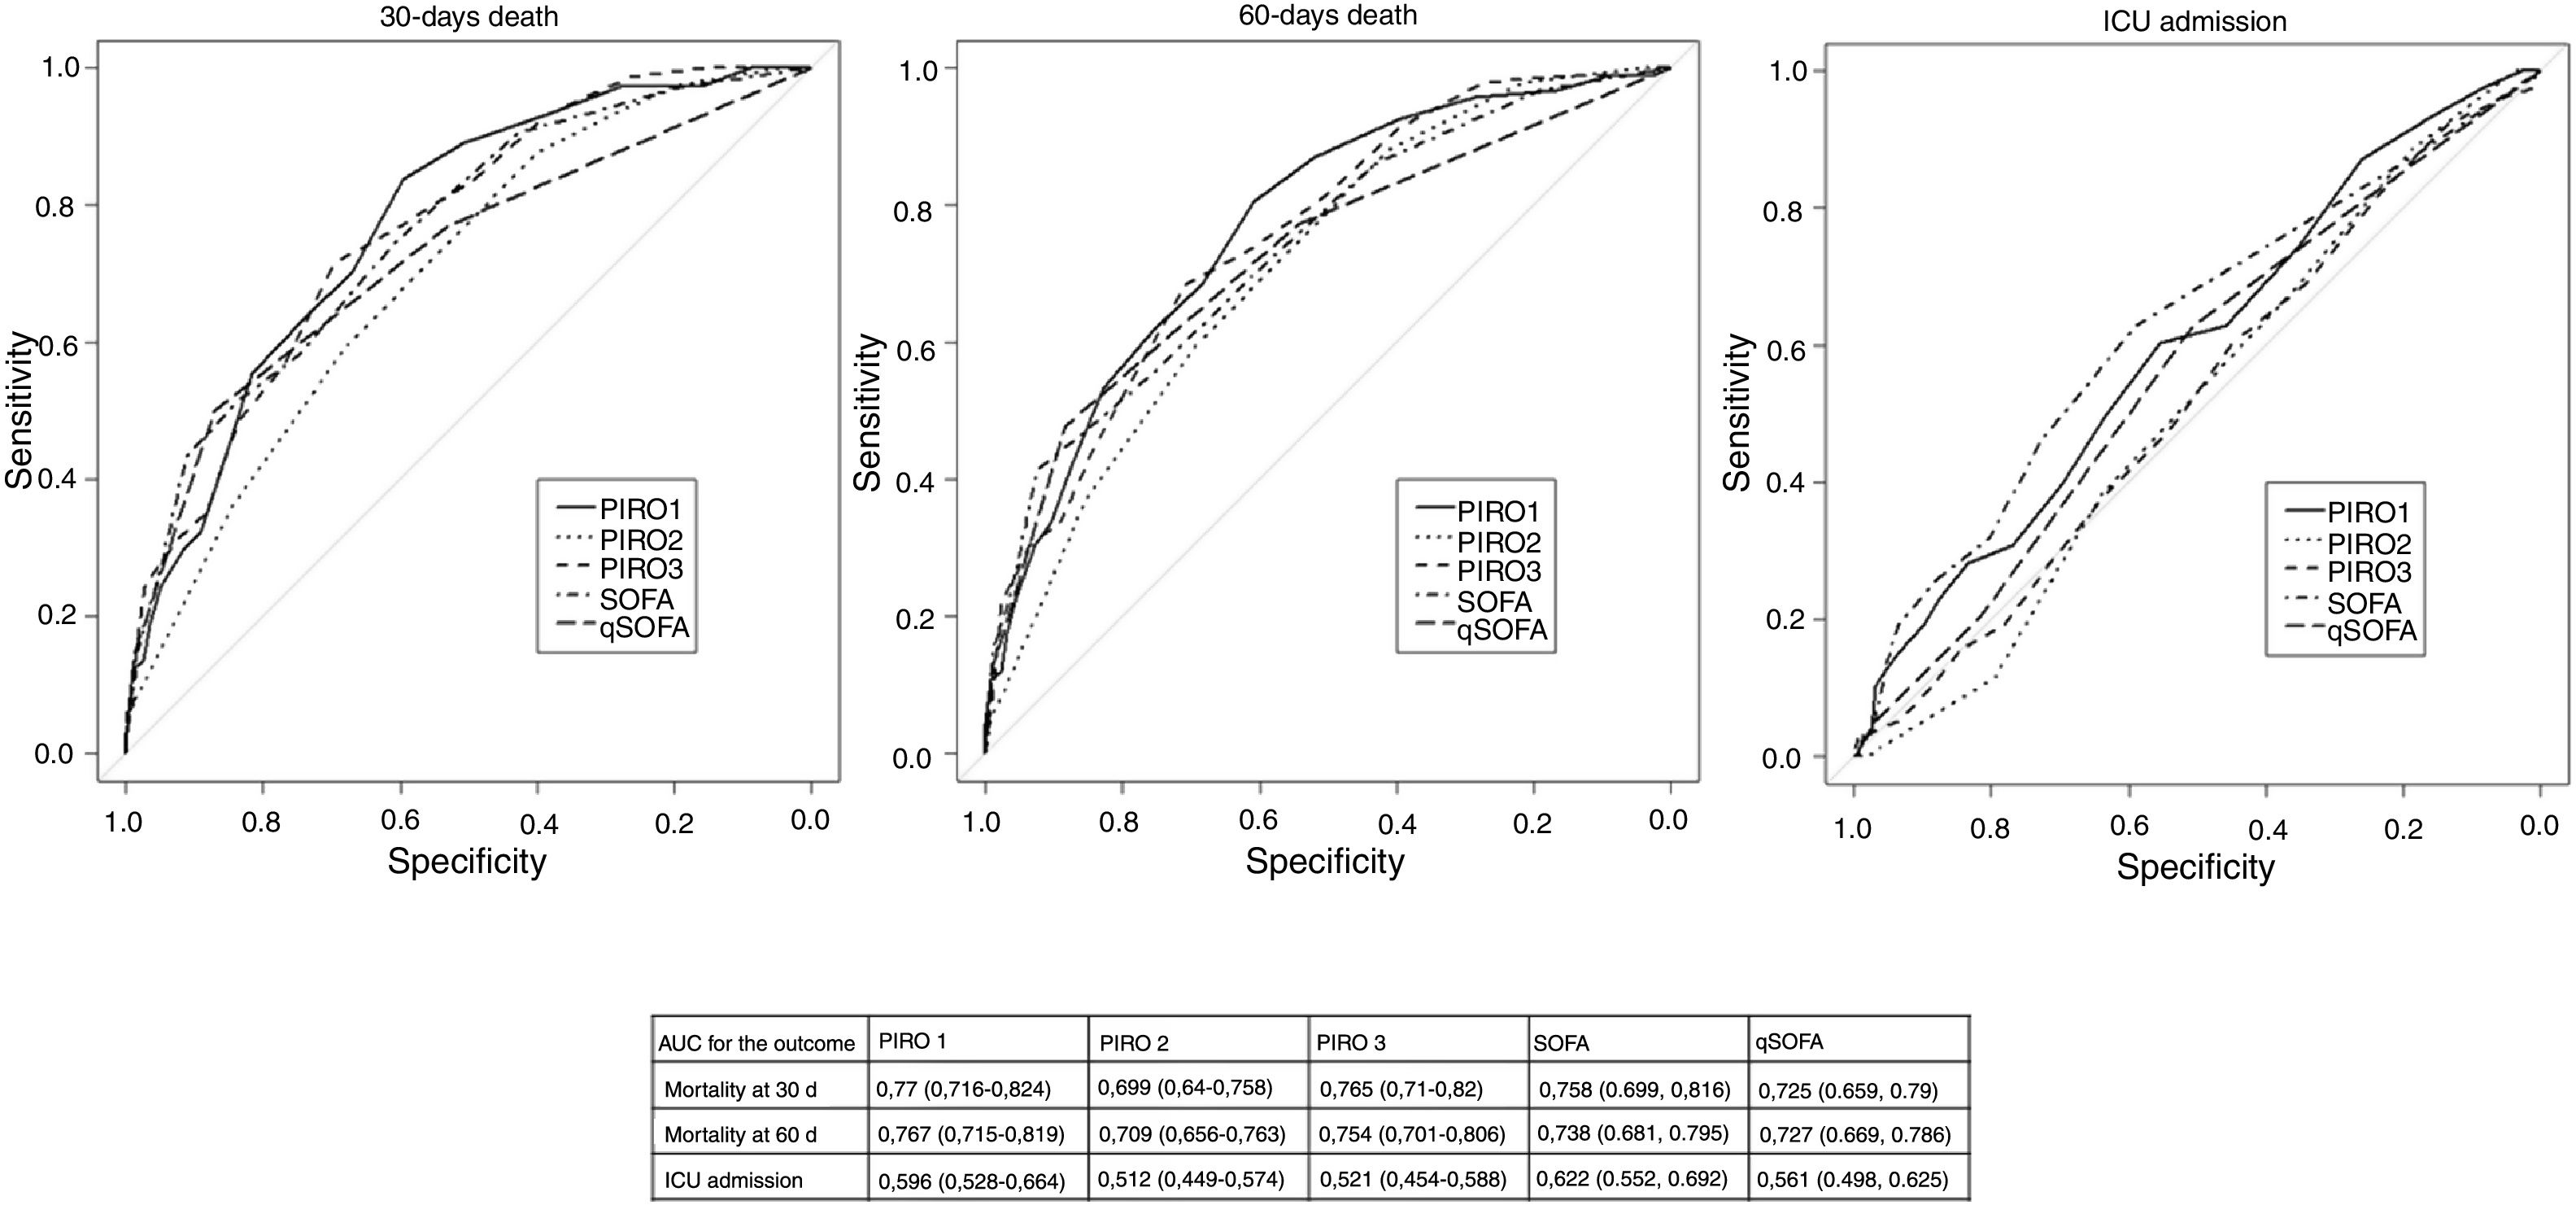
We assessed the accuracy of PIRO scores in predicting overall mortality and ICU/HDU admission. All three scores predicted short-term and medium-term mortality: Fig. 2 shows ROC curves and AUC values for each score with 95% confidence intervals). PIRO 1 showed the best AUC, followed by PIRO 3 and PIRO 2 for short term (30 days) mortality. De Long comparison between the AUC showed a significant difference between PIRO1 and PIRO2 (p=0.036) for short-term mortality. There was no significant difference in performance between PIRO3 and PIRO2 (p=0.052) nor between PIRO1 and PIRO3 (p=0.8). Similar results were found for medium-term mortality (60 days), but the difference was not significant (PIRO1 vs PIRO3 p=0.07; PIRO 2 vs PIRO 3 p=0.16; PIRO1 vs PIRO2 p=0.55). For ICU/HDU admission, PIRO accuracy was low or not significant (details in Fig. 2).

ROC curves for PIROs and SOFA and qSOFA. Area Under the Receiver Operating Curve AUC with 95% confidence interval in brackets, is described for PIRO1, PIRO2, PIRO3, SOFA and qSOFA. The results are given separately for the outcome mortality at 30 days, mortality at 60 days and ICU/HDU admission.
Finally, we compared PIRO performance with SOFA and qSOFA performances: all these results lack of statistical significance. SOFA performed better than PIRO1 for the outcome ICU/HDU admission, but the trend was not significant (p=0.35) details in Fig. 2.
DiscussionThe PIRO Score is a theoretical concept that categorized clinical data, aiming for a simple and efficient risk classification system. Instead of bringing about simplicity, so far, the PIRO concept has made the scoring system more complicated. The creation of subgroups of the PIRO score (such as VAP PIRO and CAP PIRO),8,9 the different variables considered, the different outcomes measured (mortality, in-hospital mortality, ICU admission, disposition from the ED)4,5,10,11,26–28 and the heterogeneous patient groups evaluated (younger/older, different degrees of sepsis and septic shock, ICU or ED patients5,7,10,11,29) make the entire process even harder. Though several studies have been performed in order to validate the PIRO score, the majority ended up creating their own PIRO, that is efficient locally but scarcely reproducible in other settings.2–4,6,7,10,11
PIROs rely on variables that were found to be predictive of adverse outcomes: in our study we found that the majority of these significantly diverge in survivors by comparison with the non-survivors’ group at the univariate analysis, confirming that these parameters are useful to identify patients at risk of poor outcome. Interestingly liver disease was poorly represented in our cohort and was not a significant predictor of death in accordance with De Groot et al.13 This was in disagreement with other previous studies2–4,7 where, on the contrary, liver disease was a strong determinant of mortality in septic patients. This could merely be caused by a recall bias or our population could have been selected by the absence of a specific Liver Unit in our hospital. On the contrary, patients that are treated by our hospital Haematology, Oncology and Pneumology Units usually refers to our ED in case of acute infective episodes, and this can explain the higher prevalence of immunocompromission, neoplasm and COPD in our cohort. The microbiological results did not show significant difference in survivors and non survivors, but these results could have been biased by the lower number of cases with blood culture positivity.
PIRO was previously found to be effective in the prognostic evaluation and superior to other scores especially in low-risk cohorts,13 in studies that tested patients admitted in a regular ward11 and in ED populations.5,13,25–28,29 Other studies support the use of PIRO in directing treatment in the early phases in the ED (the sepsis bundle) with effectiveness similar to other existing clinical scores27,28 and its performance was good both in patients with septic shock and with uncomplicated sepsis. Our cohort intended to include unselected ED patients in the first 24h from arrival with all grades of sepsis severity: high-risk patients that needed ICU/HDU admission were 18%, low-risk patients were both discharged to day-hospital or outpatient care (21%) and admitted in the regular ward (64%). This intention brought about a broader clinical application of the original concept proposed, aiming for a tool for early bedside risk stratification in the ED, where many septic patients spend the first day.
Because many different versions and interpretations of the score exist, we aimed to test in our setting three PIROs versions that are the most extensively studied, to find out which one is the best to use in our hospital. The PIRO1 showed the best performance in our cohort for all the outcomes in study and was a good predictor of mortality in the short- and medium-term. The AUC was similar to other studies that tested PIRO1 in an external validation cohort.3,11,28,29 We found only a small variance in performance between PIRO1 and PIRO3, that differ in a few variables and in the weight set. PIRO2 instead was proved to be less accurate.
We compared PIRO with SOFA and qSOFA, that represent the “standard of care” for prognostic stratification of septic patients. PIRO1 and PIRO3 score proved to be as effective as SOFA and qSOFA, showing a trend toward higher performance. This allows us to justify PIRO use despite the complexity of the application.
PIRO2 is very comprehensive and includes many variables that evaluate different dimensions, but it was found to be less effective than PIRO1 and PIRO3 and less effective than SOFA itself.
Besides, PIRO2 was the most complex tool (requiring an algorithm to be computed) and the one suffering the most of missing data. As a matter of fact, the “site of infection” variable is more intuitive and usually is clear whereas microbiological data are not frequently available in the early phases and in an emergency setting. Furthermore, the lower rate of positivity in blood cultures observed in our sample makes the PIRO2 less accurate.
We personally found Rubulotta's PIRO2 very difficult to apply, on the contrary, it was intuitive to calculate PIRO1 and PIRO3 that simply assigned different weights to the variables collected.
Nevertheless, the patient's categorization was effective with all the three PIRO methods: as a matter of fact, in the higher PIRO categories, the proportion of patients with poor outcome increased. On the other side, the score confirmed to be safe, with a very low mortality rate in the low-risk category. Interestingly, in our cohort there were few patients in the extreme's category of PIRO whereas the majority of the patients were classified in the intermediate category. This is in line with other authors4,13,27,29 and probably depends on ED population recruiting, with different degrees of sepsis severity. Thus, we can agree with Cardoso, de Groot et al.11,13 that PIRO performs well in low-risk population (like our population) and this is a good indication of the generalization of the model.
In summary we support the use of PIRO1, that showed the best results in comparison with the other methods.
We compared PIRO with SOFA and qSOFA to evaluate if the complexity of PIRO was worth its use: PIRO1 and PIRO3 combine ease of use and the best performance in comparison with SOFA for the outcome mortality. Many studies previously demonstrated that clinical judgment from the accepting physician and the triage nurse are more accurate than the stratification based on sepsis categories defined by the Surviving Sepsis Campaign11–13: the added value of PIRO in our opinion is to be a method that categorizes much clinical information to standardize the decisional process and the clinical thinking.
The PIRO1 system was developed for use at the bedside at presentation with variables easily obtained in the ED.3 PIRO1 was used to guide inpatient disposition,26-28 treatment decision,26-28 prognostic stratification in ICU13 and tested to reduce secondary ICU admissions.13 In our study it confirmed to be effective to predict mortality but was not effective to predict ICU/HDU admission. This difference can be explained by the small number of cases admitted in ICU/HDU because of the seniority of our population.
The main strength of our study was being prospective and following a rigorous methodology, including unselected patients with infection and considering many clinically relevant variables previously described by other authors.2,14–25
The comprehensive quality of PIRO is also its main limitation: the number of variables that requires can lead to extensively missing data and the complexity of its application doesn’t suit for emergencies. The prospective nature of the study was useful to reduce missing data.
Nevertheless, we suffered from the low number of blood cultures performed and from the low rate of detection of the causal microorganism. This limit, that is common to similar research performed in the ED, negatively affects the evaluation of PIRO2 performance.
Authors’ contributionVC, VB, AVDS and AB conceived the study, designed the study, and obtained Ethical Committee approval. VC, VB, AVDS and AB supervised the conduct of the study and data collection. VC, VB, AVDS undertook recruitment of participating patients and managed the data, including quality control. AM, VC, VB and FR provided statistical advice on study design and analyzed the data. VC and VB drafted the manuscript, and all authors contributed substantially to its revision. VC takes responsibility for the paper as a whole.
Conflict of interestThe authors declare no financial or ethical conflict of interest.