
To test the presence of the obesity paradox in two cohorts of patients hospitalized for COVID-19.
DesignTwo multicenter prospective cohorts.
SettingThree fourth level institutions.
PatientsAdults hospitalized in the general ward for confirmed COVID-19 in the three institutions and those admitted to one of the 9 critical care units of one of the institutions.
InterventionsNone.
Main variables of interestCategorized weight and its relationship with admission to the ICU in hospitalized patients and death in the ICU.
ResultOf 402 hospitalized patients, 30.1% were obese. Of these, 36.1% were admitted to the ICU vs. 27.1% of non-obese patients. Of the 302 ICU patients, 46.4% were obese. Of these, mortality was 45.0% vs. 52.5% for non-obese. The requirement to transfer hospitalized patients to the ICU admission get a HR of 1.47 (95%CI 0.87–2.51, p = 0.154) in the multivariate analysis. In intensive care patients, an HR of 0.99 (95%CI: 0.92–1.07, p = 0.806) was obtained to the association of obesity with mortality.
ConclusionsThe present study does not demonstrate an association between obesity and risk of inpatient transfer to intensive care or death of intensive care patients due to COVID-19 therefore, the presence of an obesity paradox is not confirmed.
Comprobar la presencia la paradoja de la obesidad en dos cohortes de pacientes hospitalizados por COVID-19.
DiseñoDos cohortes prospectivas multicéntricas.
ÁmbitoTres instituciones de cuarto nivel.
PacientesAdultos hospitalizados en pabellón general por COVID-19 confirmado en las tres instituciones y aquellos internados en alguna de las 9 unidades de cuidado crítico de una de las instituciones.
IntervencionesNinguna.
Variables de interés principalesEl peso categorizado y su relación con el ingreso a UCI en hospitalizados y de muerte en UCI.
ResultadoEntre 402 hospitalizados 30.1% fueron obesos, de los que 36.1% ingresaron a UCI vs. 27.1% en los no obesos. De los 302 pacientes en UCI, el 46.4% fueron obesos, entre ellos la mortalidad fue de 45.0% vs. 52.5% en los no obesos. En hospitalizados el análisis multivariado obtuvo HR de 1.47 (IC95% 0.87–2.51, p = 0.154) para traslado a UCI. En UCI se obtuvo un OR de 0.99 (IC95%: 0.92–1.07, p = 0.806) para la muerte.
ConclusionesEl presente estudio no demuestran una asociación entre la obesidad y el riesgo de traslados a cuidados intensivos en pacientes hospitalizados ni con la muerte en pacientes en cuidados intensivos por COVID-19 por lo que no se confirma la presencia de una paradoja de la obesidad.
The existence of a phenomenon known as the obesity paradox has been recognized for several years. According to this paradox, the presence of overweight and obesity favors the development of certain clinical conditions, but at the same time decreases the risk of adverse outcomes due to that condition. This paradox has been described for diabetes,1 heart failure,2 coronary artery disease,3 peripheral arterial disease,4 group I pulmonary hypertension,5 and chronic occlusive pulmonary disease.6
The first mention of this paradox was in 1989 in patients with pneumonia when LaCroix et al. found a negative correlation between body mass index (BMI) and pneumonia mortality.7 Perhaps the best evidence for the existence of an obesity paradox in pneumonia comes from a large meta-analysis including thirteen studies that evaluated 2,912,105 patients, overweight and obesity were associated with an increased risk of deterioration (RR = 1.33), and decreased mortality (RR = 0.83).8 Moreover, a meta-analysis involving five trials with 6268 patients hospitalized in intensive care for ARDS documented that obesity was more likely to result in lower mortality (OR = 0.68).9 Meanwhile, another meta-analysis of six studies with 7115 patients hospitalized in intensive care for sepsis and septic shock documented that obesity reduced the adjusted risk of mortality (OR = 0.82).10
With respect to the current coronavirus disease (COVID)-19 pandemic, the way in which obesity becomes a risk factor for severe complications of COVID-19 has been documented.11,12 The most plausible explanation is assumed to be that the direct SARS-CoV-2 virus-influenced damage to tissues depends on the widespread expression of the Angiotensin Converting Enzyme 2 (ACE2) receptor in adipose tissue.13,14 Added to this are mechanisms such as the fact that it is a recognized risk factor for cardiovascular disease that in itself is a predictor of poor results in COVID-19, and that it can affect the immune response to viral infections, the abnormal secretion of adipokines and cytokines that determine low-grade systemic inflammation, etc.15 Obesity also changes respiratory physiology by aggravating hypoxia and hypercapnia in COVID-19 pneumonia, fosters venous thrombosis and pulmonary embolism, and is associated with decreased vaccine effectiveness.16 It could also be the result of obesity-related comorbidities such as hypertension and diabetes, that are associated with worse outcomes compared to simple obesity without comorbidities.17
In view of the above, the present study explores obesity as a factor associated with the development of complications in and death of patients hospitalized in general and intensive care wards due to COVID-19.
MethodologyAn observational study was done using data from two prospective cohorts, one of patients hospitalized in the general ward and the other of patients admitted to the Intensive Care Unit (ICU). The first database included individuals over 18 years of age hospitalized for COVID-19 confirmed by Real-Time Polymerase Chain Reaction (RT-PCR) testing between April 15 and November 30, 2020 at three fourth-level care hospitals in Bogota, Colombia. Patients admitted directly to intensive care, those referred after 72 h in another institution, pregnant women, and those with a condition that seriously affected their survival were excluded. The second database consisted of patients hospitalized in the ICU of another fourth-level care hospital in Bogota for COVID-19 confirmed by RT-PCR for SARS-CoV-2 during the months of May to October 2020. Patients who decided to discontinue treatment due to pre-existing conditions and pregnant women were excluded.
The clinical data from each of the institutions were completed in the respective virtual formats that were constructed based on the variables recommended by the International Severe Acute Respiratory and Emerging Infections Consortium (ISARIC) of the World Health Organization (which can be accessed through the link): https://media.tghn.org/medialibrary/2020/05/ISARIC_WHO_COVID-19_CORE_CRF_V1.3_24Feb2020_ES.pdf).
The outcomes evaluated were transfer of patients hospitalized in the general ward to intensive care and in-hospital death of intensive care patients. Obesity was defined as a BMI >30 kg/m2 according to World Health Organization criteria under which weight is categorized as follows: a low weight BMI <18.5 kg/m2, b) normal weight: BMI 18.5–24.9 kg/m2, c) overweight: BMI 25.0–29.9 kg/m2, d) grade I obesity: BMI 30.0–34.9 kg/m2, e) grade II obesity BMI 35.0–39.9 kg/m2, and f) grade III obesity: BMI >40.0 kg/m2.
Statistical analysisFor a general description, absolute frequencies and percentages were reported for qualitative variables and measures of central tendency and dispersion based on the distribution of the variables were reported for quantitative variables. Chi-square test for categorical variables and Student’s t-test for continuous variables were used to demonstrate possible differences between obese and non-obese populations.
Two bivariate analysis was conducted, one for the association of obesity with the need to transfer hospitalized patients to the ICU in the first cohort and the other for the association with the death of intensive care patients in the second cohort; to this end, a Cox proportional-hazards regression model was used. In both cases, if a p-value of less than 0.10 was obtained, a multivariate logistic regression was carried out. A Kaplan Meier curve for transfer to ICU and for survival based on the presence of obesity was built by calculating the p value using the Log Rank test. Hazard Ratios (HR) with their respective 95% confidence intervals were reported. Analyses were done in the R statistical software version 4.0.2 (R Foundation, Vienna, Austria) using the “pROC”, “ROCit”, “survival” and “survminer” packages.
The work was approved by the ethics and research committees of each of the institutions (by act number 138 of the Southern Integrated Health Services Subnetwork of El Tunal Hospital, 0498-2020 of San Jose Hospital and SDM-026-20 of University Children’s Hospital of San Jose) and informed consent was not required. Funding was obtained from the University Foundation of Health Sciences through Fostering Research call for research projects number DI-I-0631-20 for the cohort of patients hospitalized in general wards while the cohort of intensive care patients did not receive funding.
ResultsDuring the collection period, information was obtained on a total of 793 patients: 162 from El Tunal Hospital, 262 from San José Hospital, and 369 from the University Children’s Hospital of San Jose. Of these, 89 patients were excluded due to lack of objective weight data. This left 704 patients for the analysis and of these, 402 constituted the cohort of patients in general hospitalization, and 302 in the ICU cohort. Among the total number of patients, 274 (38.9%) patients were female, the average age was 59.1 years (SD 15.5) and the duration of symptoms prior to admission was 8.2 days (SD 6.1) The most frequent comorbidities were: hypertension in 273 (38.8%), diabetes in 147 (20.9%) and chronic pulmonary disease in 129 (18.3%). Obesity was present in 273 (38.8%) patients. Clinical worsening requiring transfer to the ICU occurred in 121 (17.2%) of the patients hospitalized, and in-hospital mortality in the ICU cohort was 211 (30.0%). Supplementary Table 1 shows the distribution between the inpatient and ICU groups for the total variables evaluated.
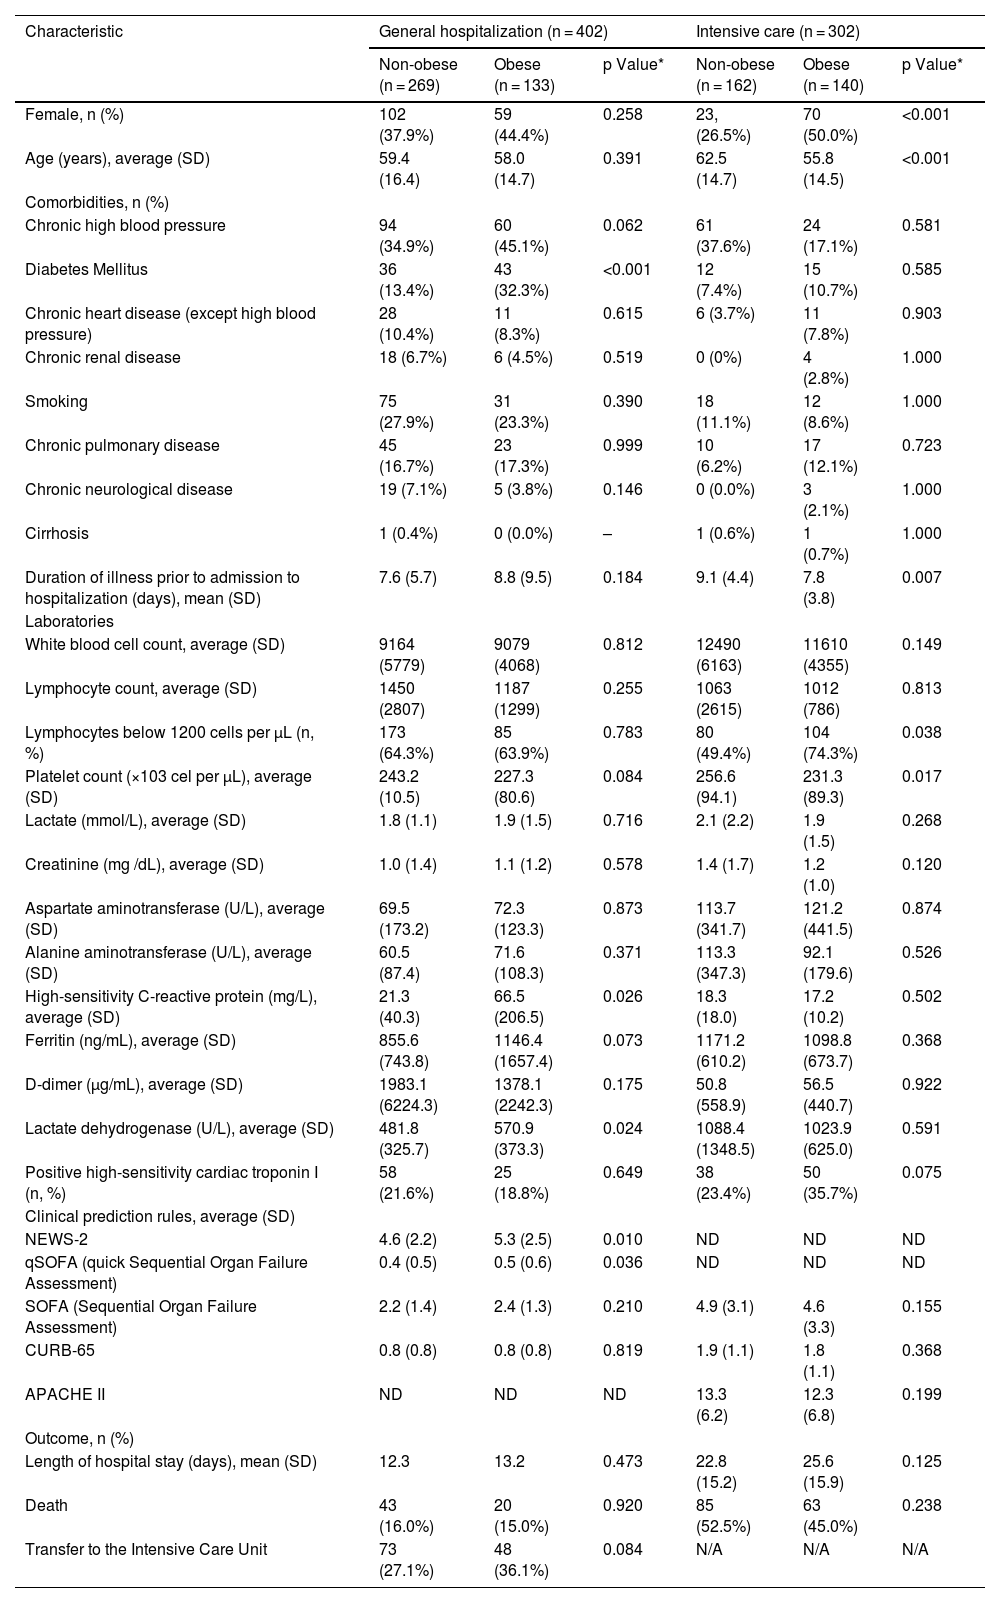
Table 1 shows the differentiated characteristics between the presence or absence of obesity in the groups of patients hospitalized in wards or in the ICU. Among those hospitalized in the ICU there was a higher frequency of female sex (50.0 vs. 26.5%, p < 0.001) and lower average age (55.8 vs. 62.5 years, p < 0.001) among obese patients compared to non-obese patients. In the general ward, there was a higher percentage of diabetics among the obese 32.3% compared to the non-obese 13.4% (p < 0.001). There was evidence of earlier admission to the ICU for obese patients compared to non-obese patients with 7.8 days (SD 3.8) vs. 9.1 days (SD 4.4) respectively, p = 0.007. Within the paraclinics of severity in the ICU population, lymphocytes <1200 cells/μL were seen in 80 (49.4%) patients among the non-obese vs 104 (74.3%) in obese (p = 0.038). In the general hospitalized population, the C-Reactive Protein (CRP) was higher in obese vs. non-obese patients, 66.5 mg/L (SD 206.5) vs. 21.3 (SD 40.3) respectively (p = 0.026).
General characteristics of the population hospitalized in general and intensive care wards classified on the basis of the presence or absence of obesity.
| Characteristic | General hospitalization (n = 402) | Intensive care (n = 302) | ||||
|---|---|---|---|---|---|---|
| Non-obese (n = 269) | Obese (n = 133) | p Value* | Non-obese (n = 162) | Obese (n = 140) | p Value* | |
| Female, n (%) | 102 (37.9%) | 59 (44.4%) | 0.258 | 23, (26.5%) | 70 (50.0%) | <0.001 |
| Age (years), average (SD) | 59.4 (16.4) | 58.0 (14.7) | 0.391 | 62.5 (14.7) | 55.8 (14.5) | <0.001 |
| Comorbidities, n (%) | ||||||
| Chronic high blood pressure | 94 (34.9%) | 60 (45.1%) | 0.062 | 61 (37.6%) | 24 (17.1%) | 0.581 |
| Diabetes Mellitus | 36 (13.4%) | 43 (32.3%) | <0.001 | 12 (7.4%) | 15 (10.7%) | 0.585 |
| Chronic heart disease (except high blood pressure) | 28 (10.4%) | 11 (8.3%) | 0.615 | 6 (3.7%) | 11 (7.8%) | 0.903 |
| Chronic renal disease | 18 (6.7%) | 6 (4.5%) | 0.519 | 0 (0%) | 4 (2.8%) | 1.000 |
| Smoking | 75 (27.9%) | 31 (23.3%) | 0.390 | 18 (11.1%) | 12 (8.6%) | 1.000 |
| Chronic pulmonary disease | 45 (16.7%) | 23 (17.3%) | 0.999 | 10 (6.2%) | 17 (12.1%) | 0.723 |
| Chronic neurological disease | 19 (7.1%) | 5 (3.8%) | 0.146 | 0 (0.0%) | 3 (2.1%) | 1.000 |
| Cirrhosis | 1 (0.4%) | 0 (0.0%) | – | 1 (0.6%) | 1 (0.7%) | 1.000 |
| Duration of illness prior to admission to hospitalization (days), mean (SD) | 7.6 (5.7) | 8.8 (9.5) | 0.184 | 9.1 (4.4) | 7.8 (3.8) | 0.007 |
| Laboratories | ||||||
| White blood cell count, average (SD) | 9164 (5779) | 9079 (4068) | 0.812 | 12490 (6163) | 11610 (4355) | 0.149 |
| Lymphocyte count, average (SD) | 1450 (2807) | 1187 (1299) | 0.255 | 1063 (2615) | 1012 (786) | 0.813 |
| Lymphocytes below 1200 cells per μL (n, %) | 173 (64.3%) | 85 (63.9%) | 0.783 | 80 (49.4%) | 104 (74.3%) | 0.038 |
| Platelet count (×103 cel per μL), average (SD) | 243.2 (10.5) | 227.3 (80.6) | 0.084 | 256.6 (94.1) | 231.3 (89.3) | 0.017 |
| Lactate (mmol/L), average (SD) | 1.8 (1.1) | 1.9 (1.5) | 0.716 | 2.1 (2.2) | 1.9 (1.5) | 0.268 |
| Creatinine (mg /dL), average (SD) | 1.0 (1.4) | 1.1 (1.2) | 0.578 | 1.4 (1.7) | 1.2 (1.0) | 0.120 |
| Aspartate aminotransferase (U/L), average (SD) | 69.5 (173.2) | 72.3 (123.3) | 0.873 | 113.7 (341.7) | 121.2 (441.5) | 0.874 |
| Alanine aminotransferase (U/L), average (SD) | 60.5 (87.4) | 71.6 (108.3) | 0.371 | 113.3 (347.3) | 92.1 (179.6) | 0.526 |
| High-sensitivity C-reactive protein (mg/L), average (SD) | 21.3 (40.3) | 66.5 (206.5) | 0.026 | 18.3 (18.0) | 17.2 (10.2) | 0.502 |
| Ferritin (ng/mL), average (SD) | 855.6 (743.8) | 1146.4 (1657.4) | 0.073 | 1171.2 (610.2) | 1098.8 (673.7) | 0.368 |
| D-dimer (μg/mL), average (SD) | 1983.1 (6224.3) | 1378.1 (2242.3) | 0.175 | 50.8 (558.9) | 56.5 (440.7) | 0.922 |
| Lactate dehydrogenase (U/L), average (SD) | 481.8 (325.7) | 570.9 (373.3) | 0.024 | 1088.4 (1348.5) | 1023.9 (625.0) | 0.591 |
| Positive high-sensitivity cardiac troponin I (n, %) | 58 (21.6%) | 25 (18.8%) | 0.649 | 38 (23.4%) | 50 (35.7%) | 0.075 |
| Clinical prediction rules, average (SD) | ||||||
| NEWS-2 | 4.6 (2.2) | 5.3 (2.5) | 0.010 | ND | ND | ND |
| qSOFA (quick Sequential Organ Failure Assessment) | 0.4 (0.5) | 0.5 (0.6) | 0.036 | ND | ND | ND |
| SOFA (Sequential Organ Failure Assessment) | 2.2 (1.4) | 2.4 (1.3) | 0.210 | 4.9 (3.1) | 4.6 (3.3) | 0.155 |
| CURB-65 | 0.8 (0.8) | 0.8 (0.8) | 0.819 | 1.9 (1.1) | 1.8 (1.1) | 0.368 |
| APACHE II | ND | ND | ND | 13.3 (6.2) | 12.3 (6.8) | 0.199 |
| Outcome, n (%) | ||||||
| Length of hospital stay (days), mean (SD) | 12.3 | 13.2 | 0.473 | 22.8 (15.2) | 25.6 (15.9) | 0.125 |
| Death | 43 (16.0%) | 20 (15.0%) | 0.920 | 85 (52.5%) | 63 (45.0%) | 0.238 |
| Transfer to the Intensive Care Unit | 73 (27.1%) | 48 (36.1%) | 0.084 | N/A | N/A | N/A |
SD: standard deviation, ND: no data, N/A: not applicable.
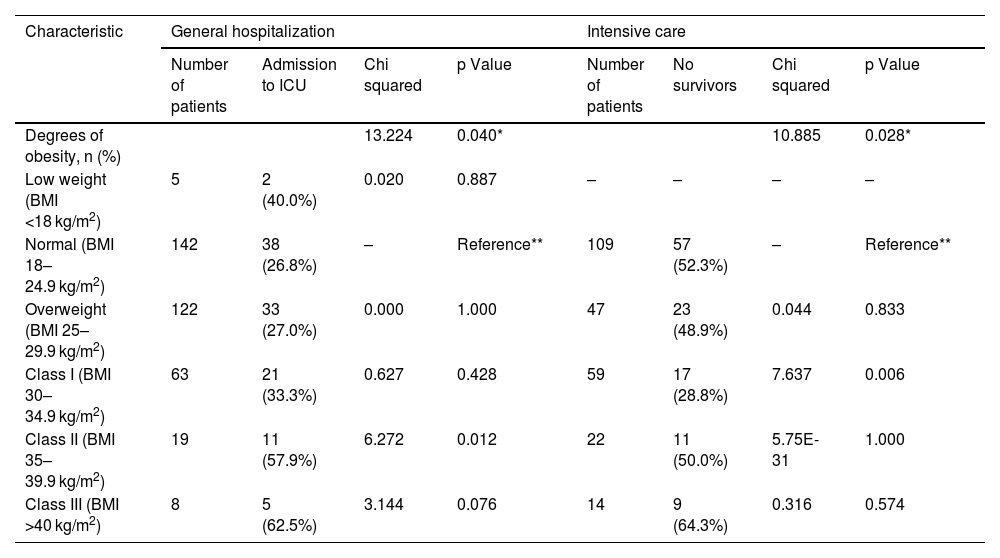
The results of the comparisons between the different weight categories for both outcomes are presented in Table 2. It seems to indicate a gradual increase in the percentage of patients transferred to the ICU as the degree of obesity increases, but only in class II obesity this difference was significant from normal weight. In the case of mortality in ICU patients, class I obesity had a lower percentage of events than normal weight. Supplementary Table 2 shows the complications of hospitalized intensive care patients and their relationship with the presence of obesity.
Classification of weight grading and bivariate analysis with respect to admission to intensive care (done on 359 inpatients with BMI data) and to death (done on 251 intensive care patients with BMI data).
| Characteristic | General hospitalization | Intensive care | ||||||
|---|---|---|---|---|---|---|---|---|
| Number of patients | Admission to ICU | Chi squared | p Value | Number of patients | No survivors | Chi squared | p Value | |
| Degrees of obesity, n (%) | 13.224 | 0.040* | 10.885 | 0.028* | ||||
| Low weight (BMI <18 kg/m2) | 5 | 2 (40.0%) | 0.020 | 0.887 | – | – | – | – |
| Normal (BMI 18–24.9 kg/m2) | 142 | 38 (26.8%) | – | Reference** | 109 | 57 (52.3%) | – | Reference** |
| Overweight (BMI 25–29.9 kg/m2) | 122 | 33 (27.0%) | 0.000 | 1.000 | 47 | 23 (48.9%) | 0.044 | 0.833 |
| Class I (BMI 30–34.9 kg/m2) | 63 | 21 (33.3%) | 0.627 | 0.428 | 59 | 17 (28.8%) | 7.637 | 0.006 |
| Class II (BMI 35–39.9 kg/m2) | 19 | 11 (57.9%) | 6.272 | 0.012 | 22 | 11 (50.0%) | 5.75E-31 | 1.000 |
| Class III (BMI >40 kg/m2) | 8 | 5 (62.5%) | 3.144 | 0.076 | 14 | 9 (64.3%) | 0.316 | 0.574 |
BMI: Body Mass Index, ICU: Intensive Care Unit.
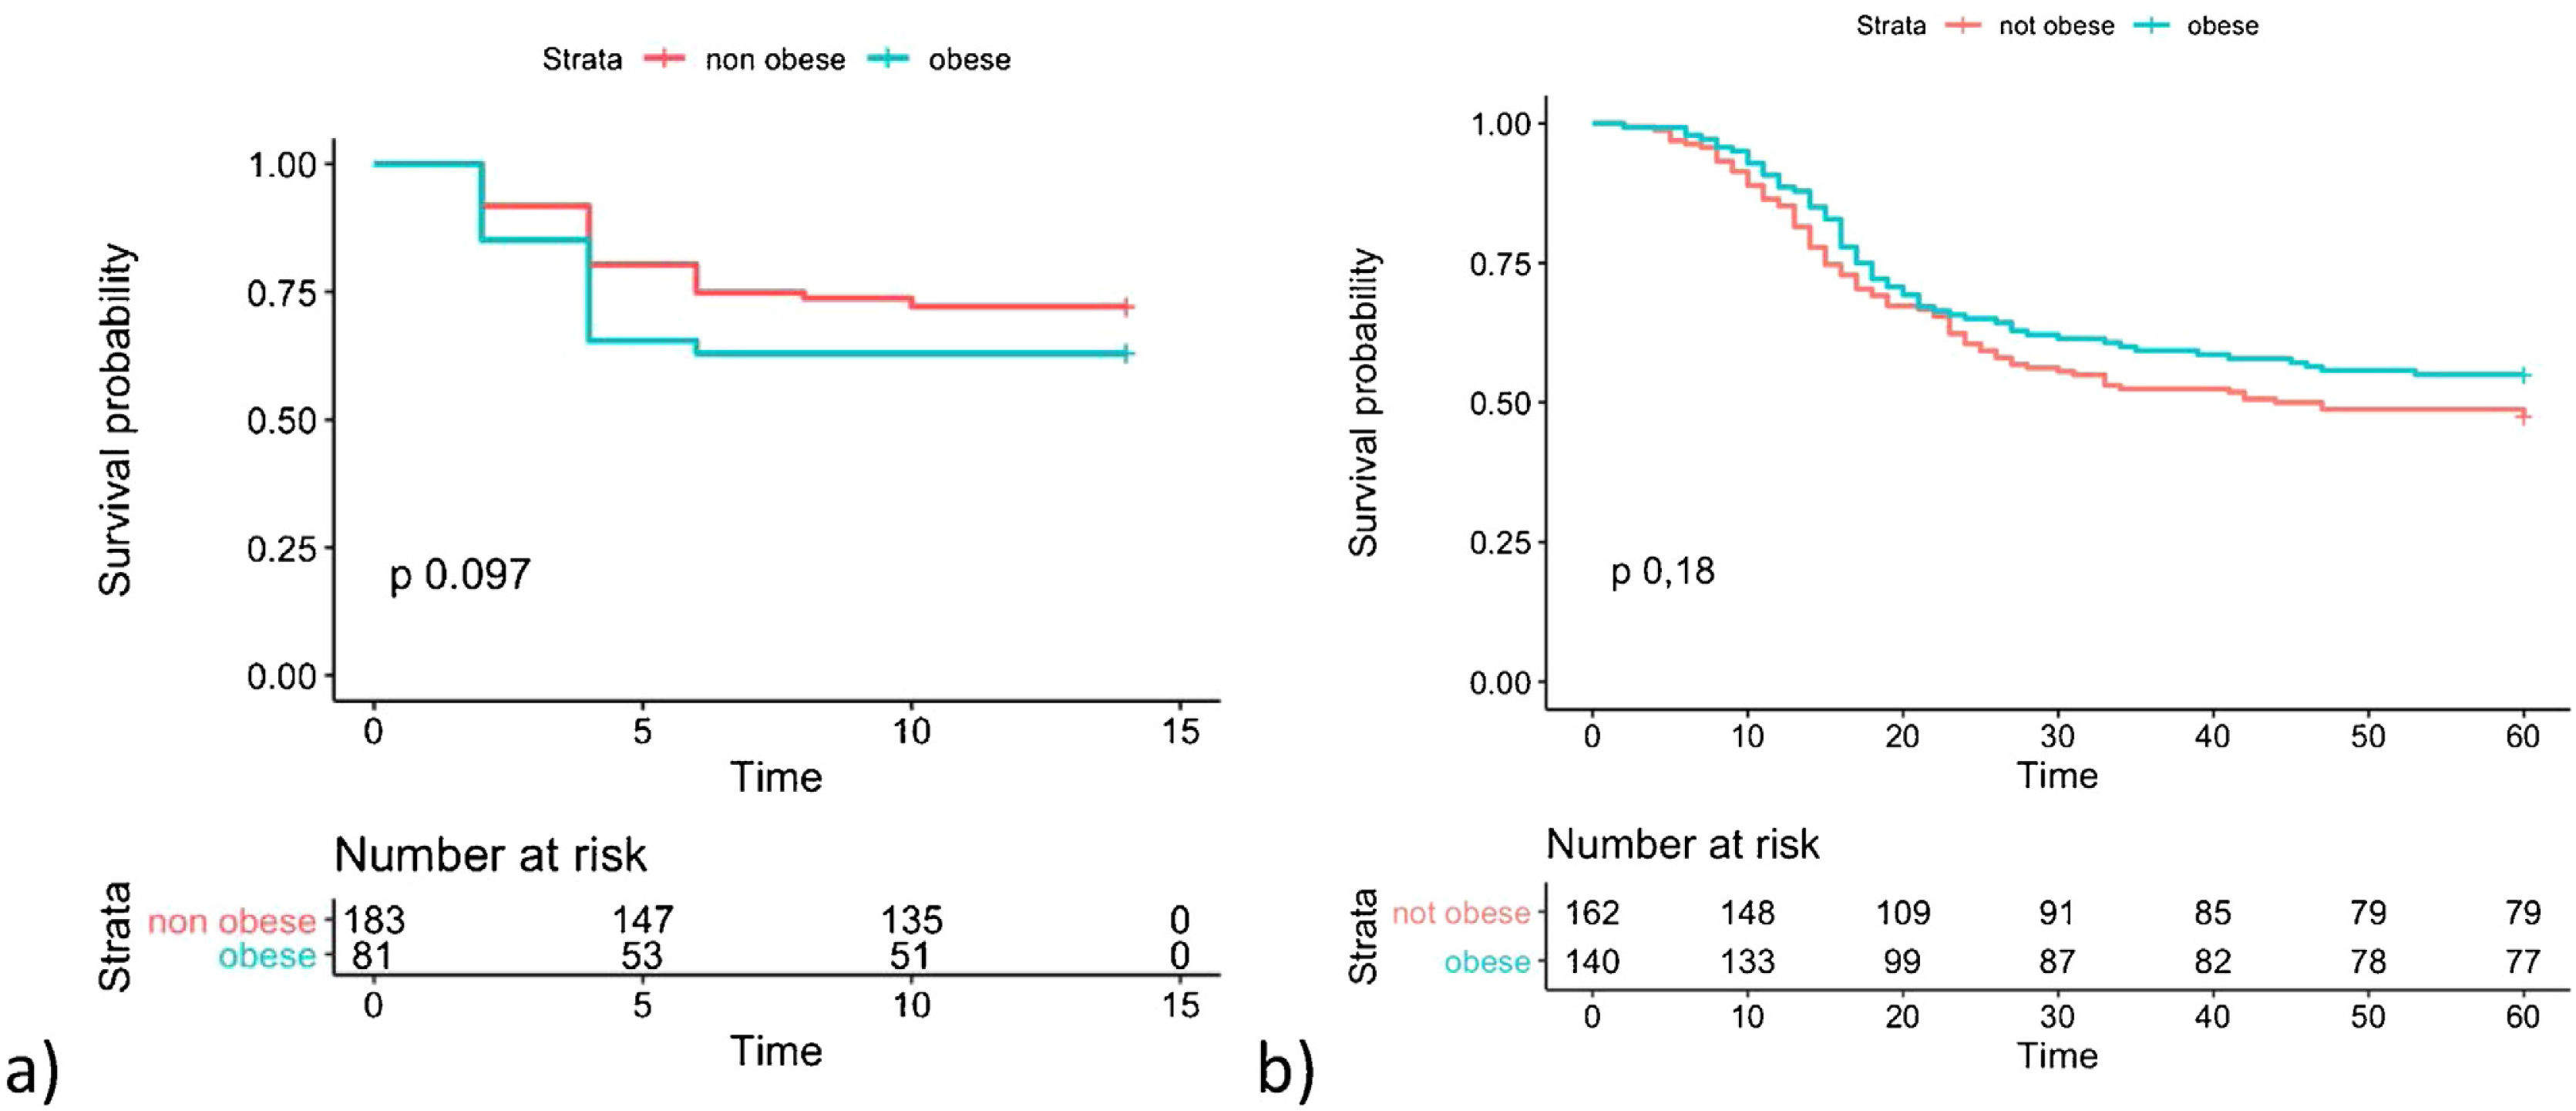
Fig. 1 shows the Kaplan Meier curves with the cumulative survival over time for groups of patients with and without the presence of obesity for both outcomes. A p value of 0.097 was obtained by LogRank test for transfer to ICU and 0.185 for death.
 inpatient admission to intensive care, b) mortality of patients hospitalized in the intensive care unit.")
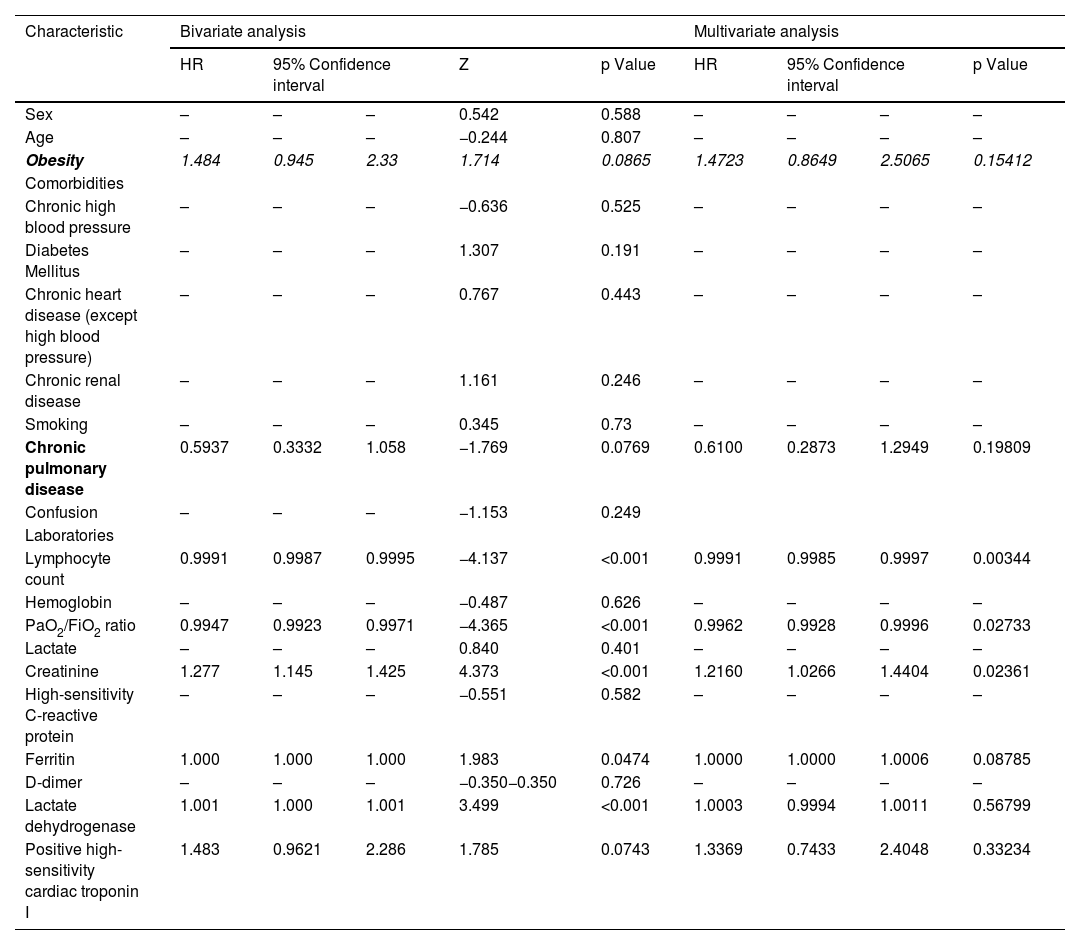
The bivariate Cox analysis for the association between obesity and the need to transfer to the ICU in the cohort of patients hospitalized in general ward yielded an HR = 1.484 (95% CI 0.945–2.330; p = 0.087). When the multivariate Cox proportional hazards model was run, an HR of 1.472 (95%CI 0.865–2.506; p = 0.154) was obtained with 8 variables. The variables that was significant were: the lymphocyte count, the PaO2/FiO2 ratio and Creatinine with HR of 0.999, 0.996 and 1.216 respectively (Table 3). In intensive care patients, a HR = 0.803 (95% CI 0.580–1.112; p = 0.187) was found for the association between the presence of obesity and mortality. Since no significant difference was detected, the multivariate model was not run.
Results of bi- and multivariate Cox analyses regarding the association of various risk factors with admission of patients hospitalized in the general ward for COVID-19 to intensive care.
| Characteristic | Bivariate analysis | Multivariate analysis | |||||||
|---|---|---|---|---|---|---|---|---|---|
| HR | 95% Confidence interval | Z | p Value | HR | 95% Confidence interval | p Value | |||
| Sex | – | – | – | 0.542 | 0.588 | – | – | – | – |
| Age | – | – | – | −0.244 | 0.807 | – | – | – | – |
| Obesity | 1.484 | 0.945 | 2.33 | 1.714 | 0.0865 | 1.4723 | 0.8649 | 2.5065 | 0.15412 |
| Comorbidities | |||||||||
| Chronic high blood pressure | – | – | – | −0.636 | 0.525 | – | – | – | – |
| Diabetes Mellitus | – | – | – | 1.307 | 0.191 | – | – | – | – |
| Chronic heart disease (except high blood pressure) | – | – | – | 0.767 | 0.443 | – | – | – | – |
| Chronic renal disease | – | – | – | 1.161 | 0.246 | – | – | – | – |
| Smoking | – | – | – | 0.345 | 0.73 | – | – | – | – |
| Chronic pulmonary disease | 0.5937 | 0.3332 | 1.058 | −1.769 | 0.0769 | 0.6100 | 0.2873 | 1.2949 | 0.19809 |
| Confusion | – | – | – | −1.153 | 0.249 | ||||
| Laboratories | |||||||||
| Lymphocyte count | 0.9991 | 0.9987 | 0.9995 | −4.137 | <0.001 | 0.9991 | 0.9985 | 0.9997 | 0.00344 |
| Hemoglobin | – | – | – | −0.487 | 0.626 | – | – | – | – |
| PaO2/FiO2 ratio | 0.9947 | 0.9923 | 0.9971 | −4.365 | <0.001 | 0.9962 | 0.9928 | 0.9996 | 0.02733 |
| Lactate | – | – | – | 0.840 | 0.401 | – | – | – | – |
| Creatinine | 1.277 | 1.145 | 1.425 | 4.373 | <0.001 | 1.2160 | 1.0266 | 1.4404 | 0.02361 |
| High-sensitivity C-reactive protein | – | – | – | −0.551 | 0.582 | – | – | – | – |
| Ferritin | 1.000 | 1.000 | 1.000 | 1.983 | 0.0474 | 1.0000 | 1.0000 | 1.0006 | 0.08785 |
| D-dimer | – | – | – | −0.350−0.350 | 0.726 | – | – | – | – |
| Lactate dehydrogenase | 1.001 | 1.000 | 1.001 | 3.499 | <0.001 | 1.0003 | 0.9994 | 1.0011 | 0.56799 |
| Positive high-sensitivity cardiac troponin I | 1.483 | 0.9621 | 2.286 | 1.785 | 0.0743 | 1.3369 | 0.7433 | 2.4048 | 0.33234 |
HR: Hazard Ratio, PaO2/FiO2 ratio: relationship of arterial oxygen pressure and the fraction of inspired oxygen.
In the first reports describing COVID-19, obesity was not included among the risk factors that were evaluated.18–20 Perhaps one of the studies where this association was first revealed was in a cohort of 5279 patients from New York in which BMI is one of the factors most strongly associated with hospital admission and critical illness with BMI >40 kg/m2 having an OR of 2.5 and 1.5 respectively.21 The present study could not demonstrate an association of obesity with admission to the ICU in contrast with other cohort studies of hospitalized patients in which this association has been documented. Among 3615 outpatients and inpatients with COVID-19 in New York, obesity class I resulted in an OR = 1.8 for ICU admission.22 A small French cohort showed its association with the need for invasive ventilatory support (OR = 7.36).23 A study of 10,861 patients from New York (US) documented a “dose effect” for the requirement of mechanical ventilation; overweight OR = 1.27, obesity class I OR = 1.48, obesity class II OR = 1.89 and obesity class III OR = 2.31.24 The Obesity-T2DM Covid19 Study Group in 3065 patients from Italy and Spain found that obesity was an independent predictor of ICU admission in a gradual manner although with overlapping CIs.25
A meta-analysis that included six studies with 2770 patients with data for ICU admission and five studies with 509 patients found an OR of 1.21 for ICU admission and an OR of 2.05 for invasive mechanical ventilation.26 A brief report that added 9 articles to the previous work showed that for each 5-unit increase in BMI, the summary OR rose 1.43 for invasive mechanical ventilation and 1.22 for critical COVID-19.27 The systematic review with the largest number of studies reported so far (41 with 219,543 cases) reported that subjects with obesity were more likely to have a positive SARS-CoV-2 test result (OR = 1.50), hospitalizations (OR = 1.54), admission to intensive care (OR = 1.48), need for invasive mechanical ventilation (OR = 1.47) and in-hospital mortality (OR = 1.14).28
With respect to mortality in patients admitted to the ICU, the present study was unable to document a protective effect of obesity. Several reports have documented increased mortality related to the presence of obesity in patients with COVID-19. A report on 300 patients hospitalized in 9 ICUs in New York (US) documented an association between BMI and death in a multivariate model with a RR = 1.02 per kg/m2.29 A multicenter cohort of 138 hospitals in France, Belgium, and Switzerland that included 4643 critically ill patients documented that grade II and III obesity correlated with increased 90-day mortality (HR = 1.50 and 2.05 respectively).30 A large cohort of 13,301 critically ill patients in the Rede D’Or São Luiz from eight Brazilian states demonstrated that obesity had a borderline association with mortality (HR = 1.11).31
Nevertheless, one group of studies has failed to demonstrate an effect of the presence of obesity on mortality. Among 121 critically ill patients in the Netherlands, there was no significant difference in survival at 28 days on Kaplan-Meier curves (log rank p = 0.545) or in the multivariable Cox regression model for patients with obesity.32 The cohort of 633 patients from 30 Spanish ICUs found that the average BMI was not significantly different between patients who survived and those who did not (p = 0.466).33 This finding is similar to that of the European RISC-19-ICU registry with 639 critically ill patients (p = 0.589).34 In another report, no difference in the prevalence of obesity between survivors and non-survivors was documented in 1909 patients from 63 Argentine ICUs (p = 0.148).34
The controversial results previously exposed have also been addressed in a systematic review of 23 systematic reviews that indicates how “it is difficult to draw a firm conclusion about Class I and Class II obesity due to conflicting outcomes of meta-analyses”.35,36 It seems that obesity acts as a risk factor for both hospitalization and clinical worsening as well as for death although it could be neutral in the latter aspect. This makes it impossible to establish a paradox for obesity in the context of COVID-19.36 It is not easy to reach a conclusion as to a reason for this different behavior compared to other pneumonias. The special characteristics of clinical care during the first phase of the pandemic from which most of the information for analyzing this risk factor is derived could have implications with respect to the clinical outcomes of this population. However, a profound degree of pulmonary dysfunction predominates, and this could signal an irreversible trend towards death for those who reach this condition.37,38 Note that the indications for transfer to intensive care may have been disregarded during specific times of the pandemic (such as the first and second waves from which the patients in this study came) depending on variations in the availability of ICU beds.
A possible limitation of the present study is that a sample size was not calculated a priori although the number of events presented seems to be sufficiently high for the statistical analyses carried out. Patients who died directly in general hospitalization were not included in the analysis, so a selection bias could have arisen, either determined by the time of the pandemic or individual decision for “not to transfer to the ICU”. The way in which obesity has been studied as a risk factor has included various methodologies. We consider the inclusion of several of them as well as the multicenter character of the cohort to be a strength of the present analysis. Although the intensive care cohort only included one institution, it received patients from a wide area in the city after having become a reference center for critical care, with a five-fold increase in the number of beds during the period included.
ConclusionsThe results of the present study do not show an association between inpatients with presence of obesity and the risk of being transfered to intensive care or with death in the case of intensive care patients due to COVID-19. This is why it does not confirm the presence of an obesity paradox in this patient population.
FundingThe current study received funding from the call for proposals under Research Promotion number DI-I-0631-20 of the research division of the Fundación Universitaria de Ciencias de la Salud (Health Sciences University Foundation)
Availability of data and materialsAll data generated and/or analyzed during this study are available from the corresponding author upon reasonable request conditioned by its review by the institutional ethics and research committee.
Authors’ contributionsAll the authors participated in the planning, design, data analysis, and preparation of this article.
Ethics approval and consent to participateThe work was approved by the ethics and research committees at each one of the institutions and filling out an informed consent document was not considered necessary given the retrospective nature of the study.
Consent for publicationNot applicable.
Competing interestsThe authors declare that they have no competing interests.
The following is Supplementary data to this article: