


To assess the performance of the ultrasound measurement of stroke volume (SV) coupled to passive leg raising (PLR) in predicting fluid responsiveness (FR).
DesignA prospective cohort study was carried out in patients requiring volume expansion (VE). A transthoracic Doppler echocardiography (TTE) device was used for the measurement of SV. Four measurements were obtained: before and 90s after PLR, and before and after VE. The patients were subsequently classified according to their hemodynamic response to VE. Responders were defined by an increase in SV of at least 15% in response to VE.
ResultsThirty maneuvers were studied. An increase in SV>15% in response to PLR was recorded in 21 cases. Hemodynamic indices taken in the first stage showed significant differences in the distensibility index of the inferior vena cava (dIVC), in the velocity-time integral of aortic blood flow (VTIAo) and in SV, with respective p-values of 0.009, 0.012 and 0.025. The SV changes induced by VE were significantly correlated to the SV changes induced by PLR, with a Spearman coefficient of 0.77 and a linear equation y=0.82 x+1.68. Fluid responsiveness can be efficiently predicted by assessing the effects of PLR on SV monitored by Doppler TTE, with a sensitivity of 94.7% and a negative predictive value of 88%.
ConclusionOur data support the interest of Doppler TTE as an effective tool in predicting FR through the assessment of SV in response to PLR, in hemodynamically unstable patients.
Evaluar el rendimiento de la medida del volumen sistólico (VS) por ultrasonido junto con la elevación pasiva de piernas (EPP) para predecir la respuesta de fluidos (RF).
DiseñoEstudio prospectivo de cohorte realizado en pacientes que requieren expansión de volumen (EV). Se utilizó un dispositivo doppler ecocardiográfico transtorácico (ETT) para la medición del VS. Se obtuvieron 4 mediciones: antes y 90s después de la EPP, y antes y después de la EV. Posteriormente, los pacientes se clasificaron según su respuesta hemodinámica a VE. Los respondedores se definieron por un aumento del VS de al menos 15% en respuesta a EV.
ResultadosSe estudiaron 30 maniobras. Un aumento del VS>15% en respuesta a la EPP se informó en 21 casos. Los índices hemodinámicos tomados en la primera etapa mostraron diferencias significativas en el índice de distensibilidad de la vena cava inferior (dVCI), en la integral velocidad-tiempo del flujo sanguíneo aórtico (IVTAo) y en el VS con valores p respectivos en 0,009, 0,012 y 0,025. Los cambios del VS inducidos por EV se correlacionaron significativamente con los cambios del VS inducidos por EPP con un coeficiente de Spearman en 0,77 y una ecuación lineal en y=0,82× +1,68. La respuesta de fluidos se puede predecir eficazmente mediante la evaluación de los efectos de EPP en el VS vigilado por ETT-doppler con sensibilidad en el 94,7% y VPN en el 88%.
ConclusiónNuestros datos respaldan el interés del ETT-doppler como una herramienta eficaz en la predicción de la RF por la evaluación del VS en respuesta a la EPP en pacientes hemodinámicamente inestables.
In critically ill patients at risk for organ failure, the administration of intravenous fluids has equal chances of resulting in benefit or harm. Hence, the assessment of the preload status is a paramount step before any volume expansion (VE) in order to determine in which portion of the Starling curve is located the patient. When the heart is operating on the steep portion of the curve, stroke volume (SV) increases substantially when preload increases with intravenous fluids, which means administration of fluids improves cardiac output and oxygen delivery. In contrast, when the heart is operating on the flat portion of the curve, further increasing preload with intravenous fluids will not substantially increase SV.1,2 Indeed, large volume fluid resuscitation may contribute to endothelial injury and lead to interstitial edema and organ dysfunction, prolonger mechanical ventilation times, and contribute to the development of intra-abdominal hypertension.3–5
It is now recognized that the static preload indices have a moderate interest in fluid responsiveness (FR) prediction and dynamic techniques need to be applied. Changes in stroke volume in response to intravenous fluids are best determined by dynamic indexes. Passive leg raising (PLR) remains one of the most versatile and reversible techniques to assess fluid needs in intensive care unit (ICU) patients.6,7 This procedure rapidly returns 200–300ml of blood from the veins of the lower extremities to the central circulation.7 As a result of increased ventricular preload, the stroke volume (SV); and therefore the cardiac output (CO); is augmented according to the degree of preload reserve. And it rapidly reversed when the legs are returned to a horizontal position.
Transthoracic echocardiography (TTE) is increasingly used for non-invasive hemodynamic assessment of critically ill patients since high-quality images and Doppler signals are obtained with recent TTE equipment.8 The response of the descending aortic blood flow to passive leg raising (PLR) has been proposed to predict volume responsiveness.9
The aim of our study was to assess the performance of the ultrasound measurement of the SV coupled with PLR to predict FR in the ICU patients.
Patients and methodsScopeThis study was conducted at the Multipurpose Medical intensive care unit of La Rabta University Hospital. Our unit consists of 8 ICU beds and receives medical pathologies of all types (hemodynamic, respiratory, neurological and metabolic). The traumatic-surgical pathologies do not enter in our activity.
Study designThis was designed as an observational prospective cohort study, over a period of four months (from January 2017 to April 2017). The study was approved by the Ethics Committee of the institutional review board of La Rabta hospital. As the protocol was considered part of routine practice, informed consent was waived following the recommendations of the Ethical Committee. Patients or their legal relatives were informed by the participation in this study.
PatientsPatients were enrolled from the medical ICU and any patient requiring VE as determined by the ICU attending physician was eligible for enrolment. No specific criteria for circulatory insufficiency were required for study entry. The decision of the ICU attending to administer fluid was based on clinical signs of inadequate global perfusion: mean arterial pressure (MAP) below 60mmHg, oliguria (urine output less than 0.5ml/kg per hour for more than 2h), cold extremities, mottled skin, and tachycardia [heart rate (HR) higher than 100/min]. Exclusion criteria were known aortic valve disease, known ascending aortic aneurysm, contraindication to PLR for any reason, and poor cardiac echogenicity.
Protocol and echocardiographic measurementsThe echocardiographic examination was performed by the same operator (AT) following training on the device and using a transthoracic ultrasound device (Hitachi Aloka – ARIETTA V60), equipped with the tissue Doppler imaging program and a phased array transducer C251 Convex 5-1Mhz. Conventional echocardiography including M-mode, two-dimensional, and Doppler measurements was performed. Echocardiographic images were recorded together with the electrocardiogram. The device used directly measures the blood flow through the aortic valve.
For each patient studied, echocardiographic measurements were taken in four stages. In stage one the patient was placed in a semi-recumbent position with the head elevated at 45 degrees. In stage two, the patient was positioned supine with the legs straight and elevated at 45 degrees for 90s. The highest plateau value of velocity-time integral of aortic blood flow (VTIAo) recorded during PLR was obtained within the first 90s following leg elevation. Stage three readings were taken 2min after the patient was returned to the baseline position, and stage four immediately following expansion of 500ml of crystalloids over 15min. The different stages of passive leg raising as well as the volume expansion were in accordance with the method described by Monnet et al.7 (Fig. 1). Vasopressors and ventilator settings were not changed at any time while a patient was being studied.

Used method for passive leg raising as described by Monnet et al.7
The stroke volume was calculated as the product of the VTIAo by the aortic valve area. Using the apical five-chamber view the VTIAo was computed from the area under the envelope of the continued-wave doppler signal obtained at the level of the aortic annulus. The VTIAo value was averaged over five consecutive measurements in sinus rhythm patients and over ten measurements in patients with atrial fibrillation. Using the parasternal long axis view the diameter of the aortic orifice was measured at the insertion of the aortic cusp and the aortic valve area was calculated [π×(Diameter/2)2]. As the diameter of the aortic orifice is assumed to remain constant in a given patient, the diameter was measured once at baseline. The cardiac output was calculated as the product of stroke volume by the heart rate. Thereafter, the studied patients were classified according to their responsiveness to the endogenous (by PLR) and/or exogenous (by VE). Likewise, the left ventricular ejection fraction (LVEF) was measured by the technique of Teicholz in the large-axis parasternal view or simpson on the 4-cavity view (in the presence of segmental kinetics disorders). Also, the inferior vena cava (IVC) diameter was examined within 0.5–3cm from the caval–right atrial junction in the subcostal view and the distensibility index (dIVC) was calculated as the ratio of (Dmax−Dmin)/Dmin.
Definition of volume responsivenessPatients were classified according to their hemodynamic response to VE. Responders had a SV increment of at least 15% in response to VE (an increase in SV from stage one to stage four), while non-responders had a SV increase of less than 15%. Cut-off values of 15% have been previously used as a significant difference between two measures of CO in similar studies.10–13 Indeed, this value is considered as the cut-off that predict volume responsiveness in the recent revision on echocardiography in shock management.8
Statistical analysisContinuous data are expressed as mean±standard deviation or median [interquartile range 25th–75th percentile (p25–p75)] as appropriate. Hemodynamic variables were compared between responders and non-responders using the nonparametric Mann–Whitney test. The Kruskal–Wallis test was used to test differences between 3 subgroups. The quantitative variables before/after PLR and before/after EV were compared using the non parametric Wilcoxon test for paired series. The area under receiver operating characteristic (ROC) curve was used to measure the predictive values of ultrasound variation of SV after PLR and VE and expressed as the area±standard error. The Spearman test was used to assess the correlation between the SV variations (before/after PLR and before/after VE). Differences with a p value less than 0.05 were considered statistically significant.
Statistical analyses were performed using the SPSS© version 20 software package.
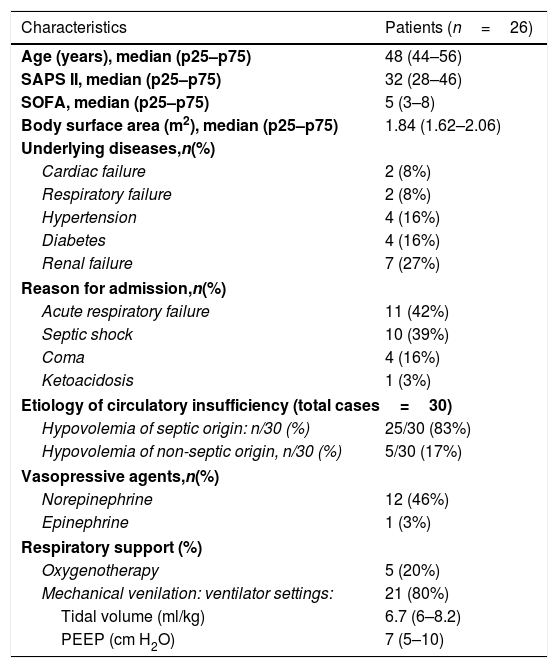
ResultsPatient characteristicsTwenty-eight patients were examined and 26 were studied. Two patients had to be excluded because of satisfactory doppler signals could not be obtained. Thus, a total of 30 volume challenges in 26 consecutive patients were evaluated. Three patients had more than one study. Repeat studies performed on the same patient were separated in time by at least 24h. The indications of a volume expansion were: septic shock in 21cases, sepsis without shock: 4 cases, metabolic complications of diabetes (ketoacidosis: 1 case and hyperosmolar state occurred during hospitalization: 2 cases), dehydration with deglobulisation following accidental arterial puncture: 1 case (the time waiting blood transfusion) and pancreatitis with a 3rd sector: 1 case. The clinical characteristics are reported in Table 1.
Patient characteristics.
| Characteristics | Patients (n=26) |
|---|---|
| Age (years), median (p25–p75) | 48 (44–56) |
| SAPS II, median (p25–p75) | 32 (28–46) |
| SOFA, median (p25–p75) | 5 (3–8) |
| Body surface area (m2), median (p25–p75) | 1.84 (1.62–2.06) |
| Underlying diseases,n(%) | |
| Cardiac failure | 2 (8%) |
| Respiratory failure | 2 (8%) |
| Hypertension | 4 (16%) |
| Diabetes | 4 (16%) |
| Renal failure | 7 (27%) |
| Reason for admission,n(%) | |
| Acute respiratory failure | 11 (42%) |
| Septic shock | 10 (39%) |
| Coma | 4 (16%) |
| Ketoacidosis | 1 (3%) |
| Etiology of circulatory insufficiency (total cases=30) | |
| Hypovolemia of septic origin: n/30 (%) | 25/30 (83%) |
| Hypovolemia of non-septic origin, n/30 (%) | 5/30 (17%) |
| Vasopressive agents,n(%) | |
| Norepinephrine | 12 (46%) |
| Epinephrine | 1 (3%) |
| Respiratory support (%) | |
| Oxygenotherapy | 5 (20%) |
| Mechanical venilation: ventilator settings: | 21 (80%) |
| Tidal volume (ml/kg) | 6.7 (6–8.2) |
| PEEP (cm H2O) | 7 (5–10) |
SAPS, Simplified Acute Physiology Score; SOFA, Sequential Organ Failure Assessment Score; PEEP, positive end-expiratory pressure.
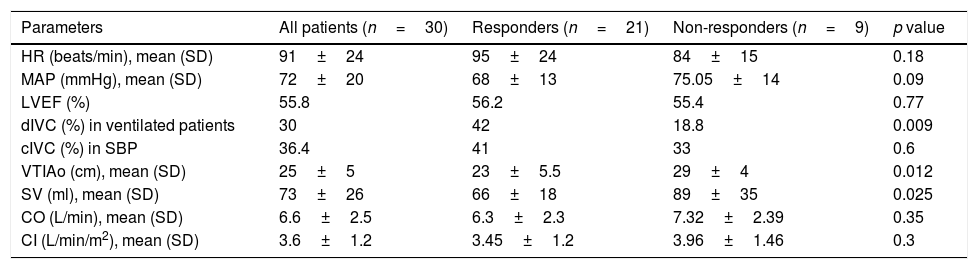
The initial hemodynamic measurements are summarized in Table 2. The responders had a significantly lower initial VTIAo and SV compared with the non-responders (23±5.5 vs 29±4cm, p=0.012 and 66±18 vs 89±35ml, p=0.025). Likewise, the distensibility index of inferior vena cava (dIVC) was higher in responders group (42% vs 18.8%, p=0.009).
Initial hemodynamic parameters taken in stage one.
| Parameters | All patients (n=30) | Responders (n=21) | Non-responders (n=9) | p value |
|---|---|---|---|---|
| HR (beats/min), mean (SD) | 91±24 | 95±24 | 84±15 | 0.18 |
| MAP (mmHg), mean (SD) | 72±20 | 68±13 | 75.05±14 | 0.09 |
| LVEF (%) | 55.8 | 56.2 | 55.4 | 0.77 |
| dIVC (%) in ventilated patients | 30 | 42 | 18.8 | 0.009 |
| cIVC (%) in SBP | 36.4 | 41 | 33 | 0.6 |
| VTIAo (cm), mean (SD) | 25±5 | 23±5.5 | 29±4 | 0.012 |
| SV (ml), mean (SD) | 73±26 | 66±18 | 89±35 | 0.025 |
| CO (L/min), mean (SD) | 6.6±2.5 | 6.3±2.3 | 7.32±2.39 | 0.35 |
| CI (L/min/m2), mean (SD) | 3.6±1.2 | 3.45±1.2 | 3.96±1.46 | 0.3 |
HR, heart rate; SD, standard deviation; MAP, Mean arterial pressure (mmHg); LVEF, left ventricular ejection fraction; dIVC, distensibility index of inferior vena cava; cIVC, collapsibility index of IVC; SBP, Spontaneously Breathing Patients; VTIAo, velocity-time integral of aortic blood flow; SV, stroke volume; CO, cardiac output; CI: cardiac index.
Although the MAP (68±13 vs 75.05±14mmHg, p=0.09), the CO (6.3±2.3 vs 7.32±2.39L/min, p=0.35) and the cardiac index (CI) (3.45±1.2 vs 3.96±1.46L/min/m2, p=0.3) were not different between the groups.
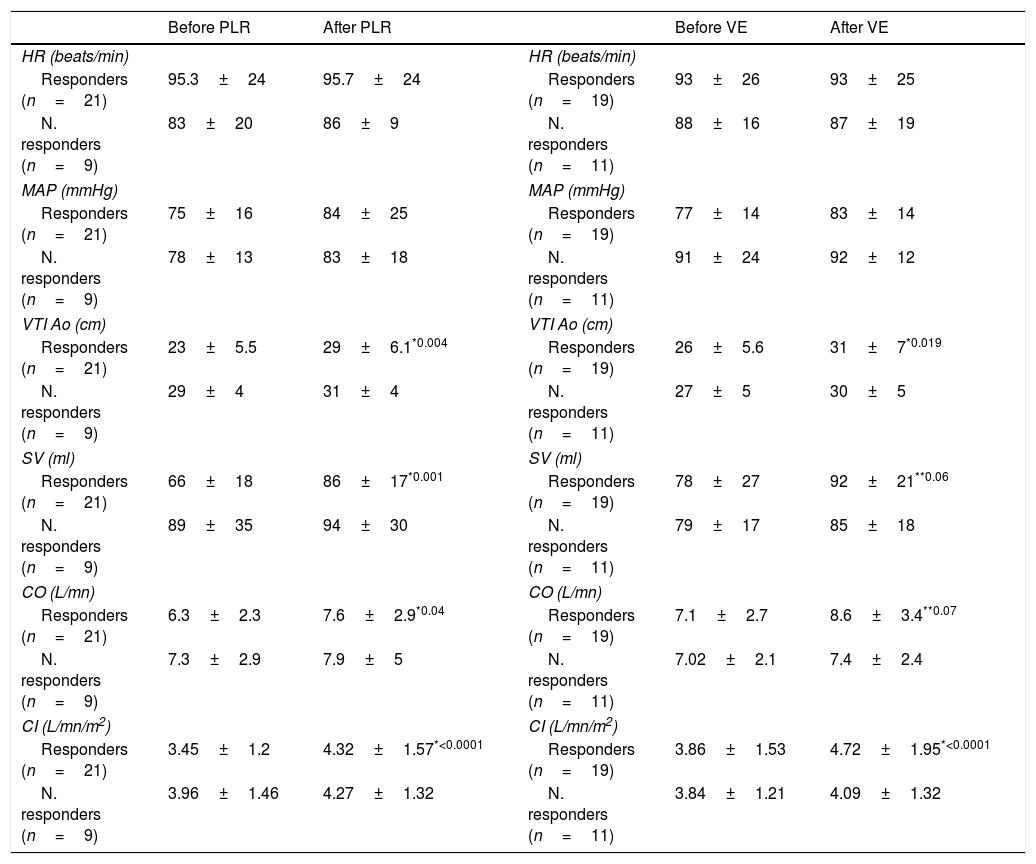
Effects of PLR and volume expansionThe hemodynamic readings taken throughout the four stages of measurements are summarized in Table 3.
Hemodynamic parameters taken throughout the four stages of measurement (results expressed in mean±SD).
| Before PLR | After PLR | Before VE | After VE | ||
|---|---|---|---|---|---|
| HR (beats/min) | HR (beats/min) | ||||
| Responders (n=21) | 95.3±24 | 95.7±24 | Responders (n=19) | 93±26 | 93±25 |
| N. responders (n=9) | 83±20 | 86±9 | N. responders (n=11) | 88±16 | 87±19 |
| MAP (mmHg) | MAP (mmHg) | ||||
| Responders (n=21) | 75±16 | 84±25 | Responders (n=19) | 77±14 | 83±14 |
| N. responders (n=9) | 78±13 | 83±18 | N. responders (n=11) | 91±24 | 92±12 |
| VTI Ao (cm) | VTI Ao (cm) | ||||
| Responders (n=21) | 23±5.5 | 29±6.1*0.004 | Responders (n=19) | 26±5.6 | 31±7*0.019 |
| N. responders (n=9) | 29±4 | 31±4 | N. responders (n=11) | 27±5 | 30±5 |
| SV (ml) | SV (ml) | ||||
| Responders (n=21) | 66±18 | 86±17*0.001 | Responders (n=19) | 78±27 | 92±21**0.06 |
| N. responders (n=9) | 89±35 | 94±30 | N. responders (n=11) | 79±17 | 85±18 |
| CO (L/mn) | CO (L/mn) | ||||
| Responders (n=21) | 6.3±2.3 | 7.6±2.9*0.04 | Responders (n=19) | 7.1±2.7 | 8.6±3.4**0.07 |
| N. responders (n=9) | 7.3±2.9 | 7.9±5 | N. responders (n=11) | 7.02±2.1 | 7.4±2.4 |
| CI (L/mn/m2) | CI (L/mn/m2) | ||||
| Responders (n=21) | 3.45±1.2 | 4.32±1.57*<0.0001 | Responders (n=19) | 3.86±1.53 | 4.72±1.95*<0.0001 |
| N. responders (n=9) | 3.96±1.46 | 4.27±1.32 | N. responders (n=11) | 3.84±1.21 | 4.09±1.32 |
PLR, passive leg raising; VE, volume expansion; HR, heart rate; MAP, mean arterial pressure; VTIAo, velocity-time integral of aortic blood flow; SV, stroke volume; CO, cardiac output; CI: cardiac index.
During the first step (PLR): there were 21 responders and 9 non-responders. For the responders (n=21), PLR induced a significant increase in VTI Ao (23±5.5cm vs 29±6.1, p=0.004), in SV (66±18ml vs 86±17ml, p=0.001), in CO (6.3±2.3L/min vs 7.6±2.9L/min, p=0.04) and in CI (3.45±1.2L/min/m2 vs 4.32±1.57L/min/m2, p<0.0001). Although, the heart rate and the MAP were unchanged after PLR in this same group (95.3±24beats/min vs 95.7±24beats/min, p=0.74) and (75±16mmHg vs 84±25mmHg, p=0.17) respectively. In the non-responders (n=9), PLR did not induce a significant change in any of the hemodynamic values measured.
During the second step (VE): there were 19 responders and 11 non-responders. For the responders group (n=19), VE induced a significant increase in VTI Ao (26±5.6cm vs 31±7, p=0.019) and in CI (3.86±1.53L/min/m2 vs 4.72±1.95L/min/m2, p=0.001). No significant increase in SV (78±27ml vs 92±21ml, p=0.06) nor in CO (7.1±2.7L/min vs 8.6±3.4L/min, p=0.07) was revealed. Any changes were showed with HR and MAP. For the non-responders, all the parameters were unchanged before or after VE (Table 3).
Relationship between changes in SV induced by PLR and VEThe proportional changes in SV induced by VE were correlated positively with the proportional changes in SV induced by PLR (Rho score=0.77, p<0.0001), with a linear correlation equation calculated at y=0.82 x+1.68 (Fig. 2).

A correlation study between the SV variations induced by PLR and SV variations induced by VE was performed separately: in ventilated patients (n=23) versus in SBP (n=7). Correlation was found to be better in ventilated patients (Spearman coefficient: 0.836 and p<0.0001 versus 0.75 and p=0.052).
Ability of PLR maneuver to predict fluid responsivenessThe area under the ROC curve for the percent change in SV during PLR predicting a response to VE was 0.84±0.04. A SV increase induced by PLR of 15% or more predicted volume response with a sensitivity of 94.7%, specificity of 72.7%, positive predictive value of 85.7%, and a negative predictive value of 88% (Fig. 3).
Discussion
Our study, in a relatively unselected population of medical ICU patients, demonstrates that non-invasive ultrasonic SV measurement coupled to PLR can predict the hemodynamic response to VE. The initial VTIAo and SV were significantly lower in responders. Of the same order, the distensibility index of IVC was widely upper than 15% and significantly higher in responders. In the responders group: VTIAo, SV and CO were significantly improved by the PLR maneuver. The same effect was observed in these later hemodynamic parameters after VE. The change in SV following VE correlated positively with changes in SV during PLR. Finally, an increase in SV induced by PLR with a cut-off of 15% had a significant ability for predicting response to fluid loading with a sensitivity of 94.7%, specificity of 72.7%, PPV of 85.7%, and NPV of 88%.
Evaluation and management of intravascular volume are a central challenge in caring for the critically ill patients. On the one hand, hemodynamically unstable patients, often require a volume expansion, in keeping with recommendations for treatment of many shock states.14 On the other hand, fluid overload may adversely affect the hemodynamic status. The static measures such as central venous pressure (CVP), pulmonary artery occlusion pressure (PAOP) and extravascular lung water (EVLW) were the first indices developed to assist with predicting volume responsiveness. While they reflect a patient's preload at some point on the Frank-Starling curve, it cannot demonstrate whether there is capacity to advance along the curve and optimize myocardial filament overlap.15
The changes in preload indices induced by intrathoracic pressure changes during mechanical ventilation were successfully assessed as predictors of volume responsiveness.15 Among the indices assessing the relationship between heart/lung interaction and fluid responsiveness, the changes in inferior vena cava diameter expressed as distensibility index of inferior vena cava (dIVC). The accuracy of dIVC in predicting fluid responsiveness has been proved among ventilated patients.16,17 While, in spontaneously breathing patients, the collapsibility of the IVC was assessed with favorable results.18,19 In our series, the dIVC in ventilated patients had higher accuracy than c IVC in unventilated patients for evaluating fluid responsiveness.
As underlined by several authors, dynamic criteria are better predictors of volume responsiveness than static criteria.20–22 In this way, PLR, which is a simple, dynamic and reversible maneuver, has been proposed by Boulain et al.23 to predict fluid responsiveness in mechanically ventilated patients. A strong correlation between SV variations induced by PLR and by VE, measured by TTE analysis of aortic blood flow, was previously reported by Lamia et al.24 and sustained by our results. Among several TTE markers assessed in this latter study, the SV variation induced by PLR was the better predictor of fluid responsiveness.24 Other studies in medical or surgical ICUs showed good sensitivity (77–100%) and specificity (88–99%) using a threshold of 10–15% increment of SV or CO.12,24–28
Our findings further suggest that the accuracy of this dynamic tool in predicting FR had higher accuracy for evaluating fluid responsiveness in ventilated patients than unventilated.
Our sensitivity (94.7%) is comparable with these studies, but our specificity (72.7%) is somewhat lower. Our high sensitivity with a good NPV allows us to assert that this test of SV increase by PLR is useful to exclude a benefit from fluid responsiveness when the SV increase is less than 15%. Our lower specificity may be the result of inclusion of patients regardless of underlying co-morbidities, mainly the cardiac and renal failure. As well as the respiratory support including ventilator setting variations (tidal volume: 6–8ml/kg and PEEP: 5–10cm H2O) may influence the effect of PLR in SV.24
Anyway, the analysis of aortic blood flow using TTE in order to evaluate change in SV or CO in response to PLR maneuver grow to be an inevitable practice in ICU patients. A panel of experts [from the Spanish Society of Intensive and Critical Care Medicine and Coronary Units (SEMICYUC)] worked for the standardization of the Intensive Care Medicine and elaborated a several recommendations, in order to improve the management of critically ill patient.29 For the hemodynamic monitoring, ultrasound was considered as a tool to improve patient care quality and safety.29 Indeed, ultrasound monitoring is useful in the diagnosis of shock, cardiorespiratory arrest or respiratory failure.29 This non-invasive device allows an optimization of clinical management, evaluation of response to given therapy, avoids iatrogenic and help to select who patient requiring an invasive monitoring.29
TTE techniques appear useful also, in patients with spontaneous respiratory effort and those with arrhythmias27 conversely to many of invasive monitoring techniques.30 In addition, much of the data derived from pulmonary artery catheter (PAC) can be obtained using TTE by avoiding the invasiveness and the rampant misinterpretation of data.31–33
Finally, the recent large review34 (50 studies, N=2260 patients) aiming to identify predictors of fluid responsiveness in hemodynamically unstable patients showed that the most useful test was the measurement of change in CO induced by PLR with (positive LR, 11 [95% CI, 7.6–17]; negative LR, 0.13 [95% CI, 0.07–0.22]). These results were similar during controlled ventilation or spontaneous breathing (positive LR=11 [95% CI, 6.3–21] vs 7.0 [95% CI, 3.8–13.1] and negative LR=0.08 [95% CI, 0.03–0.21] vs 0.22 [95% CI, 0.09–0.54]).
The weakness of our study is the small sample size and the unselected nature of the studied population. In this way, another study is being carried out to evaluate the performance of this technique to predict fluid responsiveness in patients with spontaneous breathing and with underlying cardiac disease versus those mechanically ventilated. Another limitation to note is the absence of more than one explorer who performed the TTE. That leads to a lack of a critical revision by other independent explores and therefore absence of a concordance test.
ConclusionOur findings strengthen further the hypothesis that volume expansion can be predicted by a simple non-invasive tool (ultrasound SV coupled with PLR) in patients presumed requiring volume expansion.
FundingThis research did not receive any specific grant from funding agencies in the public, commercial, or not-for-profit sectors.
Authors’ contributionsAT, SA and SBL designed the study. FD, RN and YT contributed to data collection. AT wrote the manuscript and performed the statistical analysis. SA and SBL participated in its critical revision. All authors read and approved the final manuscript.
Conflict of interestThe authors declare that they have no competing interests.

