

This study aims to evaluate the association of time‑weighted average mechanical power normalized to compliance (TWA-MPCRS) with all-cause mortality to determine its value as a prognostic tool in intensive care patients.
DesignRetrospective observational study.
SettingIntensive care unit (ICU).
Patients or participants4387 first-time ICU-admitted patients in the Medical Information Mart for Intensive Care (MIMIC) IV.
InterventionsNone.
Main variables of interestTWA-MPCRS, ICU mortality and in-hospital mortality.
ResultsParticipants' mean age was 61.4 ± 16.9 years and the median [IQR] baseline TWA-MPCRS was 0.3 (0.2, 0.6) J/min/mL/cmH2O. When TWA-MPCRS was divided into quintiles (with quintile 1 representing the lowest values), after adjusting for covariates, the odds ratios [95% confidence intervals (CIs)] for ICU mortality were 1.49 (95% CI: 1.15–1.94), 1.67 (95% CI: 1.29–2.16), 1.79 (95% CI: 1.37–2.33), and 3.96 (95% CI: 3.01–5.21) for quintiles 2, 3, 4, and 5 respectively, with quintile 1 as reference. Similar results were found for hospital mortality.
ConclusionHigher TWA-MPCRS is associated with poor clinical outcomes in critically ill patients. Higher TWA-MPCRS can lead to a higher mortality among ICU and in-hospital patients.
Este estudio tiene como objetivo evaluar la asociación entre la potencia mecánica promedio en el tiempo y normalizada por la complianza (TWA-MPCRS) y la mortalidad por todas las causas, con el fin de determinar su valor como herramienta pronóstica en pacientes de cuidados intensivos.
DiseñoEstudio observacional retrospectivo.
EntornoUnidad de Cuidados Intensivos (UCI).
Pacientes o participantes4387 pacientes ingresados por primera vez en la UCI, seleccionados de la base de datos Medical Information Mart for Intensive Care (MIMIC) IV.
IntervencionesNinguna.
Variables de interés principalesTWA-MPCRS, mortalidad en la UCI y mortalidad hospitalaria.
ResultadosLa edad promedio de los participantes fue de 61.4 ± 16.9años, y la mediana [IQR] de TWA-MPCRS basal fue de 0.3 (0.2, 0.6) J/min/mL/cmH2O. Cuando el TWA-MPCRS se dividió en quintiles (siendo el quintil 1 el de los valores más bajos), tras ajustar por covariables, las razones de odds [intervalos de confianza (IC) del 95%] para la mortalidad en UCI fueron 1.49 (IC 95%: 1.15–1.94), 1.67 (IC 95%: 1.29–2.16), 1.79 (IC 95%: 1.37–2.33) y 3.96 (IC 95%: 3.01–5.21) para los quintiles 2, 3, 4 y 5, respectivamente, teniendo el quintil 1 como referencia. Se encontraron resultados similares para la mortalidad hospitalaria.
ConclusiónUn TWA-MPCRS más alto se asocia con peores resultados clínicos en pacientes críticos. Un TWA-MPCRS más elevado puede conducir a una mayor mortalidad entre los pacientes en la UCI y en el hospital.
High-intensity mechanical ventilation in critically ill patients under general anesthesia or with respiratory failure increases the risk of ventilator-induced lung injury (VILI). VILI occurs when small airways and alveoli are repeatedly opened and closed, or become over-distended.1,2 Lung-protective ventilation is recommended in acute respiratory distress syndrome (ARDS) management to reduce VILI and improve mortality in acute respiratory failure patients.3–6 Previous studies have linked parameters such as end expiration pressure (PEEP) and driving pressure to poor outcomes in invasive ventilation,7–10 and factors like flow and breathing frequency also contribute to tissue injury. However, tidal volume (Vt) and end-expiratory lung impedance remain primary contributors to VILI-associated stress and strain.11 Mechanical power (MP)—which integrates Vt, driving pressure, airflow, and frequency—quantifies the work rate on the lungs and has been proposed as a predictor of VILI pathogenesis.4,12,13
Mechanical ventilation generates mechanical stress and strain within the respiratory system. The magnitude of this load, known as the intensity of ventilation, can be quantified by MP, which is independently associated with mortality in both Intensive care unit (ICU) and ARDS patients.14–16 Importantly, the risk of VILI at a given MP depends on factors such as lung size, recruitability, and homogeneity,11,17,18 often referred to as the “baby lung” concept.19,20 Therefore, adjusting MP by normalizing it to compliance of respiratory system (MPCRS) accounts for functional lung size and may improve prognostic accuracy in ARDS patients, as recently demonstrated.20,21 However, it remains unclear whether MPCRS predicts outcomes across all mechanically ventilated ICU patients, as relatively few studies have explored this. This study thus aims to evaluate the association of time-weighted average MPCRS (TWA-MPCRS) with all-cause mortality to assess its prognostic value in the intensive care setting.
MethodsData sourceThe data used in this retrospective cohort study was obtained from the Medical Information Mart for Intensive Care (MIMIC)-IV (2.0). This database contains clinical data for patients hospitalized at the Beth Israel Deaconess Medical Center from 2008 to 2019. To access pertinent data from MIMIC-IV, our team successfully completed the Protecting Human Research Participants test and the National Institutes of Health training course and the accompanying exams (certification number: 44545022/39719844). The guidelines for “Strengthening the Reporting of Observational Studies in Epidemiology” were used to report the findings in this article.22
Study populationPatients listed in the MIMIC IV database who underwent invasive mechanical ventilation were eligible for inclusion in this study. The inclusion criteria were as follows: (1) receipt of invasive ventilation initiated within 24 h of ICU admission; (2) patients receiving invasive ventilation for at least 48 consecutive hours; (3) patients aged ≥18 years; and (4) only the first ICU admission was considered.14 The exclusion criteria were as follows: Patients for missing ventilation variables associated to MPCRS. The percentage of missing values for all participants is summarized in Supplementary Table 1. To impute the missing values, a multivariate imputation approach using chained equations was employed, assuming that the missingness was random.
Date extractionThe data were extracted using Structured Query Language (SQL) and PostgreSQL (version 9.6). Key demographic data were collected (within 24 h of admission), including age, gender, race (white, black or other), Body mass index (BMI), simplified acute physiology II (SAPS II) score, and sequential organ failure assessment (SOFA) score. Predicted body weight (PBW) was calculated as follows: 50 + 0.91 × [height (cm) − 152.4] (for male); 45.5 + 0.91 × [height (cm) −152.4] (for female). On the first day of ICU admission, the average values of vital signs and laboratory parameters were recorded. Intervention measures within 24 h of ICU admission, including vasoactive drug administration, renal replacement therapy (RRT) and fluid balance. The time and value of ventilation parameters on the second day of mechanical ventilation, including Vt, PEEP, peak inspiratory pressure (Ppeak), total respiratory rate, and fraction of inspired oxygen (FiO₂), were extracted for further calculation. Invasive ventilation data at all time points were collected from the database (typically every 4 h, which may vary depending on the individual condition), thus allowing us to calculate the corresponding dynamic MP and its associated exposure duration (until the next recorded time point).
The reason we analyzed ventilation parameters from the second 24-h period is that, during the initial phase—particularly the first 24 h—patients commonly undergo rapid changes in respiratory parameters,23 treatment strategies, and organ function. This period often reflects acute stress responses and temporary interventions, requiring time for patients to adapt to ventilator settings.24 In contrast, the 24–48 h window is more likely to provide ventilation parameters that represent a near-steady state, allowing for a more accurate assessment of ventilator-induced lung stress and injury risk. Previous studies have also identified the second day as a key time point at which MP can serve as a valuable predictor of patient outcomes.14,25,26
Study endpoint and calculationsThe primary outcome was ICU, while secondary outcome was in-hospital mortality. MP was estimated as follows:
Since ventilation is a dynamic process, we calculated the time-weighted average MP (TWA-MP) and TWA-MPCRS over the second 24 h of ventilation. For each patient, the multiplicative product of the MPCRS and the duration of exposure to that MPCRS were obtained. The products were summed up and divided by the total duration of ventilation observation time to obtain the TWA-MPCRS, using the following equation:
The ith MPCRS measurement was recorded as MPCRS i, the time interval between the ith and the i + 1th MPCRS measurement was recorded as ΔTi. TWA-MP was calculated using the same method as TWA-MPCRS.
Statistical analysisBefore performing statistical analysis, the missing values for other variables were first supplemented. Patient characteristics were analyzed in the groups based on MPCRS quartiles. Categorical variables were described using frequency and percentages, whereas continuous variables were described using median with quartile range (IQR) for skewed distributions and mean with standard deviation (SD) for normally distributed data. Chi-square, one-way analysis of variance, or Kruskal-Wallis tests, as appropriate, was applied to the continuous variables of classification, normal distribution, and non-normal distribution. To study the association between the TWA-MPCRS and ICU or in-hospital mortality, both univariable linear regression and multivariate logistic regression analyses were conducted. We developed three models: the model 1(with no covariates adjusted), model 2 (with age, gender and BMI adjusted); and model 3 (model 2 with additional covariates). To assess potential confounders, we entered the covariates one by one into the subsequent binary logistic regression model and eliminated them from the complete model. Covariates that were associated with clinical prognosis or whose initial regression coefficient changed by more than 10% were chosen as confounders. To avoid overfitting the model due to multicollinearity among variables, a variance inflation factor (VIF) was calculated as well. Variables with VIF ≥ 5 were excluded (Supplementary Table 2).
We flexitively modeled and visualized the association between TWA-MPCRS and ICU and in-hospital mortality using restricted cubic splines. Based on the quintiles, TWA-MPCRS was first converted into a categorical variable. The resulting P value was used to explore a nonlinear pattern of association. The TWA-MPCRS, as a continuous variable, was then used to test the linear trend. In addition, receiver operating characteristic (ROC) analysis was performed to compare the predictive power of SOFA score, TWA-MP, and TWA-MPCRS for ICU mortality. The model’s performance was evaluated using calibration plots and the Hosmer-Lemeshow goodness-of-fit test (with P > .05 indicating satisfactory calibration).
For sensitivity analysis, interaction and stratified analyses were conducted based on age, gender, BMI, ventilation parameter (PEEP, Ppeak, Vt and compliance), disease severity score (SAPSII score and SOFA score), and comorbidities [Congestive heart failure, chronic obstructive pulmonary disease (COPD) and ARDS]. We also conducted sensitivity analyses restricted to survivors for both hospital length of stay and ICU length of stay. In addition, we used complete data to determine whether sensitivity analysis was stable compared with the results of raw data analysis. All data were analyzed using R 4.1.2 (R Foundation) 1 and Free Statistics version 1.9, with P < .05 as the significance level.
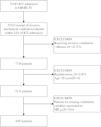
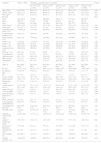
ResultsBaseline characteristics of patientsFig. 1 shows a flowchart depicting the study process. Based on the inclusion/exclusion criteria, a total of 4387 eligible patients, with a mean age of 61.4 ± 16.9 years, were enrolled, comprising 2531 men (57.7%) and 1856 women. The median [IQR] baseline TWA-MPCRS was 0.3 (0.2, 0.6) J/min/mL/cmH2O. The population characteristics by TWA-MPCRS quintile are provided in Table 1. Participants, who received a higher level of TWA-MPCRS, presented with a higher level of BMI, SAPS II values, SOFA values, heart rate, arterial partial pressure of carbon dioxide (PaCO2), lactate and fluid balance but had lower age, mean arterial blood pressure (MAP), pulse oxygen saturation (SpO2), PH, arterial partial pressure of oxygen (PaO2), bicarbonate and PaO2/FiO2 ratio (PF ratio). It was also found that congestive heart failure, cerebrovascular disease, COPD, and sepsis significantly differed between the stratified groups. Additionally, patients in the high TWA-MPCRS group had higher rates of vasoactive drugs and RRT, as well as higher fluid balance than patients in the low TWA-MPCRS group. With an increase in TWA-MPCRS, there was an increase in PEEP, dynamic driving pressure, Ppeak, total respiratory rate, FiO2 and TWA-MP (Table 1).

Baseline characteristics and clinical outcomes of the included patients.
| Variables | Total (n = 4387) | TWA-MPCRS quintiles (J/min/mL/cmH2O) | P value | ||||
|---|---|---|---|---|---|---|---|
| Q1 (0.01−0.14) (n = 878) | Q2 (0.14−0.27) (n = 877) | Q3 (0.27−0.41) (n = 877) | Q4 (0.41−0.67) (n = 877) | Q5 (0.67−1.49) (n = 878) | |||
| Age, (years) | 61.4 ± 16.9 | 63.6 ± 15.7 | 62.9 ± 17.1 | 62.0 ± 17.8 | 60.9 ± 17.2 | 57.6 ± 16.1 | <.001 |
| Gender, (male) | 2531 (57.7) | 504 (57.4) | 502 (57.2) | 487 (55.5) | 517 (59) | 521 (59.3) | .504 |
| BMI, (kg/m2) | 29.7 ± 8.5 | 27.9 ± 6.8 | 28.0 ± 7.7 | 29.1 ± 7.3 | 30.4 ± 7.9 | 33.1 ± 10.8 | <.001 |
| Ethnicity | .543 | ||||||
| White | 2321 (52.9) | 474 (54) | 459 (52.3) | 448 (51.1) | 477 (54.4) | 463 (52.7) | |
| Black | 328 (7.5) | 57 (6.5) | 77 (8.8) | 66 (7.5) | 69 (7.9) | 59 (6.7) | |
| Other | 1738 (39.6) | 347 (39.5) | 341 (38.9) | 363 (41.4) | 331 (37.7) | 356 (40.5) | |
| SAPS II score | 45.5 ± 15.6 | 41.7 ± 14.5 | 43.5 ± 15.0 | 45.6 ± 15.3 | 46.3 ± 15.6 | 50.4 ± 16.2 | <.001 |
| SOFA score | 9.3 ± 4.3 | 7.8 ± 4.0 | 8.1 ± 4.0 | 9.0 ± 4.0 | 9.9 ± 4.0 | 11.6 ± 4.2 | <.001 |
| Congestive heart failure, n (%) | 1136 (25.9) | 172 (19.6) | 226 (25.8) | 245 (27.9) | 258 (29.4) | 235 (26.8) | <.001 |
| Cerebrovascular disease, n (%) | 934 (21.3) | 138 (15.7) | 193 (22) | 215 (24.5) | 207 (23.6) | 181 (20.6) | <.001 |
| Renal_disease, n (%) | 802 (18.3) | 146 (16.6) | 162 (18.5) | 164 (18.7) | 176 (20.1) | 154 (17.5) | .416 |
| COPD, n (%) | 710 (16.2) | 112 (12.8) | 111 (12.7) | 127 (14.5) | 163 (18.6) | 197 (22.4) | <.001 |
| ARDS, n (%) | 903 (20.6) | 93 (10.6) | 131 (14.9) | 165 (18.8) | 211 (24.1) | 303 (34.5) | <.001 |
| Sepsis, n (%) | 3974 (90.6) | 760 (86.6) | 762 (86.9) | 785 (89.5) | 812 (92.6) | 855 (97.4) | <.001 |
| Vasopressor use, n (%) | 2650 (60.4) | 396 (45.1) | 467 (53.2) | 527 (60.1) | 592 (67.5) | 668 (76.1) | <.001 |
| RRT use, n (%) | 346 (7.9) | 37 (4.2) | 53 (6) | 61 (7) | 75 (8.6) | 120 (13.7) | <.001 |
| Fluid balance(L) | 4.4 ± 5.5 | 3.2 ± 4.2 | 3.5 ± 4.7 | 3.9 ± 5.6 | 5.0 ± 5.8 | 6.5 ± 6.3 | <.001 |
| Heart rate, (bpm) | 88.1 ± 17.5 | 85.6 ± 16.2 | 85.8 ± 16.3 | 86.5 ± 17.8 | 88.2 ± 17.0 | 94.2 ± 18.7 | <.001 |
| MAP, (mmHg) | 77.4 ± 9.7 | 78.5 ± 9.7 | 78.4 ± 10.1 | 77.5 ± 9.4 | 76.6 ± 9.4 | 76.0 ± 9.5 | <.001 |
| Temperature, °C | 37.0 ± 0.8 | 37.1 ± 0.6 | 37.0 ± 0.7 | 36.9 ± 0.8 | 36.9 ± 0.9 | 36.9 ± 1.0 | <.001 |
| SpO2, % | 98.0 (96.4, 99.2) | 98.7 (97.5, 99.5) | 98.6 (97.0, 99.5) | 98.2 (96.8, 99.4) | 97.6 (96.3, 98.8) | 96.5 (94.8, 98.2) | <.001 |
| PF ratio | 257.3 ± 112.6 | 297.5 ± 117.9 | 288.1 ± 117.8 | 268.8 ± 106.7 | 236.4 ± 99.8 | 195.6 ± 85.8 | <.001 |
| Hemoglobin, (g/L) | 10.9 ± 2.5 | 10.9 ± 2.3 | 10.9 ± 2.4 | 10.8 ± 2.4 | 10.9 ± 2.4 | 11.1 ± 2.7 | .098 |
| pH | 7.3 ± 0.1 | 7.4 ± 0.1 | 7.4 ± 0.1 | 7.3 ± 0.1 | 7.3 ± 0.1 | 7.3 ± 0.1 | <.001 |
| PaCO2, (mmHg) | 44.1 ± 14.0 | 40.1 ± 10.3 | 42.0 ± 11.9 | 42.8 ± 12.8 | 45.4 ± 13.9 | 50.1 ± 17.7 | <.001 |
| PaO2, (mmHg) | 153.7 ± 117.1 | 157.7 ± 111.0 | 163.9 ± 121.6 | 158.4 ± 123.0 | 155.0 ± 121.4 | 133.7 ± 105.4 | <.001 |
| Bicarbonate, (mmol/L) | 21.7 ± 5.3 | 21.5 ± 4.4 | 22.2 ± 5.0 | 21.8 ± 5.0 | 21.8 ± 5.9 | 21.3 ± 5.8 | .006 |
| Lactate (mmol/L) | 2.0 (1.3, 3.4) | 1.7 (1.2, 2.7) | 1.9 (1.3, 3.1) | 2.0 (1.3, 3.4) | 2.1 (1.4, 3.9) | 2.3 (1.4, 4.3) | <.001 |
| FiO2, % | 35.1 ± 14.8 | 32.6 ± 11.6 | 33.4 ± 12.3 | 33.4 ± 13.5 | 35.6 ± 14.9 | 40.7 ± 19.1 | <.001 |
| Ppeak (cm H2O) | 21.2 ± 7.1 | 12.5 ± 2.1 | 17.1 ± 2.5 | 20.6 ± 2.6 | 24.6 ± 2.8 | 31.2 ± 4.6 | <.001 |
| Vt (mL/kg PBW) | 7.8 ± 3.7 | 8.9 ± 5.6 | 7.8 ± 5.1 | 7.6 ± 2.2 | 7.4 ± 1.6 | 7.2 ± 1.4 | <.001 |
| Dynamic driving pressure (cm H2O) | 13.6 ± 5.4 | 7.0 ± 1.7 | 10.8 ± 2.3 | 13.9 ± 2.7 | 16.4 ± 3.1 | 20.0 ± 4.5 | <.001 |
| PEEP, (cm H2O) | 7.6 ± 3.6 | 5.5 ± 1.3 | 6.3 ± 2.3 | 6.7 ± 2.5 | 8.3 ± 3.2 | 11.3 ± 4.6 | <.001 |
| Total respiratory rate(breaths/min) | 20.4 ± 5.5 | 16.8 ± 4.7 | 18.4 ± 4.3 | 19.6 ± 4.4 | 21.2 ± 4.3 | 25.9 ± 5.1 | <.001 |
| Lung compliance (mL/H2O) | 34.9 (26.8, 54.3) | 77.9 (63.6, 97.3) | 45.5 (37.3, 57.1) | 33.2 (29.1, 40.0) | 28.9 (24.7, 33.9) | 23.5 (19.7, 28.0) | <.001 |
| TWA-MP (J/min) | 11.9 (8.4, 17.2) | 7.0 (5.8, 8.7) | 9.0 (7.6, 11.4) | 11.2 (9.7, 13.3) | 15.0 (12.8, 18.0) | 22.9 (18.5, 28.7) | <.001 |
| TWA-MPCRS (J/min/mL/cm H2O) | 0.3 (0.2, 0.6) | 0.1 (0.1, 0.1) | 0.2 (0.2, 0.2) | 0.3 (0.3, 0.4) | 0.5 (0.5, 0.6) | 0.9 (0.8, 1.2) | <.001 |
| Length of hospital stay (days) | 18.3 ± 15.8 | 19.2 ± 17.5 | 18.1 ± 13.9 | 17.4 ± 15.0 | 18.3 ± 15.3 | 18.5 ± 16.9 | .209 |
| Length of ICU stay (days) | 10.6 ± 8.6 | 9.5 ± 7.2 | 9.9 ± 7.8 | 10.2 ± 8.6 | 11.0 ± 8.5 | 12.5 ± 10.4 | <.001 |
| Ventilator-free days | 2.0 ± 2.9 | 2.2 ± 3.2 | 2.1 ± 2.8 | 2.0 ± 3.1 | 1.8 ± 2.5 | 1.7 ± 2.9 | .003 |
| ICU mortality, n (%) | 1015 (23.1) | 124 (14.1) | 176 (20.1) | 197 (22.5) | 198 (22.6) | 320 (36.4) | <.001 |
| Hospital mortality, n (%) | 1292 (29.5) | 199 (22.7) | 243 (27.7) | 245 (27.9) | 248 (28.3) | 357 (40.7) | <.001 |
For skewed variables, the data were presented as mean ± SD or median (IQR), and for categorical variables, as numbers (proportions). SAPSII, Simplified acute physiology score II; SOFA, Sequential Organ Failure Assessment; RRT, renal replacement therapy; ARDS, acute respiratory distress syndrome; COPD, chronic obstructive pulmonary disease; bpm, beats per minute; MAP, mean arterial blood pressure; SpO2, pulse oxygen saturation; PaCO2, arterial partial pressure of carbon dioxide; PaO2, arterial partial pressure of oxygen; Ppeak, peak inspiratory pressure; Vt, tidal volume; PEEP, positive end-expiratory pressure; PF ratio, PaO2/FiO2 ratio; MP, mechanical power; CRS, compliance of respiratory system.
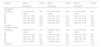
Compared to patients with lower TWA-MPCRS, those with higher TWA-MPCRS experienced fewer ventilator-free days, longer ICU stays, higher ICU mortality, and increased hospital mortality rates (Table1). The results of univariate analysis of variables and ICU and in hospital mortality are shown in Supplemental Tables 3–4. Further, we used multivariable logistic regression analyses to assess the association of TWA-MPCRS with all-cause ICU and in-hospital mortality in critically ill patients requiring mechanical ventilation (Table 2). After adjusting for age/gender/BMI (model 2), we found that TWA-MPCRS was significantly associated with a higher risk of ICU mortality (OR, 4.27; 95% CI, 3.46∼5.26; P < .001). Notably, even after adjusting for all potential covariates (model 3), this association remained strong with TWA-MPCRS as a continuous variable (OR, 4.10; 95%CI, 3.19∼5.26; P < .001; Table 2). A similar trend was observed for in-hospital mortality (Table 2). After adjusting for ICU mortality, ORs, in Q2, Q3, Q4 and Q5 based on TWA-MPCRS quintile, with quintile 1 as reference, were 1.49 (95% CI: 1.15∼1.94), 1.697 (95% CI: 1.29∼2.16), 1.79 (95% CI: 1.37∼2.33), and 3.96 (95% CI: 3.01∼5.21), respectively, in model 3. Similarly, after adjusting for in-hospital mortality, using quintile 1 as a reference, the adjusted ORs in Q2, Q3, Q4 and Q5 were 1.28 (95%CI: 1.04−1.63), 1.28 (95%CI: 1.02∼1.61), 1.42 (95%CI: 1.12∼1.79), and 2.88 (95%CI: 2.25∼3.70), respectively, in model 3. Notably, these TWA-MPCRS trends were statistically significant in all models (Table 2, P < .001).
Multivariable logistic regression analyses of TWA-MPCRS and ICU and in-hospital mortality.
| Variable | Model 1 | P value | Model 2 | P value | Model 3 | P value |
|---|---|---|---|---|---|---|
| OR (95%CI) | OR (95%CI) | OR (95%CI) | ||||
| ICU Mortality | ||||||
| TWA-MPCRS | 3.14 (2.58∼3.81) | <.001 | 4.27 (3.46∼5.26) | <.001 | 4.1 (3.19∼5.26) | <.001 |
| Q1 | 1 (Ref) | 1 (Ref) | 1 (Ref) | |||
| Q2 | 1.53 (1.19∼1.96) | <.001 | 1.56 (1.21∼1.2.01) | .001 | 1.49 (1.15∼1.94) | .003 |
| Q3 | 1.76 (1.38∼2.26) | <.001 | 1.87 (1.45∼2.4) | <.001 | 1.67 (1.29∼2.16) | .001 |
| Q4 | 1.77 (1.38∼2.27) | <.001 | 1.98 (1.54∼2.55) | <.001 | 1.79 (1.37∼2.33) | <.001 |
| Q5 | 3.49 (2.76∼4.41) | <.001 | 4.50 (3.52∼5.74) | <.001 | 3.96 (3.01∼5.21) | <.001 |
| Trend.test | <.001 | <.001 | <.001 | |||
| In-hospital Mortality | ||||||
| TWA-MPCRS | 2.26 (1.88∼2.71) | <.001 | 3.24 (2.65∼3.95) | <.001 | 3.15 (2.48∼4.00) | <.001 |
| Q1 | 1 (Ref) | 1 (Ref) | 1 (Ref) | |||
| Q2 | 1.31 (1.05∼1.62) | .015 | 1.34 (1.08∼1.68) | .035 | 1.28 (1.04∼1.63) | .023 |
| Q3 | 1.32 (1.07∼1.64) | .011 | 1.42 (1.14∼1.77) | .043 | 1.28 (1.02∼1.61) | .034 |
| Q4 | 1.35 (1.08∼1.67) | .007 | 1.54 (1.23∼1.92) | .013 | 1.42 (1.12∼1.79) | .004 |
| Q5 | 2.34 (1.9∼2.88) | <.001 | 3.18 (2.56∼3.96) | <.001 | 2.88 (2.25∼3.7) | <.001 |
| Trend.test | <.001 | <.001 | <.001 |
Model 1: adjusted for nothing.
Model 2: adjusted for age, gender, BMI.
Model 3: adjusted for age, gender, BMI, SAPS II score, SOFA score, MAP, heart rate, lactate fluid balance, bicarbonate, PH, PaCO2, PF ratio, FiO2 and SpO2.
OR, odds ratio; CI, confidence interval; BMI, Body mass index; MAP, mean arterial blood pressure; PaCO2, arterial partial pressure of carbon dioxide; PF ratio, PaO2/FiO2 ratio; SpO2, pulse oxygen saturation.
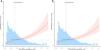
The association between TWA-MPCRS and mortality among mechanically ventilated patients was further explored using restricted cubic splines plots of TWA-MPCRS against the ICU and hospital mortality rates (Fig. 2). After adjusting for all covariates, we found that TWA-MPCRS had a continuous linear association with both ICU mortality (Fig. 2A) and in-hospital mortality (Fig. 2B). This result was in line with the incremental changes in OR obtained in further multivariable logistic regression.
Analysis of receiver operating characteristics
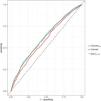
Respective ROC curves were constructed to further analyze the predictive significance of TWA-MPCRS, TWA-MP, and SOFA scores on ICU mortality in critically ill patients (Fig. 3). The results showed that the area under the curve (AUC) (95% CI) of TWA-MPCRS, TWA-MP, and SOFA scores were 0.613 (0.592, 0.633), 0.585 (0.565, 0.605) and 0.612 (0.572, 0.615), respectively. The AUC of TWA-MPCRS was significantly better than that of TWA-MP (P < .001) and comparable to SOFA scores (P = .915) (Supplemental Table 5). The results of calibration plots and the Hosmer-Lemeshow goodness-of-fit test demonstrated good model fit, (χ2 = 14.16, P = .078) with high consistency between the predicted and observed probabilities of mortality risk (Supplementary Fig. 1).
Subgroup analyses and sensitivity analysis
We further conducted interaction analyses and stratified analyses to determine the relationship between TWA-MPCRS and ICU mortality. As depicted in Fig. 4, in the adjusted Model3, the results demonstrated that an increase in TWA-MPCRS levels related to higher ICU mortality among various patient subgroups. In addition, there were no significant interaction between patient and clinical characteristics, including age, gender, BMI, ventilation parameter (PEEP, Ppeak, Vt and lung compliance), disease severity score (SAPSII and SOFA), and comorbidities (congestive heart failure, COPD and ARDS) and ICU mortality. A similar outcome was observed for in-hospital mortality, as shown in Fig. 4.

Effect size of TWA-MPCRS on ICU mortality and in-hospital mortality in pre-specified and exploratory subgroups.
Multivariable logistic regression analysis in subgroups adjusted the same covariates as for Model 3 in Table 2. BMI, Body mass index; SAPSII, Simplified acute physiology score II; SOFA, Sequential organ failure assessment; Vt, tidal volume; PEEP, positive end-expiratory pressure; Ppeak, peak inspiratory pressure; PBW, predicted body weight; COPD, Chronic obstructive pulmonary disease; ARDS, acute respiratory distress syndrome.
Sensitivity analyses restricted to survivors were performed for both hospital and ICU length of stay (Supplementary Tables 6–7). These analyses showed that the association between TWA-MPCRS and ICU/hospital length of stay remained significant among survivors. In addition, a sensitivity analysis without missing values verified the robustness of the results, showing a strong link between TWA-MPCRS and clinical outcomes (Supplementary Table 8).
DiscussionIn this retrospective cohort analysis, we confirmed that TWA-MPCRS is independently associated with ICU and in-hospital mortality in patients under invasive ventilation. The TWA-MPCRS during the second 24 h was associated with a linear positive relationship with mortality risk in patients with ventilation exceeding 48 h. The association was strong and unaffected by key covariables and confounding variables. Furthermore, our results demonstrate that the TWA-MPCRS is a superior predictor of outcomes in comparison to TWA-MP alone. To our knowledge, this is the first study to examine the prognostic value of TWA-MPCRS in critically ill patients with mechanical ventilation.
Previous studies have shown that MP is associated with poorer outcomes in critically ill patients ventilated for more than 48 h.14 However, MP does not account for the heterogeneous distribution of lung energy load, and the same MP may cause more severe VILI when aerated lung volume is reduced or pulmonary heterogeneity is increased.30 The effects of MP also vary based on lung pathophysiology, such as function, recruitability, and heterogeneity. Evidence further suggests that lung size and its heterogeneity can influence the impact of MP on VILI in patients with acute respiratory failure. Therefore, to more accurately predict VILI risk, specific power—the energy delivered per unit of ventilated lung tissue19,31,32—should be considered by normalizing MP to lung volume, thus better representing the actual energy burden delivered to the lung.18,30,33
ARDS patients often exhibit variability and significantly reduced lung size (“baby lungs”),34,35 with respiratory compliance reflecting the amount of functional lung tissue.19,31,36 MPCRS is more appropriate than normalization by body weight, as lung size is more influenced by disease severity.28,35,37 Zhang et al.38 found that MPCRS had the highest ability to predict mortality in ARDS. Similarly. Similarly, Coppola et al.20 reported that while MP had no causal association with mortality, MPCRS was independently linked to ICU mortality. Further, in severe ARDS patients receiving extracorporeal membrane oxygenation, MPCRS demonstrated better predictive power for 90-day mortality than either MP alone or MP normalized to predicted body weight.21 However, whether these findings apply broadly to all mechanically ventilated patients remains unclear. In our study, we initially examined the association between TWA-MPCRS quintiles and key clinical parameters, including SOFA scores, oxygenation index, lactate levels, as well as ICU and in-hospital mortality, in mechanically ventilated patients. The analysis revealed that a higher TWA-MPCRS was significantly associated with increased disease severity, as demonstrated by elevated SOFA scores and lactate levels, reduced oxygenation index, and higher ICU and in-hospital mortality rates. While TWA-MPCRS, like MP, does not directly cause lung injury or death, it serves as a reflection of the intensity of mechanical ventilation.15 Elevated TWA-MPCRS values are often linked to more severe underlying disease or greater respiratory dysfunction, indicating a need for higher levels of ventilatory support. Consequently, TWA-MPCRS may hold significant prognostic value in mechanically ventilated patients and can assist in identifying those at greatest risk of adverse outcomes. Importantly, the study identified a continuous linear relationship between TWA-MPCRS and mortality in mechanically ventilated patients. After adjusting for confounding variables, multivariate regression analysis confirmed TWA-MPCRS as an independent risk factor for both ICU and in-hospital mortality. These findings suggest that TWA-MPCRS may serve as a valuable stratification marker for recognizing high-risk patients, supporting clinical decision-making by prioritizing more intensive monitoring and therapeutic interventions for those with the most severe conditions.
Moreover, we determined that the AUC of TWA-MPCRS was similar to that of SOFA score, but superior to TWA-MP alone, which is in agreement with previous research on ARDS.38 Compared to TWA-MP, TWA-MPCRS more accurately predicts ICU mortality by capturing the true mechanical power delivered to the lungs. Unlike broader scores such as SOFA, TWA-MPCRS offers a focused physiologic measure of ventilatory intensity and VILI risk. Automated calculation by ventilators or workflow integration could enhance bedside use. While SOFA remains valuable for overall organ dysfunction, TWA-MPCRS adds insight into ventilatory mechanics, helping identify high-risk patients needing closer monitoring. However, the AUC value of TWA-MPCRS indicates only a moderate discriminatory ability, which may reflect the inherent limitations of being a unidimensional metric. The heterogeneity of mechanically ventilated populations (e.g., ARDS, neurological injury, COPD) leads to variability in the mortality risk thresholds associated with MP.39,40 MP may be more strongly associated with mortality in certain subgroups but less predictive of risk in others, diluting its discriminative power when applied to the overall ICU population. Integrating TWA-MPCRS with other clinical predictors, employing stratified modeling techniques, and leveraging advanced machine learning methods could potentially enhance its discriminatory performance. Additionally, MP has limitations in assessing and quantifying VILI and the severity of lung injury. For instance, the energy required to overcome airway resistance does not necessarily lead to VILI.41 Future research in mechanically ventilated patients might explore normalizing specific components of MP, such as elastic power,42 which could have the potential to improve its prognostic predictive value. Further investigations are needed to address these challenges and enhance the utility of TWA-MPCRS in guiding ICU management decisions.
No single component of MP was found to significantly contribute to overall MP.11 Although our subgroup analyses based on PEEP, Vt, Ppeak, and lung compliance showed consistent associations between TWA-MPCRS and increased ICU and hospital mortality, the complex interactions among these variables make it difficult to clarify the specific roles of individual components in VILI. Further research is needed to address this. In addition, our analysis confirms that patients with the highest BMI have correspondingly higher TWA-MPCRS, similar to the findings of González et al., which associate this with reduced chest wall compliance in obesity and the need for higher PEEP to counterbalance the weight load.43 However, further stratified analysis reveals that BMI does not influence the relationship between TWA-MPCRS and mortality. Moreover, no significant interactions were observed for variables such as age, gender, congestive heart failure, COPD or ARDS when patients were stratified according to potential confounding factors. This suggests that the relationship between TWA-MPCRS and mortality is consistent and independent of these variables, supporting the broader applicability of TWA-MPCRS as a metric for evaluating ventilation dynamics and their association with outcomes in diverse ICU patients. Specifically, in non-ARDS patients, factors such as chest wall compliance, hyperinflation (in COPD), or fluid overload (in congestive heart failure) can alter respiratory mechanics, yet TWA-MPCRS appears to remain a robust indicator of prognosis. Its ability to integrate various components of mechanical ventilation makes it a reliable measure of ventilation-associated stress and strain on the respiratory system, even under differing underlying conditions. Further studies are warranted to explore its utility in guiding ventilatory strategies tailored to heterogeneous patient groups.
Static parameters based on plateau pressure were not used in this study because plateau pressure is often not routinely measured in clinical practice, especially without adequate sedation or standardized inspiratory pauses. This limits data accuracy in large databases like MIMIC-IV. Additionally, plateau pressure may underestimate the maximal pressure experienced by vulnerable lung units during dynamic inflation.44 Therefore, we relied on real-time, automatically recorded Ppeak and PEEP to calculate dynamic driving pressure and dynamic MP.27,45 These dynamic parameters offer the advantage of being automatically displayed by the ventilator with each breath, facilitating continuous monitoring of physiological changes and remaining independent of ventilation mode.27,46,47 Numerous studies have also supported the reliability of these dynamic indices as substitutes for static measurements, and evidence shows that elevated dynamic MP is significantly associated with increased 30-day mortality in patients with acute respiratory failure27,46 and a higher risk of postoperative pulmonary complications,47 regardless of ventilation mode. The use of dynamic MP overcomes the limitations of static measurements and provides a more universal and clinically valuable method for assessing VILI risk and enabling early intervention.
This study has several limitations. First, the conclusions can only be applied to patients who have been ventilated longer than 48 h. Second, we did not account for patients’ sedation status or restrict analysis to a single ventilation modality; patients under various ventilatory modes were included, and sedation was not uniformly documented. As MP may vary across different ventilation modes,48 this heterogeneity may affect the accuracy and interpretation of MP values, especially since the MP formula has not been fully validated for all ventilation modes. These methodological limitations may impact the generalizability of our findings. This limitation should be taken into account when interpreting our results, and future prospective studies should aim to rigorously document both sedation depth and ventilation modality to more accurately validate these associations. Third, as the study was retrospective, we measured functional lung size using compliance. Transpulmonary pressures33 or lung computed tomography (CT) scan may provide more accurate pulmonary49 function expansion and pulmonary heterogeneity or the recruitability measurements.38,50 However, as these specific data are not available in MIMIC-IV, it is necessary to further investigate the normalization of MP to lung volume using transpulmonary pressures or CT in the future.
ConclusionAccording to our study, TWA-MPCRS can predict poor clinical outcomes in critically ill patients. TWA-MPCRS is positively associated with ICU/in-hospital mortality.
CRediT authorship contribution statementYKD and YGL carried out the design, conducted data analysis and wrote the manuscript. JQF and RH conducted data collection and interpreted the analysis. HY, JNW and YW participated in the manuscript revision. FS designed the study and conducted data analysis and reviewed the manuscript. All authors read and approved the final manuscript.
Ethics approval and consent to participateThe studies involving human participants were reviewed and approved by Institutional Review Board of the Massachusetts Institute of Technology and Beth Israel Deaconess Medical Center. De‑identification was performed to ensure patients’ confidentiality. Written informed consent for participation was not required for this study in accordance with the National Legislation and the Institutional requirements.
Consent for publicationNot applicable.
Declaration of Generative AI and AI-assisted technologies in the writing processNo artificial intelligence was used in the study and writing of the manuscript.
FundingNot applicable.
Data availabilityThe datasets supporting the conclusions of this article are available in the physionet (https://physionet.org/content/mimiciv/2.0/).
The authors declare no competing interest.
We thank Dr. Jie Liu of the Department of Vascular and Internal Medicine, People’s Liberation Army General Hospital, China, for his contributions to comments on the manuscript.
The following is Supplementary data to this article: