


Editado por: Rosario Amaya Villar - Unidad de Cuidados Intensivos, Hospital Universitario Virgen del Rocio, Sevilla, España
Última actualización: Febrero 2024
Más datosTo assess the role of diastolic dysfunction and fluid balance in weaning failure.
DesignProspective, observational, single center.
SettingIntensive care unit of a university hospital.
PatientsAdult patients on mechanical ventilation for more than 48 h who underwent a spontaneous breathing trial (SBT).
InterventionsEchocardiography was performed immediately before and at the end of SBT. Patients were classified into two groups according to weaning outcome.
Main variable of interestWeaning failure.
ResultsAmong 89 patients included, weaning failure occurred in 33 patients (37%). Isolated diastolic dysfunction at the end of the SBT was more frequent in the failure group (39.3% vs. 17.8%, p = 0.025). Average daily fluid balance from ICU admission until first SBT was less negative in patients who failed than in those who succeed in the weaning (−648 mL [−884 to -138] vs. −893 mL [−1284 to −501], p = 0.007). Average daily fluid balance from the first SBT until the ICU discharge was more negative in the weaning failure than in the success group (−973 mL [−1493 to −201] vs. −425 mL [−1065 to 12], p = 0.034). Cox regression analysis showed that diastolic dysfunction was not an independent factor related to weaning failure but needed the association of positive fluid balance and age.
ConclusionsWeaning failure due to diastolic dysfunction is highly related to fluid balance, and the deleterious effect of fluid balance on diastolic function is associated with age The timing of fluid removal could play a key role in this scenario.
Evaluar el papel de la disfunción diastólica (DD) y el balance hídrico en el fracaso del destete de la ventilación mecánica.
DiseñoProspectivo, observacional.
ÁmbitoUnidad de cuidados intensivos hospital universitario.
PacientesPacientes adultos con ventilación mecánica más de 48 h sometidos a una prueba de respiración espontánea (SBT).
IntervencionesEcocardiografía antes y al final del SBT. Los pacientes se clasificaron en dos grupos según el resultado del destete.
Variable de interés principalFracaso del destete.
ResultadosSe incluyeron 89 pacientes, el fracaso del destete ocurrió en 33 (37%). La DD al final de la SBT fue más frecuente en el grupo de fracaso (39,3% vs 17,8%, p = 0,025). El balance hídrico diario desde el ingreso en UCI hasta la SBT fue menos negativo en los pacientes que fracasaron que en los que tuvieron éxito del destete (−648 mL [-884 a -138] vs −893 mL [-1284 a -501], p = 0,007). El balance hídrico diario desde el primer SBT hasta el alta de UCI fue más negativo en el grupo de fracaso que en el de éxito (−973 ml [−1493 a −201] vs. −425 ml [−1065 a 12], p = 0,034). La regresión de Cox mostró que la DD no era un factor independiente relacionado con el fracaso, necesitando la asociación del balance hídrico y la edad.
ConclusionesEl fracaso del destete debido a DD se relaciona con el balance hídrico, incrementando su efecto nocivo con la edad. El momento de inicio del balance hídrico negativo puede jugar un papel clave en el fracaso.
Weaning patients from mechanical ventilation (MV) represents a challenge for clinicians.1 Daily awakening, followed by spontaneous breathing trials (SBT), has been found to reduce the duration of MV and associated morbidities.2 However, approximately 20–30% of mechanically ventilated patients fail their first SBT.3 Identifying the reason why a patient fails the weaning process is crucial since it might help to reduce the duration of mechanical ventilation and improve patient outcomes.4
Respiratory system failure is the most common cause of weaning failure,5 however, one-third of weaning failures are solely or partially from cardiovascular origin.6 Among routinely measured clinical variables, the respiratory rate (RR) to tidal volume (Vt) ratio, pneumonia at the initiation of ventilation and positive fluid balance have been found to be independent factors related to weaning failure.7,8
Cardiovascular dysfunction during the weaning process may involve both systolic and diastolic left ventricular function, however, a recent metanalysis emphasise the key role of left ventricular diastolic function and increased left ventricular filling pressure in this scenario.9
Treatment of many critical diseases requires volume resuscitation in the early stages of the disease. However, fluid overload can trigger acute pulmonary oedema in patients with left ventricular diastolic dysfunction,10 particularly when patients are subjected to a stress test such as the SBT.11
Since fluid overload and left ventricular diastolic dysfunction are associated with weaning outcomes, this study aims to evaluate the relationship between fluid balance and diastolic dysfunction according to weaning outcome in critically ill patients.
MethodsPatients and data collectionThis was a prospective, observational, single-center study conducted over a 1-year period in a university hospital intensive care unit (ICU). The protocol was approved by our institutional ethics committee and written informed consent was obtained from patients or their next of kin. The study included adult patients recruited from those under MV for more than 48 h who underwent a planned SBT. Patients with a tracheostomy, inadequate transthoracic echocardiographic window, atrial fibrillation, or do not reintubate orders were excluded.
Demographic data, causes of MV and illness severity (SAPS III) were recorded at ICU admission. Daily fluid balance was recorded from admission until the discharge from ICU. Weight was recorded using beds with built-in patient weighing scales (TotalCare, Hill-Rom, Batesville, Ind) at ICU admission, and subsequently, at 8 am every day during ICU stay. Patients were considered ready to undergo a SBT with a T-tube piece when they fulfilled all the classical criteria.12 At the start of SBT, the Vt and RR were measured in triplicate with a portable spirometer and the RR/Vt ratio was calculated.13 SBT was performed with the patient in a semirecumbent position, breathing through a T-tube with oxygen at a concentration prescribed by the attending physician. Patients were reconnected to MV if any of the standard criteria were met.12 SBT lasted 30–120 min, depending on patient tolerance or physician’s decision. Heart rate, invasive arterial blood pressure, and arterial oxygen saturation were continuously recorded during SBT. Clinical and echocardiography data were obtained immediately before and at the end of the SBT trial in all patients.
Weaning failure was defined as the need to reconnection to MV during SBT, or if the patient was extubated but needed mechanical ventilation (invasive or non-prophylactic non-invasive ventilation) or died within the following 48 h.5 Patients were reassessed daily and underwent a new SBT when weaning criteria were subsequently met until final extubation or death.
EchocardiographyAll echocardiography were digitally stored, and measurements were performed off-line by a single operator (LZ, with competence in advanced critical care echocardiography) blinded to the SBT results. Echocardiographic variables were measured before and at the end of SBT using a CX50 ultrasound device (Philips Healthcare, DA Best, the Netherlands). Systolic function was assessed by the monoplane Simpson method in the apical four-chamber view. Left ventricular diastolic function was assessed by Pulsed-wave Doppler measuring early (E) and late (A) diastolic wave velocities at the mitral valve, and tissue Doppler measuring early (e′) diastolic wave velocity at the external mitral annulus. All measures were averaged over a minimum of three cardiac cycles. Isolated diastolic dysfunction was defined using the 2016 European Society of Cardiology guidelines (LVEF ≥ 50% with plasma NT-proBNP > 1250 ng/L and E/e′ ratio ≥ 13 or e′ < 9 cm/s).14
Statistical analysisDue to the observational nature of the study, a formal calculation of the study sample size was not applicable.
Categorical data are presented as number (%), while continuous variables are presented as mean (95% confidence interval) or median [interquartile range] if non-normally distributed. To compare univariate data, we employed the Student’s t, ANOVA, Mann–Whitney U, or Kruskal–Wallis tests according to data distribution. Categorical data were compared using Fisher’s exact test. Comparisons between pre-SBT and end-SBT data were evaluated using a paired Student’s t-test or a Wilcoxon signed-rank sum test, based on data distribution. Statistical significance was set at p < 0.05, with all tests being two-sided. To evaluate the effect of fluid balance and diastolic dysfunction in weaning failure, Cox regression analysis was conducted with adjustments for potential confounding variables. A first model was constructed, including factors related to weaning failure in prior studies8,9 such as diastolic dysfunction, pneumonia as the reason for intubation, the RR/Vt ratio, age, and SAPS III. Furthermore, a second model was created by adding the cumulative fluid balance from ICU admission to SBT day.
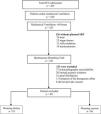
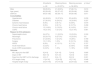
ResultsBaseline characteristics and weaning outcomesA total of 497 patients were admitted to our medical-surgical ICU during the study period (Fig. 1), of which 410 (82%) were mechanically ventilated. Among these, 347 (85%) remained under invasive MV for more than 48 h, and 221 patients underwent a planned SBT. Finally, as presented in Table 1, we obtained complete data from 89 patients (58 men, mean age 62 years (59−65), SAPS III 64 (61−68)). Weaning failed in 33 (37%) patients and was successful in 56 (63%). All baseline characteristics were similar between groups. Patients in the failure group needed more days of MV (9 [7–21] vs. 7 [4–10], p = 0.001) and ICU (12 [9–23] vs. 10 [7–16], p = 0.048) than the success group, although there were no differences between groups in days of MV before the first SBT.
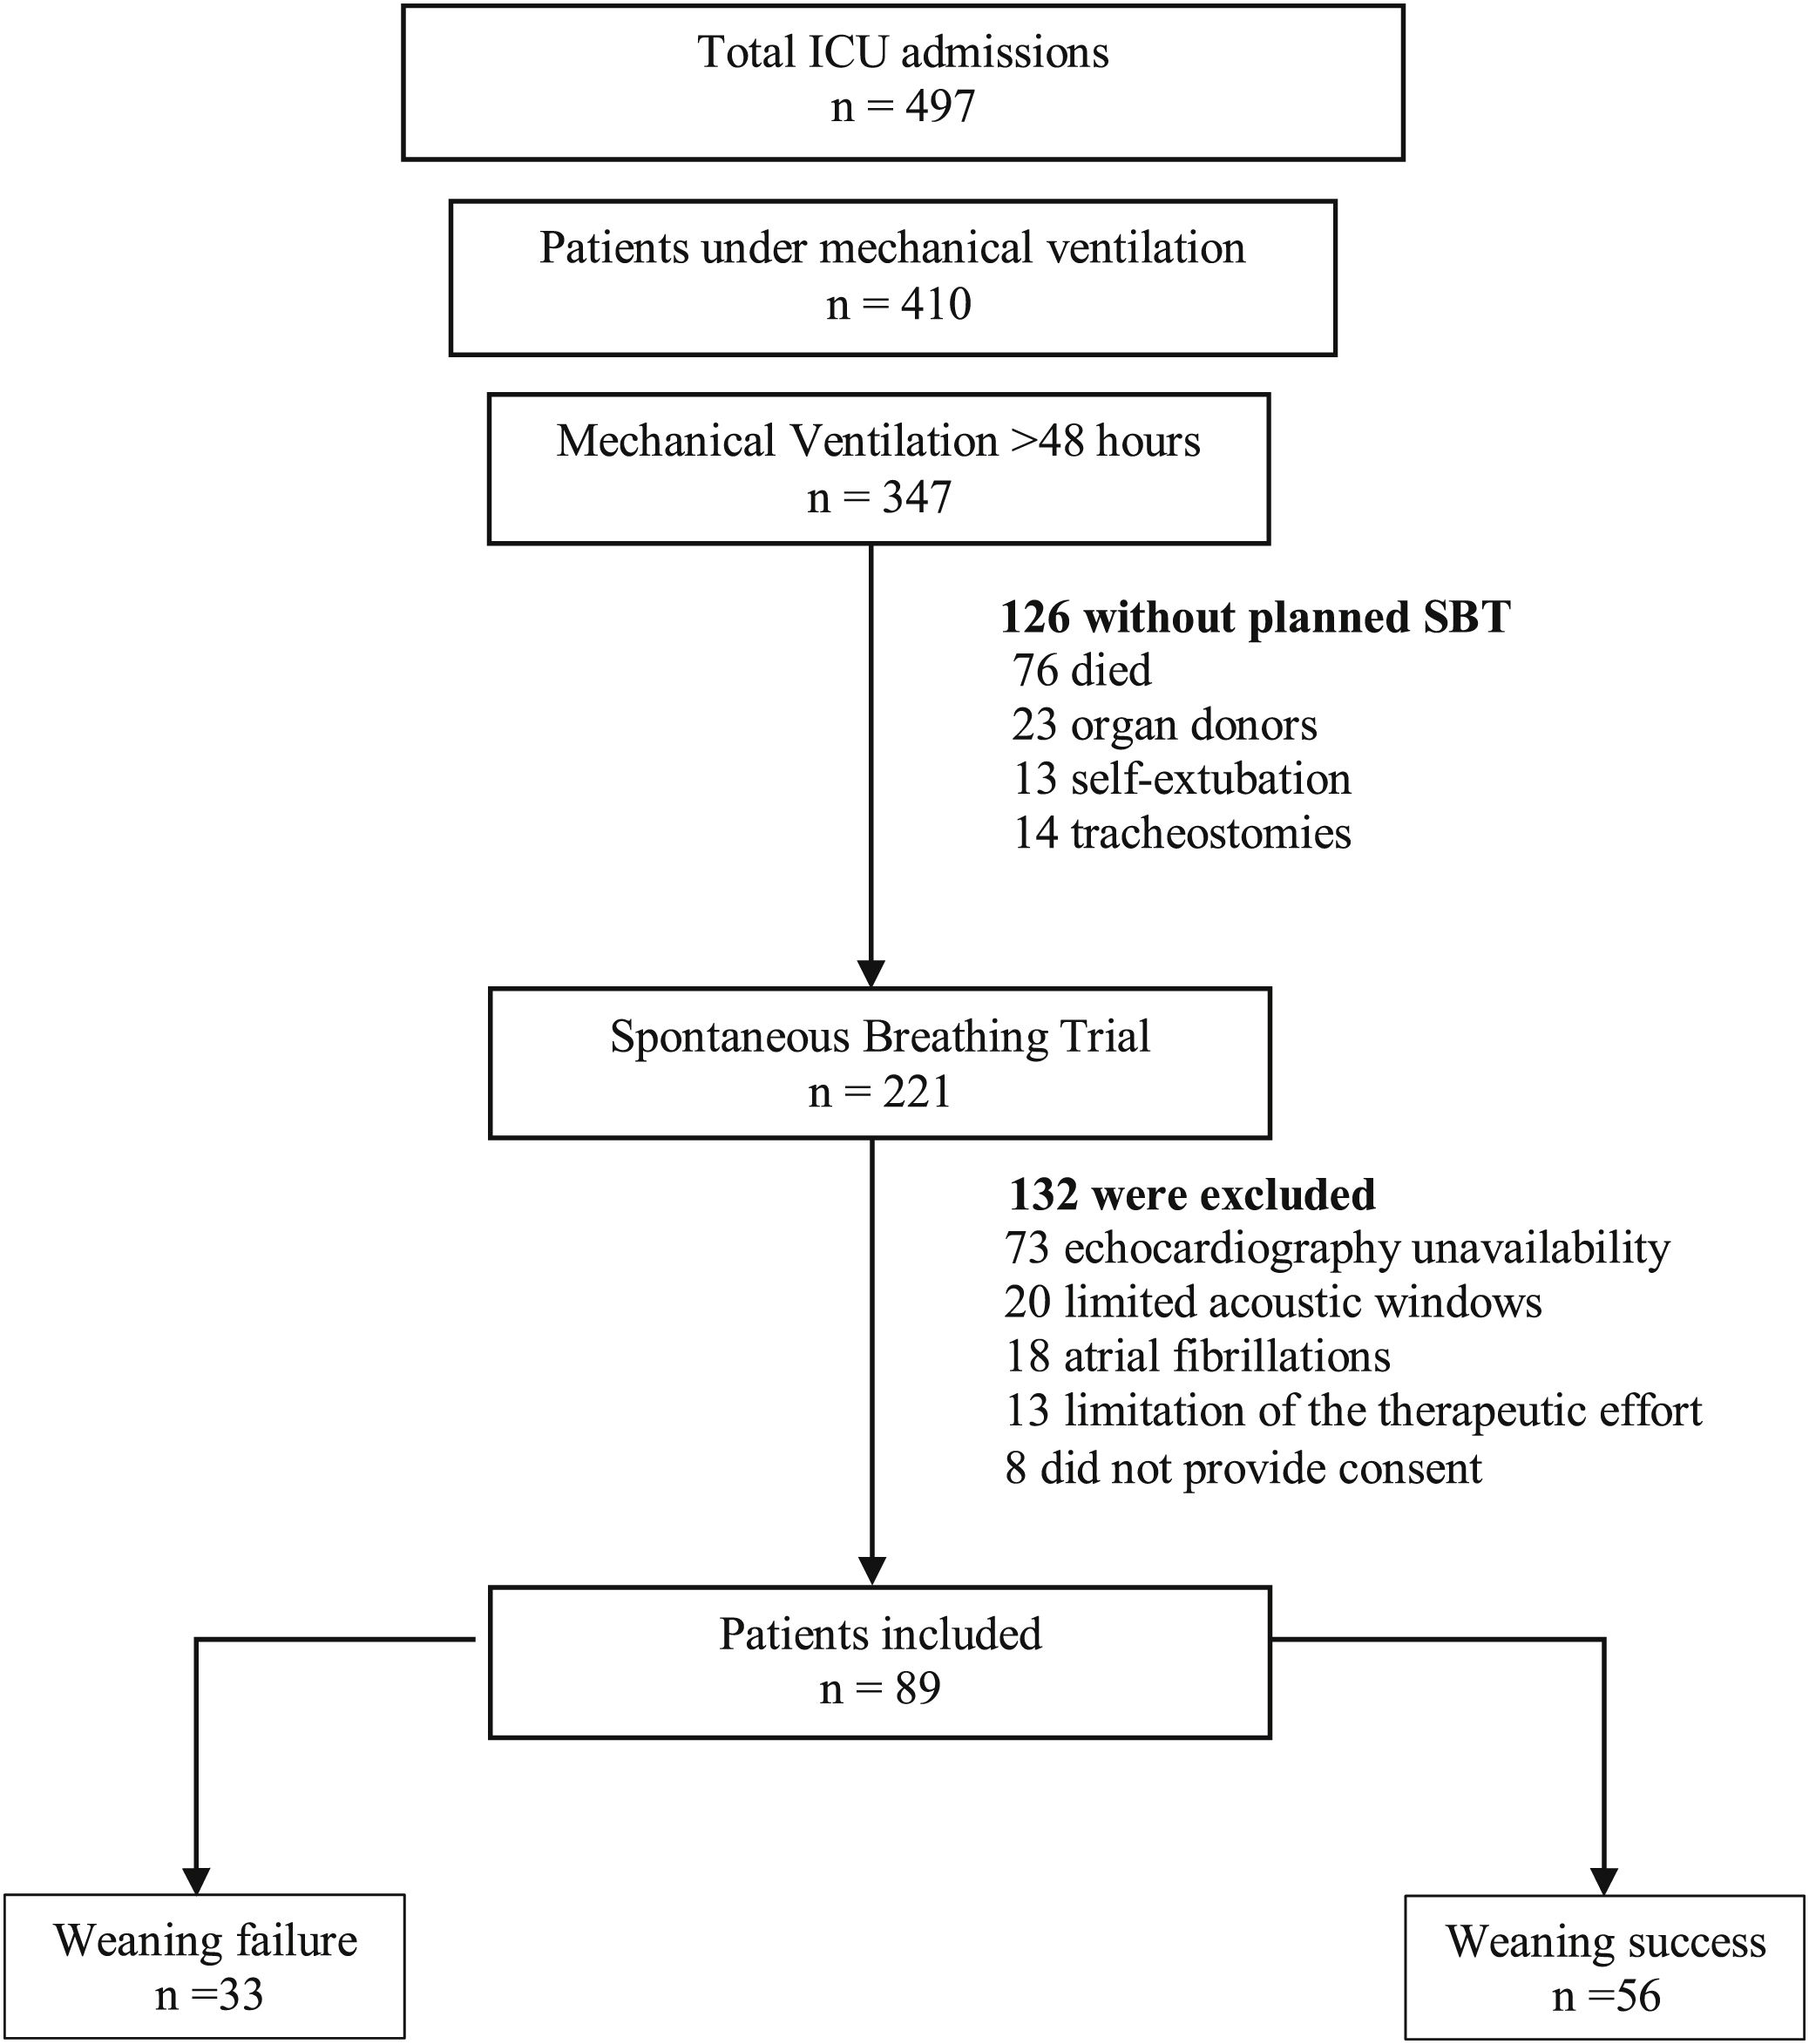
Study flow chart.
The flow chart shows the exclusion criteria. Weaning failure was defined as the need to reconnection to mechanical ventilation during spontaneous breathing trial (SBT), or if the patient was extubated but needed mechanical ventilation (invasive or non-invasive) or died within the following 48 h.
Baseline characteristics and outcomes of patients according to weaning results.
| All patients | Weaning failure | Weaning success | p Value* | |
|---|---|---|---|---|
| n = 89 | n = 33 (37%) | n = 56 (63%) | ||
| Male | 58 (65.2%) | 21 (63.6%) | 37 (66.1%) | 0.816 |
| Age (years) | 62 (59−65) | 62 (57−67) | 62 (59−66) | 0.929 |
| SAPS III | 64 (61−68) | 65 (58−71) | 64 (60−68) | 0.911 |
| Comorbidities | ||||
| Hypertension | 44 (49.4%) | 19 (57.6%) | 25 (44.6%) | 0.239 |
| Diabetes | 27 (30.3%) | 8 (24.2%) | 19 (33.9%) | 0.337 |
| Ischemic heart disease | 8 (9%) | 3 (9.1%) | 5 (8.9%) | 0.979 |
| Chronic heart failure | 8 (9%) | 2 (6.1%) | 6 (10.7%) | 0.458 |
| Chronic renal failure | 13 (14.6%) | 5 (15.2%) | 8 (14.3%) | 0.911 |
| COPD | 19 (21.3%) | 7 (21.2%) | 12 (21.4%) | 0.981 |
| Reason for ICU admission | ||||
| Sepsis/septic shock | 24 (27%) | 11 (33.3%) | 13 (23.2%) | 0.330 |
| Neurologic | 22 (24.7%) | 9 (27.3%) | 13 (23.2%) | 0.8 |
| Pneumonia | 21 (23.6%) | 7 (21.2%) | 14 (25%) | 0.799 |
| Surgery | 10 (11.2%) | 1 (3%) | 9 (16.1%) | 0.084 |
| ARDS | 8 (9%) | 4 (12.1%) | 4 (7.1%) | 0.707 |
| Acute heart failure | 2 (2.2%) | 0 | 2 (3.6%) | 0.528 |
| Acute COPD exacerbation | 2 (2.2%) | 1 (3%) | 1 (1.8%) | 0.999 |
| Outcome | ||||
| MV, days prior first SBT | 6 [4–9] | 5 [4–10] | 7 [4–9] | 0.895 |
| Days on MV | 8 [5–14] | 9 [7–21] | 7 [4–9] | 0.001 |
| Days from first SBT to ICU discharge | 4 [2–7] | 6 [4–11] | 3 [2–5] | 0.001 |
| ICU length of stay | 11 [8–18] | 12 [9–23] | 10 [7–16] | 0.048 |
| Hospital length of stay | 23 [15−40] | 27 [14–23] | 22 [16–22] | 0.558 |
Data are presented as n (%), mean (95% CI) or median [interquartile range]. BMI: body mass index; APACHE: acute physiology and chronic health evaluation; SAPS: simplified acute physiology score; COPD: chronic obstructive pulmonary disease; ICU: intensive care unit. ARDS: acute respiratory distress syndrome; MV: mechanical ventilation; SBT: spontaneous breathing trial.
Table 2 shows values observed before and at the end of the SBT in each weaning group. Before the weaning process, there were no differences between groups in any of the respiratory, hemodynamic or echocardiographic variables analysed.
Respiratory, gas exchange, hemodynamic, and echocardiographic variables among groups of weaning outcome.
| Weaning failure | Weaning success | p Values* between subroups | ||||
|---|---|---|---|---|---|---|
| n = 33 | n = 56 | |||||
| Baseline | End SBT | Baseline | End SBT | Baseline | End SBT | |
| Respiratory | ||||||
| Respiratory rate (breath/min) | 21 (18−24) | 22 (20−24) | 19 (18−21) | 21 (19−22)a | 0.175 | 0.351 |
| Tidal volume (ml) | 475 (437−513) | 445 (407−484) | 506 (474−538) | 469 (437−500)a | 0.223 | 0.354 |
| Respiratory rate/tidal volume | 47 (40−55) | 53 (45−61) | 42 (36−48) | 48 (42−53) | 0.292 | 0.268 |
| PaO2 (mmHg) | 87 (78−95) | 75 (67−84)a | 97 (88−105) | 90 (81−99) | 0.113 | 0.025 |
| PaCO2 (mmHg) | 41 (37−45) | 40 (36−40) | 43 (39−47) | 38 (36−41)a | 0.476 | 0.351 |
| pH | 7.44 (7.41−7.46) | 7.42 (7.38−7.46) | 7.41 (7.40−7.43) | 7.41 (7.39−7.43) | 0.08 | 0.707 |
| Pressure support | 7 (7−8) | 8 (7−8) | 0.775 | |||
| PEEP | 5 (5−6) | 5 (5−6) | 0.706 | |||
| Hemodynamic | ||||||
| Systolic blood pressure, mmHg | 124 (118−130) | 134 (126−143)a | 124 (120−128) | 125 (121−130) | 0.949 | 0.032 |
| Mean arterial pressure, mmHg | 86 (82−90) | 91 (87−96)a | 83 (81−86) | 84 (81−87) | 0,443 | 0.002 |
| Heart rate, beats/min | 87 (82−93) | 96 (90−102)a | 83 (79−87) | 88 (84−92)a | 0,197 | 0.033 |
| Rate pressure product, mmHg × bpm | 10,774 (10005–11543) | 12,999 (11653−14355)a | 10,260 (9641−10879) | 11,031 (10407−11655)a | 0.301 | 0.003 |
| NT-proBNP, ng/L | 992 [372−1715] | 884 [330−1511] | 773 [254−1652] | 735 [233−1478] | 0.426 | 0.280 |
| Echocardiography | ||||||
| Systolic dysfunction | 3 (9.1%) | 2 (6.1%) | 5 (8.9%) | 4 (7.11%) | 0,646 | 0,676 |
| LVEF, % | 64 (59−69) | 66 (61−71) | 67 (64−71) | 68 (64−72) | 0.239 | 0.594 |
| Diastolic dysfunction | 10 (30.3%) | 13 (39.3%) | 14 (25%) | 10 (17.8%) | 0.586 | 0.025 |
| E, cm/s | 85 (76−95) | 93 (80−107)a | 85 (77−92) | 87 (80−94) | 0.92 | 0.357 |
| A, cm/s | 89 (80−95) | 89 (80−99) | 82 (77−88) | 89 (82−95)a | 0.188 | 0.896 |
| E/A | 1 (0.8−1–2) | 1.1 (0.8−1.4) | 1.1 (0.9−1.2) | 1 (0.9−1.1) | 0.373 | 0.350 |
| e′ lateral | 11 (9−12) | 10 (8−12) | 11 (9−12) | 11 (10−12) | 0.904 | 0.753 |
| E/e′ | 9 (7−11) | 11 (7−14) | 8 (7−9) | 8 (7−9) | 0.413 | 0.204 |
| TAPSE, mm | 23 (22−24) | 22 (20−23) | 21 (20−22) | 22 (21−24) | 0.083 | 0.427 |
Data are presented as n (%), mean (95% CI) or median [interquartile range]. PEEP: positive pressure at the end of the expiration; BNP: brain natriuretic peptide; LVEF: left ventricular ejection fraction; E: early diastolic wave measured by pulsed-waved Doppler: A: diastolic wave measured by pulsed-waved Doppler; e′: early diastolic wave measured by tissue Doppler; TAPSE: tricuspid annular plane systolic excursion.
t-Student’s for continuous variables normally distributed, Mann–Whitney U test for continuous variables non-normally distributed and Fisher’s exact test for categorical data.
p < 0.05 compared to baseline data, paired Student’s t-test—systolic dysfunction was defined as a left ventricular ejection fraction less than 50%. Isolated diastolic dysfunction was defined as a left ventricular ejection fraction greater than 50%, NTproBNP > 1250 ng/L and E/e′ ratio ≥ 13 or e′ < 9.
The partial pressure of oxygen in arterial blood decreased significantly in the failure group and was lower than in the success group at the end of the SBT (75 mmHg (67−84) vs. 87 mmHg (78−95), p = 0.025).
Both groups showed significant increases in heart rate and the pressure-rate product during the SBT. However, at the end of the SBT, systolic blood pressure (134 mmHg (126−143) vs. 125 mmHg (121−130), p = 0.032) and heart rate (96 beats/min (90−102) vs. 83 beats/min (79−87), p = 0.033) were higher in the failure group than in the success.
The prevalence of isolated diastolic dysfunction was similar between the groups before the SBT (30% in the failure group and 25% in the success group, p = 0.586). However, at the end of the SBT, there was a significant difference in the prevalence of diastolic dysfunction between the weaning failure and success group (39.3% vs. 17.8%, p = 0.025).
Transmitral E wave maximal velocity significantly increased during the SBT in the failure group (85 cm/s (76−95) vs. 93 cm/s (80−107), p = 0.042), while there was no change in the success group (85 cm/s (77−92) vs. 87 cm/s (80−94), p = 0.806). There were no significant differences between groups in the maximal velocity of the lateral e′ wave and E/e′ ratio, neither at the start nor at the end of the SBT.
Cumulative fluid balancesDifferences in fluid balances and weight between patients who experienced weaning failure and those who succeed are showed in Table 3 and Fig. 2. Patients who failed the weaning had a significantly greater cumulative positive fluid balance than successful weaning patients in the first 48 h of ICU admission (216 mL [−1151 to 2357] vs. −1495 mL [−3506 to 1346], p = 0.017). Average daily fluid balance from ICU admission until SBT was less negative in patients who failed the weaning than in those who succeeded (−648 mL [−884 to −138] vs. −893 mL [−1284 to −501], p = 0.007). However average daily fluid balance from the first SBT until the ICU discharge was more negative in the weaning failure than in the success group (−973 mL [−1493 to −201] vs. −425 mL [−1065 to 12], p = 0.034).
Cumulative fluid balances and weights during ICU admission according to weaning outcome.
| All patients | Weaning failure | Weaning success | p Value* | |
|---|---|---|---|---|
| n = 89 | n = 33 | n = 56 | ||
| Cumulative fluid balance first 6 h, mL | 300 [−253 to 987] | 409 [−257 to 800] | 295 [−252 to 1000] | 0.99 |
| Cumulative fluid balance first ICU day, mL | 488 [−718 to 2117] | 893 [−619 to 2303] | −28 [−836 to 1424] | 0.15 |
| Cumulative fluid balance second ICU day, mL | −688 [−1984 to 185] | −270 [-1573 to 662] | −1035 [−2365 to −30] | 0.029 |
| Average daily fluid balance from ICU admission to first SBT day, mL | −754 [−1014 to −208] | −648 [−884 to −138] | −893 [−1284 to −501] | 0.007 |
| Average daily fluid balance from first SBT to ICU discharge, mL | −605 [−1295 to 0] | −973 [−1493 to −201] | −425 [−1065 to 12] | 0.034 |
| Average daily fluid balance during ICU, mL | −682 [−998 to −333] | −682 [−998 to −338] | −778 [−1105 to −374] | 0.476 |
| Weight difference (24 h — admission in ICU), kg | 0.25 [0–1.8] | 0.5 [0–1.9] | 0 [−0.5 to 1.9] | 0.322 |
| Weight difference (48 h — admission in ICU), kg | 0.5 [−1.4 to 2] | 0.75 [−1 to 3.1] | 0.25 [−1.9 to 1.6] | 0.149 |
| Weight difference (SBT day — admission in ICU), kg | −0.75 [−3.9 to 1.4] | 0 [−2.6 to 2.2] | −1.25 [−4.3 to 0.5] | 0.015 |
Data are presented as median [interquartile range]. ICU: intensive care unit; SBT: spontaneous breathing trial.
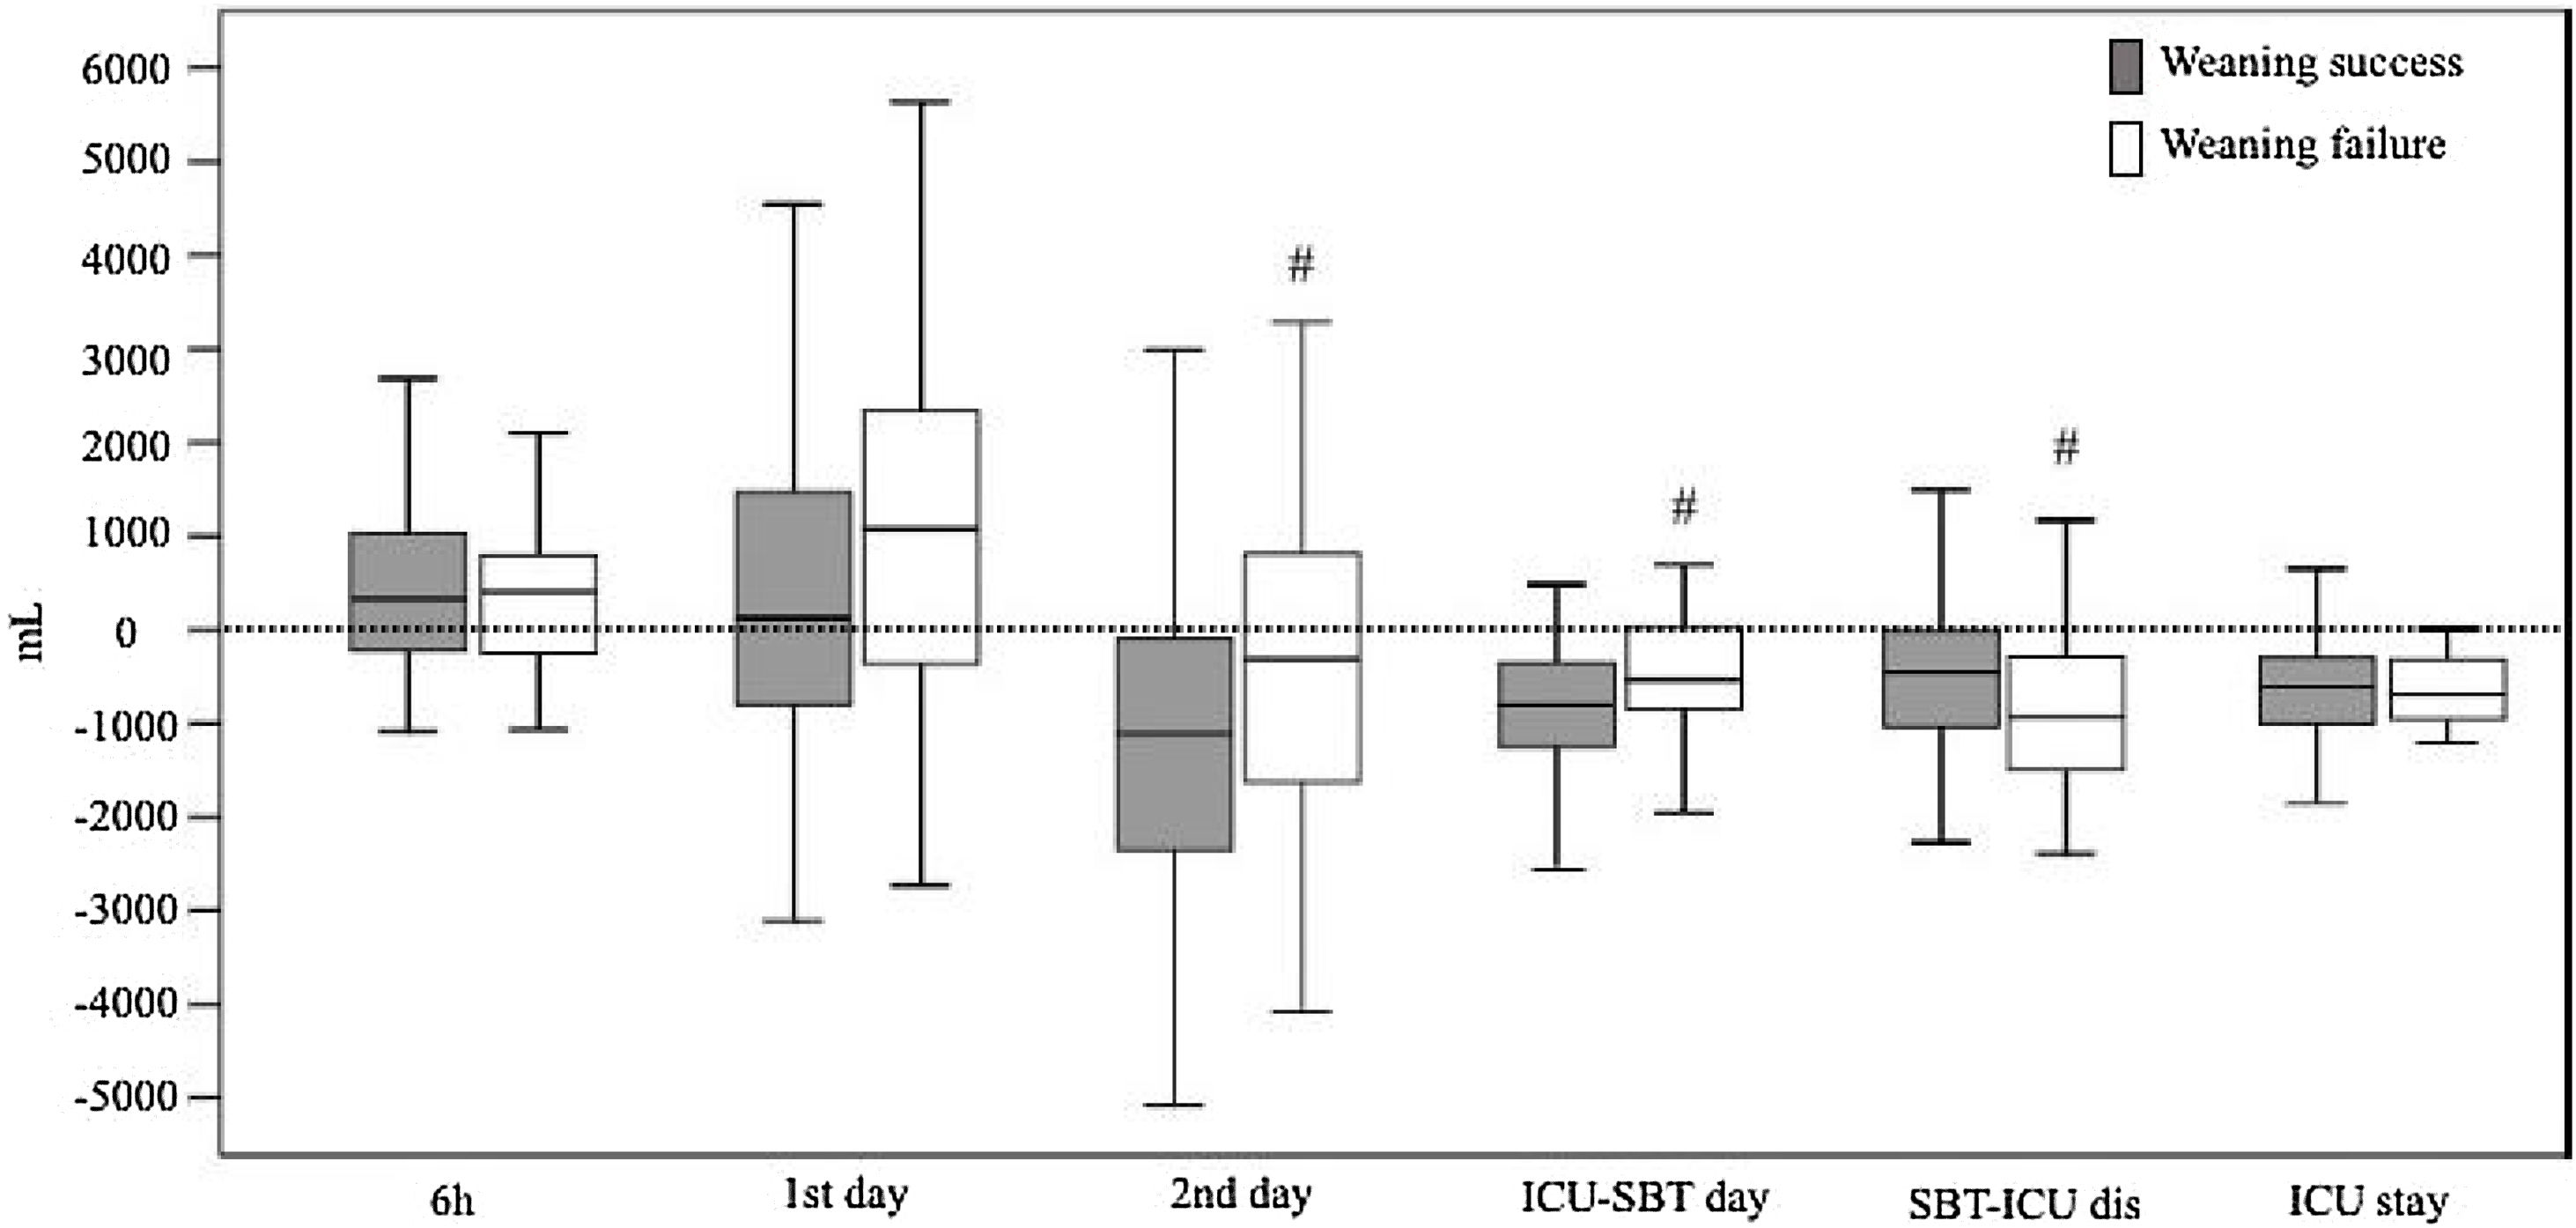
Fluid balances according to weaning outcome.
Box-whisker plots showing fluid balances depending on the weaning outcome: success (grey bars) or failure (white bars). p Values in each group are shown (Mann–Whitney U test). #< p 0.05 compared to success group. SBT: spontaneous breathing trial. ICU-SBT day: fluid balance from ICU admission to spontaneous breathing trial day. SBT-ICU dis: fluid balance from spontaneous breathing trial day to intensive care unit discharge. ICU stay: cumulative fluid balance of entire ICU stay.
Patients who failed the weaning had no weight differences from ICU admission to SBT, while those who succeeded had a loss of body weight relative to admission in ICU (0 kg [−2.6 to 2.2] vs.−1.25 kg [−4.3 to 0.5], p = 0.015).
Association of diastolic dysfunction and fluid balances during weaningCox regression analyses (Table 4) showed that RR/Vt at the beginning of the SBT was associated with weaning failure in both models, regardless of whether the fluid balance was included (hazard ratio (HR) 5.015 (95% CI: 1.434−18.53); p = 0.012) or not (HR 4.702 (95% CI: 1.344−16.453); p = 0.015). Otherwise, in the model 2, with fluid balance included, age (HR 1.03 (95% CI: 1.005–1.05); p = 0.019) and diastolic dysfunction (HR 2.55 (95% CI: 1.123−5.812); p = 0.012) were associated with weaning failure together with fluid balance from ICU admission to SBT (HR 1.02 for each 250 mL of positive fluid balance (95% CI: 1.009−1.032); p < 0.001).
Cox regression analyses of factors associated with spontaneous breathing failure.
| Cox Regression analysis | Cox Regression analysis | |||
|---|---|---|---|---|
| Model 1 | Model 2 | |||
| Adjusted hazard ratio (95% CI) | p Value | Adjusted hazard ratio (95% CI) | p Value | |
| Age (year) | 1.021 (0.997−1.046) | 0.082 | 1.03 (1.005−1.056) | 0.019 |
| SAPS III (point) | 0.993 (0.974−1.013) | 0.507 | 0.995 (0.975−1.015) | 0.624 |
| Pneumonia as a reason for intubation | 0.636 0.,331−1.225) | 0.176 | 0.662 (0.345−1.27) | 0.215 |
| Respiratory ratio/tidal volume >80 at the start of SBT | 4.702 (1.344−16.453) | 0.015 | 5.015 (1.434−18.53) | 0.012 |
| Diastolic dysfunction | 1.708 (0.791−3.690) | 0.173 | 2.55 (1.123−5.812) | 0.025 |
| Fluid balance from ICU admission to SBT (each 250 mL) | Not included | 1.02 (1.009−1.032) | 0.001 | |
SAPS: simplified acute physiology score; SBT: spontaneous breathing trial; CI: confidence interval.
Diastolic dysfunction and positive fluid balance have been found to be related to weaning failure.7,15 In our study, we demonstrate the interdependence between these two factors during the weaning process, emphasising the importance of reporting fluid balance in studies that analyse the role of diastolic dysfunction in weaning failure.
Diastolic function is influenced by intrinsic (contractility, left ventricular stiffness) and extrinsic factors (preload, afterload).10 We found that 39% of patients who failed the weaning process showed diastolic dysfunction at the end of the SBT, which is similar to the percentages recently reported by Roche-Campo 39%16 and Goudelin 30%.17 The SBT, as a stress test, induced an increase in heart rate and blood pressure, which was greater in the failure group compared to the success group, consistent with previous research.16–18 Tachycardia and hypertension are well-known factors that can precipitate heart failure in patients with diastolic dysfunction by reducing diastolic filling time and increasing afterload, respectively.19
Our study also revealed a significant increase in E-wave during the SBT in the failure group, indicating a significant increase in venous return. This finding is consistent with previous studies and reflects that transition from positive-pressure ventilation to spontaneous breathing with negative intrathoracic pressure, increases venous return and left ventricular preload. While some studies have reported an increase in the E/e′ ratio during the SBT,16 we did not find a significant increase in this ratio. Our E-wave results concur with those of Roche-Campo et al.16 and Goudelin et al.17 In contrast to the Roche-Campo study, where an increase in E-wave was accompanied by a rise in the E/e′ ratio, the Goudelin study did not exhibit a significant increase in this ratio, similar to our findings. This discrepancy observed among these studies could potentially be attributed to the timing of the second echocardiography, the percentage of patients failing the SBT due to pulmonary oedema, or the modality of the SBT.20
A multicenter study published recently has challenged prior findings, revealing that elevated filling pressures, as determined by echocardiographic indices, were not associated with weaning outcomes in elderly patients.21 These differences with previous studies could be explained by the high pre-test probability of cardiac weaning failure of the elderly population, or, simply, by a different fluid balance management, that was not reported in the Bouhemad study.
Cox regression analysis revealed that, in our patients, diastolic dysfunction alone was not an independent factor related to weaning failure but needed to be associated with positive fluid balance. We also found that the deleterious effect of fluid balance on diastolic function increased with age. Fluid removal, guided by echocardiography17 or B-type natriuretic peptide concentrations,22 in patients ready to start the weaning process, has been demonstrated to reduce the duration of MV or the percentage of patients failing the SBT. However, several randomised controlled trials analysing the effect of restrictive versus liberal fluid approaches in critically ill patients, particularly those with sepsis, did not find benefit or harm.23,24 We showed no differences in terms of fluid balance during the entire ICU admission between patients failing or succeeding the weaning. However, significant differences were observed in the timing of achieving negative fluid balance. Patients who successfully completed the first SBT had a greater negative fluid balance from admission until the SBT day, as opposed to those who were unsuccessful, who presented a more negative balance from the first SBT day until their discharge from the ICU. These findings emphasise the importance of monitoring volume status to initiate decongestive therapy to shorten the weaning process.
Strengths and limitationsThis study has several limitations. The first limitation is related to the observational nature of the study, it is important to note that our results only indicate an association rather than causality. Second, the lack of a gold standard definition of diastolic dysfunction complicated the analysis of our data. Third, no echocardiographic data were recorded in the consecutive weaning trials in patients failing the first SBT. Fourth, all the patients underwent the SBT through a T-tube with oxygen, no other modalities of SBT were studied. Finally, this study was conducted in a single center and our findings might not apply to other ICUs with different fluid or weaning protocols.
Nonetheless, the main strengths of our study include its prospective design, the meticulous compilation of daily fluid balances from ICU admission to ICU discharge, and the detailed echocardiographic assessment at the beginning and the end of the SBT.
ConclusionsWeaning failure due to diastolic dysfunction is highly related to fluid balance, and the deleterious effect of fluid balance on diastolic function is associated with age. Therefore, future investigations of diastolic dysfunction in the context of weaning failure should consider the role of fluid balance. Continuous and comprehensive monitoring of fluid status is essential in ICU patients to initiate de-resuscitation or active fluid removal as soon as possible.
Authors' contributionsLZ designed the study, performed data collection, analysed the data, and wrote the manuscript. JSM and PLG designed the study, participated in data collection, and review the final version of the manuscript.
Ethics approval and consent to participateThe study protocol was approved by the ethics committee of Santa Creu i Sant Pau Hospital.
Competing interestsThe authors declare that they have no competing interests.
FundingNo funding was received for this work and publication.