


Serum procalcitonin (PCT) concentration could be increased in patients with renal dysfunction in the absence of bacterial infection.
ObjectiveTo determine the interactions among serum renal biomarkers of acute kidney injury (AKI) and serum PCT concentration, in patients admitted to the intensive care unit (ICU) due to lung influenza infection.
DesignSecondary analysis of a prospective multicentre observational study.
Setting148 Spanish ICUs.
PatientsICU patients admitted with influenza infection without bacterial co-infection. Clinical, laboratory and hemodynamic variables were recorded. AKI was classified as AKI I or II based on creatinine (Cr) concentrations (≥1.60–2.50mg/dL and Cr≥2.51–3.99mg/dL, respectively). Patients with chronic renal disease, receiving renal replacement treatment or with Cr>4mg/dL were excluded. Spearman's correlation, simple and multiple linear regression analysis were performed.
InterventionsNone.
ResultsOut of 663 patients included in the study, 52 (8.2%) and 10 (1.6%) developed AKI I and II, respectively. Patients with AKI were significantly older, had more comorbid conditions and were more severally ill. PCT concentrations were higher in patients with AKI (2.62 [0.60–10.0]ng/mL vs. 0.40 [0.13–1.20]ng/mL, p=0.002). Weak correlations between Cr/PCT (rho=0.18) and Urea (U)/PCT (rho=0.19) were identified. Simple linear regression showed poor interaction between Cr/U and PCT concentrations (Cr R2=0.03 and U R2=0.018). Similar results were observed during multiple linear regression analysis (Cr R2=0.046 and U R2=0.013).
ConclusionsAlthough PCT concentrations were slightly higher in patients with AKI, high PCT concentrations are not explained by AKI and could be warning sign of a potential bacterial infection.
Los niveles de procalcitonina (PCT) pueden elevarse en pacientes con disfunción renal aún en ausencia de infección bacteriana.
ObjetivosDeterminar la interacción entre los biomarcadores de disfunción renal aguda (AKI) y las concentraciones séricas de PCT en pacientes ingresados en cuidados intensivos (UCI) debido a infección por gripe.
DiseñoAnálisis secundario de un estudio prospectivo, multicéntrico observacional.
LugarCiento cuarenta y ocho UCI.
PacientesCon infección por gripe sin co-infección bacteriana. Se registraron las variables clínicas, de laboratorio y hemodinámicas. El nivel de AKI fue definido como AKI I y II basado en la creatinina (Cr) sérica (>1,60-2,50mg/dl y >2,51-3,99mg/dl), respectivamente. Pacientes con insuficiencia renal crónica, técnicas de reemplazo renal o Cr>4mg/dl fueron excluidos. El análisis estadístico se realizó mediante correlación de Spearman y regresión linear simple y múltiple.
IntervencionesNinguna.
ResultadosDe los 663 pacientes incluidos, 52 (8,2%) y 10 (1,6%) desarrollaron AKI I y II, respectivamente. Pacientes con AKI fueron más añosos, presentaron más comorbilidades y mayor nivel de gravedad. Los niveles de PCT fueron mayores en pacientes con AKI (2,62 [0,60-10,0] ng/ml vs. 0,40 [0,13-1,20] ng/ml; p=0,002). Se observaron correlaciones débiles entre Cr/PCT (rho=0,18) y PCT/U (rho=0,19). La regresión linear simple evidenció una pobre contribución tanto de Cr (R2=0,03) como de U (R2=0,018) sobre los niveles de PCT. Resultados similares fueron obtenidos con la regresión linear múltiple para Cr (R2=0,046) y U (R2=0,013).
ConclusionesAunque los valores de PCT pueden estar elevados en pacientes con AKI, altos niveles de PCT no pueden ser explicados por la disfunción renal y podrían ser un signo de alarma de una potencial infección bacteriana.
Procalcitonin (PCT) is an acute-phase protein released into the bloodstream mainly in response to bacterial infection.1–4 Its sensitivity and specificity for bacterial infections is around 0.77 and 0.79, respectively, with an area under the curve (AUC) that has been reported as high as 0.85.5 However, serum PCT concentrations can be increased during inflammatory conditions in the absence of bacterial infection.6 PCT is eliminated by kidney clearance, thus, high concentrations of PCT in patients with chronic or acute kidney dysfunctions are frequently interpreted as non-bacterial infection related elevations.2–7
Several studies have found increased PCT levels in patients presenting with chronic kidney disease, peritoneal dialysis and oliguria in the absence of bacterial infections.8–13 A recent meta-analysis,14 including studies with high heterogeneity, reported that in patients with chronic kidney disease (CKD), PCT might have poor sensitivity (73%) but acceptable specificity (88%) for the diagnosis of bacterial infection. Nevertheless, the best cut-off value of PCT in patients with acute kidney injury (AKI) remains unknown and the real relation among creatinine/urea and PCT concentration are not clear. Moreover, the underlying mechanisms of PCT elevation in these patients are not fully understood.
Our hypothesis is that low concentrations of PCT are accurate in order to rule out bacterial coinfection in patients with influenza pneumonia admitted to the intensive care unit (ICU), but higher PCT levels should be carefully interpreted in patients with acute kidney injury (AKI). In this context, the primary goal of this study was to determine the relation between AKI (using creatinine and urea as surrogate markers of AKI) and PCT concentrations in critically ill patients with influenza pneumonia without bacterial co-infection.
Patients and methodsStudy design and patient populationThis was a pre-planned secondary analysis of a prospective, observational, multicentre cohort study conducted in 148 ICUs in Spain between June 2009 and April 2014. Data were obtained from a voluntary registry created by the Sociedad Española de Medicina Intensiva, Crítica y Unidades Coronarias (SEMICYUC). The study was approved by the Joan XXIII University Hospital Ethics Committee (#11809). The requirement for informed consent was waived due to the observational nature of the study, as reported elsewhere.15–18
Inclusion and exclusion criteriaAll patients admitted to the ICU with influenza symptoms were systematically tested to confirm influenza A, B, or C infection. Influenza virus infection was confirmed by real-time reverse-transcription polymerase chain reaction (PCR) in all subjects as previously reported.15–18 Only patients with PCT measured on ICU admission were included in the analysis.
Patients with bacterial co-infection previous to ICU admission, with CKD and AKIN 3 (creatinine levels ≥4mg/dL) were excluded from the study. Additionally, patients receiving renal replacement therapies (RRT) were excluded due to potential PCT elimination by RRT.8,9,12,19
Patients were considered to have bacterial co-infection when a respiratory bacterial pathogen was identified within the first two days of ICU admission. In patients under mechanical ventilation, a respiratory specimen was obtained upon admission to the ICU according to local protocols. In addition, patients were tested for Streptococcus pneumoniae and Legionella maltophilia using urinary antigens as previously described.18
Acute kidney injury definitionAKI was defined according to the current Acute Kidney Injury Network (AKIN) definitions.20 Importantly, we only used creatinine levels because we were unable to record information on urinary output. The cohort was stratified into three groups as follows: (a) AKI 0: no AKI, (b) AKI I: with creatinine levels between 1.60 and 2.50mg/dL and (c) AKI II: with creatinine levels between 2.51 and 3.99mg/dL.
Variables recordedThe following variables were collected: demographic data, comorbidities, need for mechanical ventilation, vasopressor usage and laboratory findings. To determine the severity of illness, the Acute Physiology and Chronic Health Evaluation II (APACHE II) score21 was calculated in all patients within 24h of ICU admission. For linear regression analysis, a modified APACHE II score without renal dysfunction points was used. Organ failure was assessed using the Sequential Organ Failure Assessment (SOFA) scoring system.22 Further definitions are presented in the supplementary electronic material.
Laboratory testingPCT is not part of the biomarkers recommended for the diagnosis of community-acquired pneumonia (CAP) by the Spanish guidelines.23 The decision to assess serum PCT upon ICU admission was left to the discretion of the attending physician and was not standardized per protocol. PCT was measured using B·R·A·H·M·S PCT automated immunoassays. The analytical sensitivity of all assays was <0.05μg/L. All techniques were based on a one-step immunoassay sandwich method determined either by chemiluminescence or fluorescence.
Study end-pointsThe primary endpoint of this analysis was to evaluate the relationship between both serum levels of renal biomarkers (creatinine and urea) and serum levels of PCT upon ICU admission. The secondary end-point was to determine the relative contribution of creatinine/urea on PCT concentrations.
Statistical analysisFirst, we determine the strength of relationship between creatinine and urea with PCT levels by linear correlation analysis (Spearman's rank correlation). Second, we determine extreme outliers using a box-plot of PCT concentrations. We define very extreme outliers as Q3×3 IQR (interquartile range). Third, to evaluate the relative impact of serum levels of creatinine and urea on PCT concentrations, simple and multiple linear regressions were used. Linear regression analyses with and without very extreme outlier values were performed. Fourth, to determine the relative contribution of clinically important covariates (creatinine, urea, modified APACHE II, white cell counts, and chronic heart disease) on PCT concentrations, a multiple linear regression analysis was performed. Previously, we tested their interaction by using the product of the two explanatory variables in a multiple linear regression. For this, we included the new variables (creatinine×modified APACHE; creatinine×white cell counts; creatinine×chronic heart disease; modified APACHE II×white cell counts; APACHE II modified×chronic heart disease; white cell counts×chronic heart disease; Urea×modified APACHE II, urea×white cell count and urea×chronic heart disease) in a multiple linear regression analysis and only significant variables (p<0.05) were added to the final model.
Discrete variables are expressed as counts (percentages), and continuous variables are expressed as medians with the 25th–75th interquartile ranges (IQR). For patient demographics and clinical characteristics, the differences between the groups were assessed using the X2 test and Fisher's exact test for categorical variables and Student's t-test or Mann–Whitney U test or ANOVA (K-Wallis) for continuous variables. Data analysis was performed using IBM SPSS for Windows 22.0 software. All p values were two-sided, and statistical significance was defined as p<0.05.
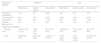
ResultsTwo thousand one hundred and thirty-two patients with PCR-confirmed influenza pneumonia were admitted to the 148 ICUs. PCT was measured in 972 (45.6%) patients at the time of ICU admission. A total of 633 (65%) patients were included in the study (Fig. 1). Among them, 571 (90.2%) did not develop AKI, whereas 52 (8.2%) and 10 (1.6%) were categorized as AKI I and II, respectively. Further details regarding renal function and clinical characteristics are presented in Table 1 and Table 1e (electronic material). PCT concentrations were higher in patients with AKI (2.62ng/mL [IQR=0.6–10.]) than in non-AKI patients (0.40ng/mL [IQR=0.13–1.20], p=0.002). AKI patients were older, had more major comorbidities, and were more severely ill, and had higher white cell counts upon ICU admission than those without AKI (Table 1e).
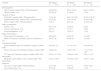
Characteristics of 633 patients included in the study according to renal function.
| Variable | AKI stage 0 (n=571) | AKI stage I (n=52) | AKI stage II (n=10) |
|---|---|---|---|
| Demographics | |||
| Age (in years), median (25th–75th percentiles) | 48 (38–59) | 58 (51–66.7)* | 60 (51.2–69.7)* |
| Gender (male), n (%) | 316 (55.3) | 31 (59.6) | 7 (70) |
| Severity of illness | |||
| APACHE II, median (25th–75th percentiles) | 13 (9–18) | 20.5 (15.2–25)* | 29 (20.5–30.2)* |
| Modified APACHE II, median (25th–75th percentiles) | 13 (9–18) | 18.5 (14–23)* | 26 (18.5–28)* |
| SOFA, median (25th–75th percentiles) | 5 (3–7) | 8 (6–10)* | 10.5 (8–12)* |
| Major comorbidities | |||
| COPD, n (%) | 100 (17.5) | 13 (25.0) | 2 (20) |
| Chronic heart failure, n (%) | 44 (7.7) | 7 (13.7) | 2 (20) |
| Immunosuppresion, n (%) | 52 (9.1) | 12 (23.1)* | 1 (10) |
| Major complications | |||
| Shock upon ICU admission, n (%) | 264 (46.2) | 35 (67.3)* | 10 (100)* |
| Need of mechanical ventilation upon ICU admission, n (%) | 444 (77.8) | 42 (80.8) | 10 (100) |
| Laboratory findings | |||
| Serum creatinine upon ICU admission (mg/dL), median (IQR) | 0.8 (0.6–1.0) | 1.7 (1.6–1.9)* | 3.2 (2.8–3.4)* |
| Serum urea upon ICU admission (mg/dL), median (IQR) | 33 (23–45) | 73 (53–103) | 111.5 (79.5–136)* |
| PCT upon ICU admission (ng/mL), median (25th–75th percentiles) | 0.40 (0.13–1.20) | 1.93 (0.6–10.9)* | 5.40 (1.1–9.7)* |
| White cell counts (WCC) (109/L), median (25th–75th percentiles) | 6.9 (4.3–10.6) | 10.9 (5.8–15.8)* | 9.0 (5.1–13.6) |
| Outcome | |||
| ICU LOS,a median (25th–75th percentiles) | 9 (4–18.2) | 8 (4–18) | 8 (5.5–16.5) |
| ICU mortality rate, n (%) | 93 (16.3) | 13 (25.0) | 1 (10) |
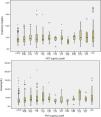
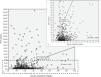
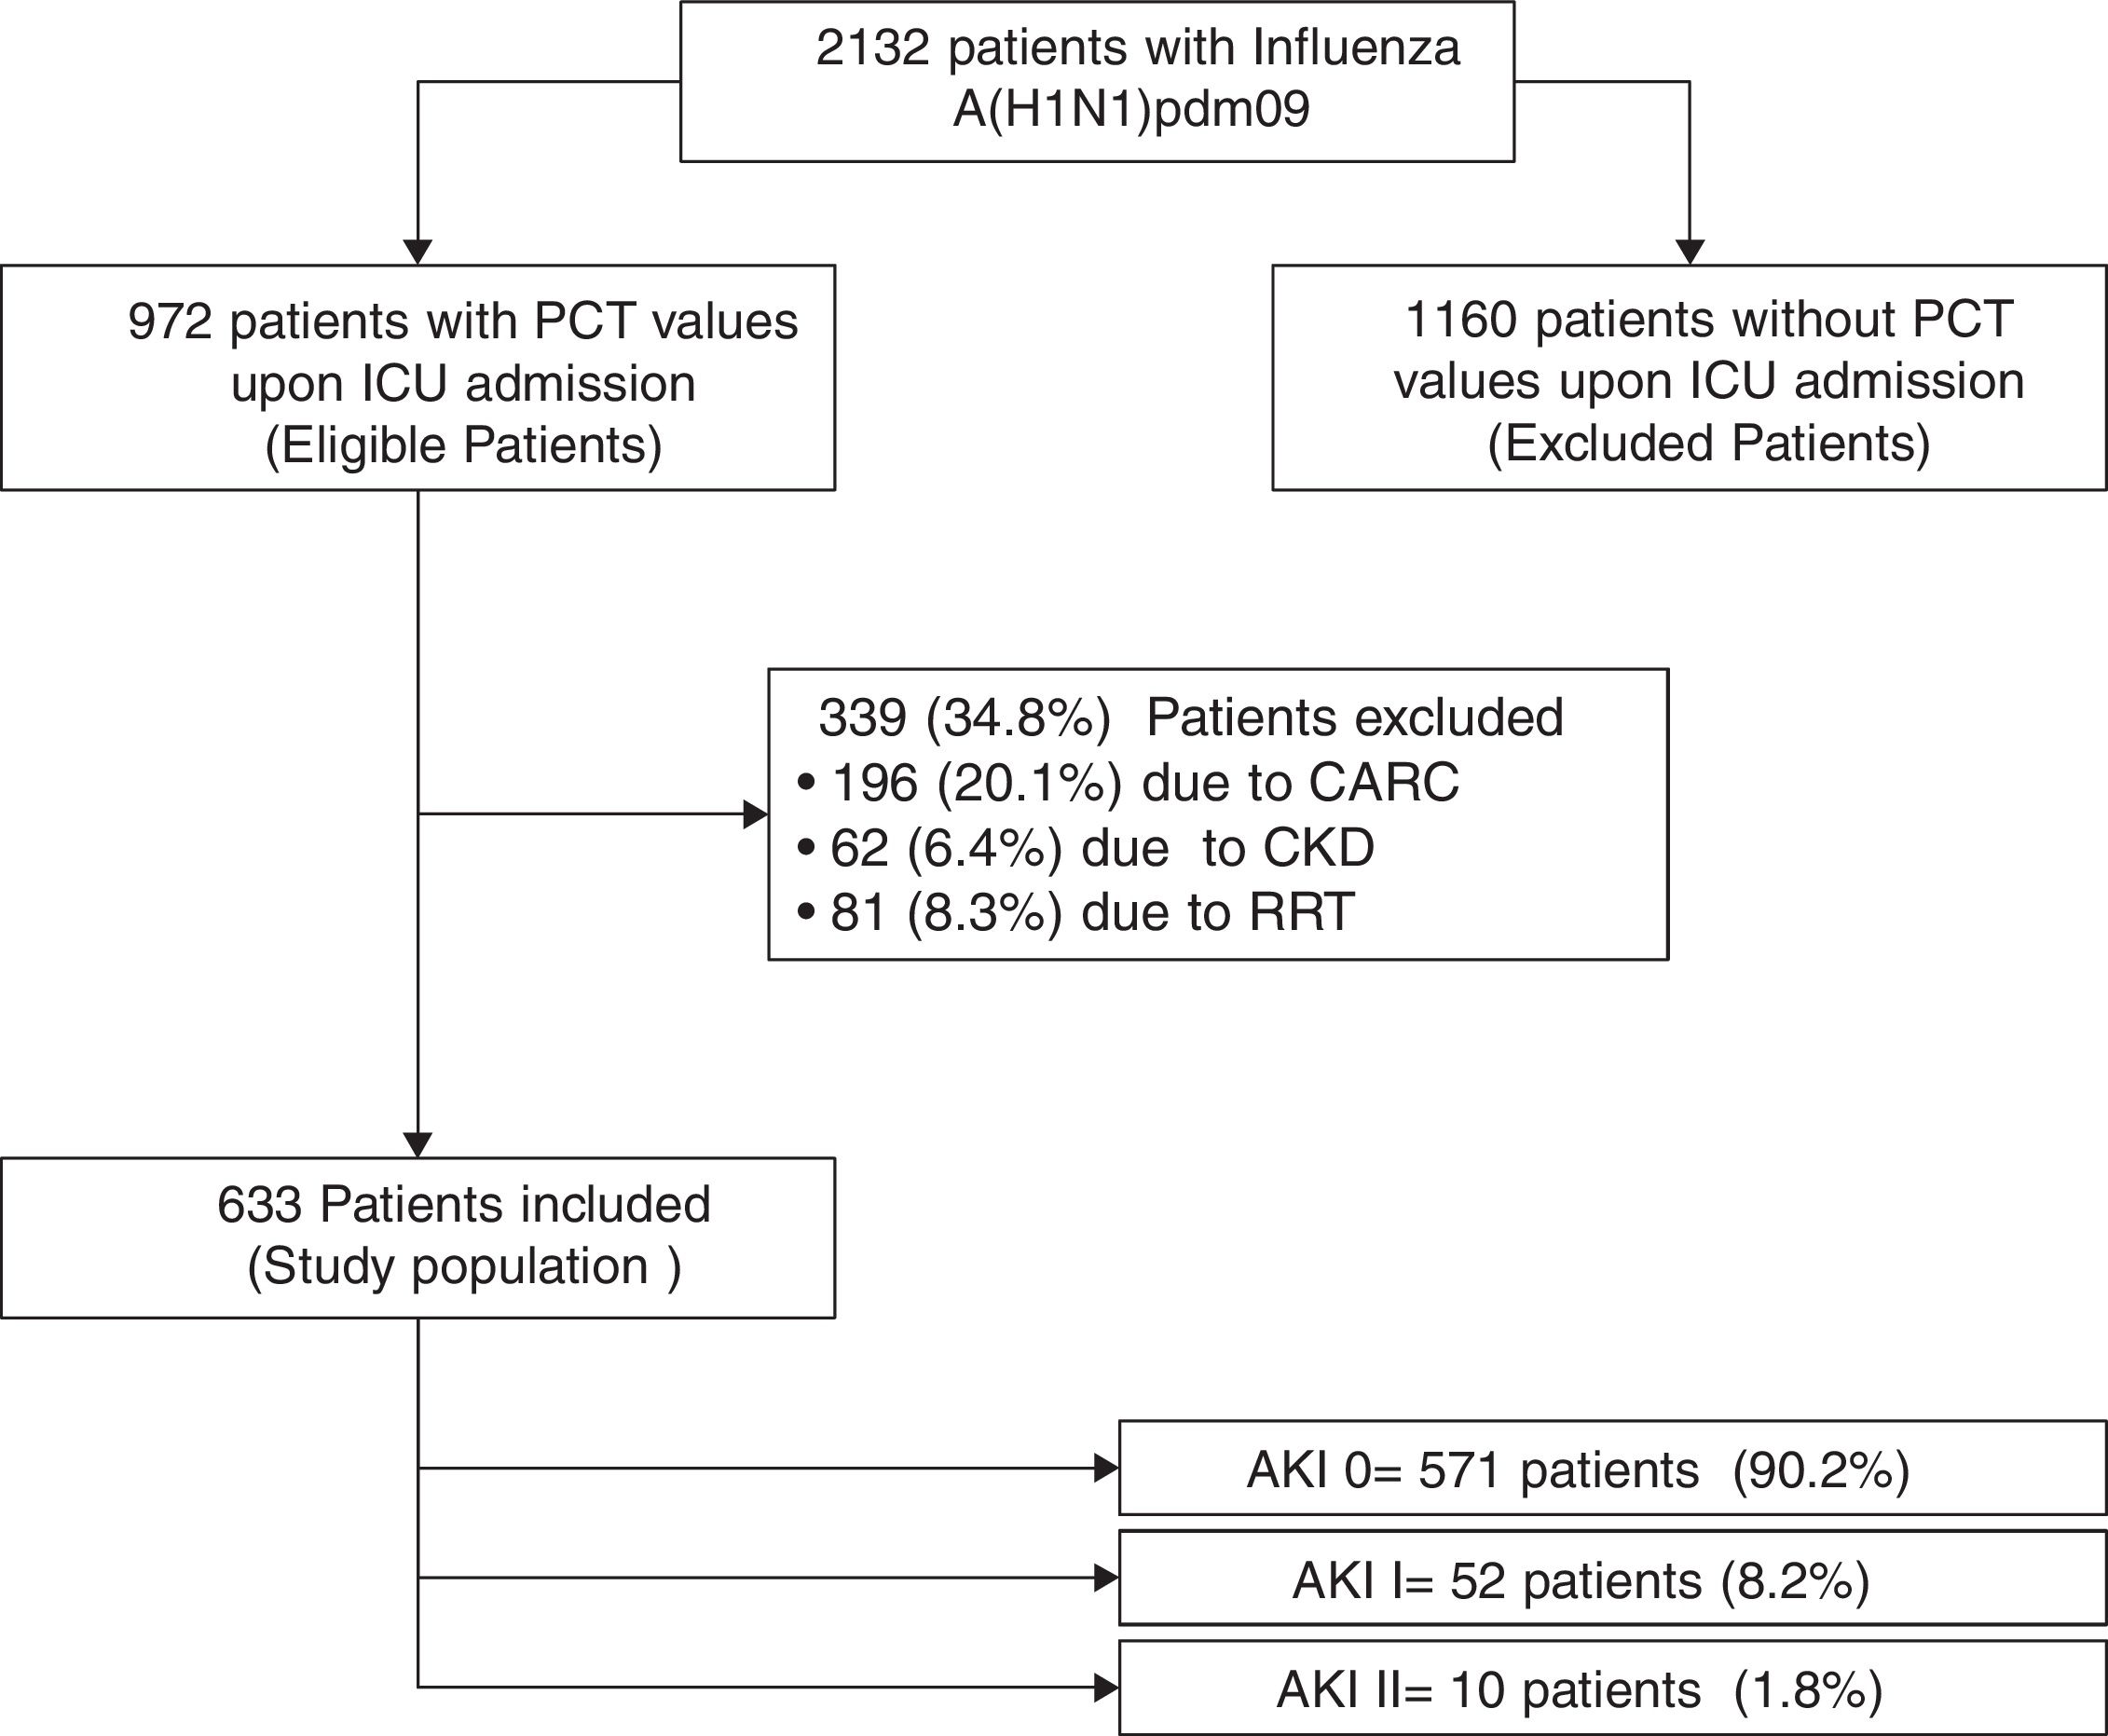
Patients had increased serum creatinine and urea levels according to PCT cut-off values (A/B and Table 2e [electronic material]). In overall population, we observed a significant, but weak correlation between both creatinine (rho=0.18; p<0.001, Fig. 3) and urea (rho=0.19; p=0.001, Fig. 4) levels and PCT concentration upon ICU admission.
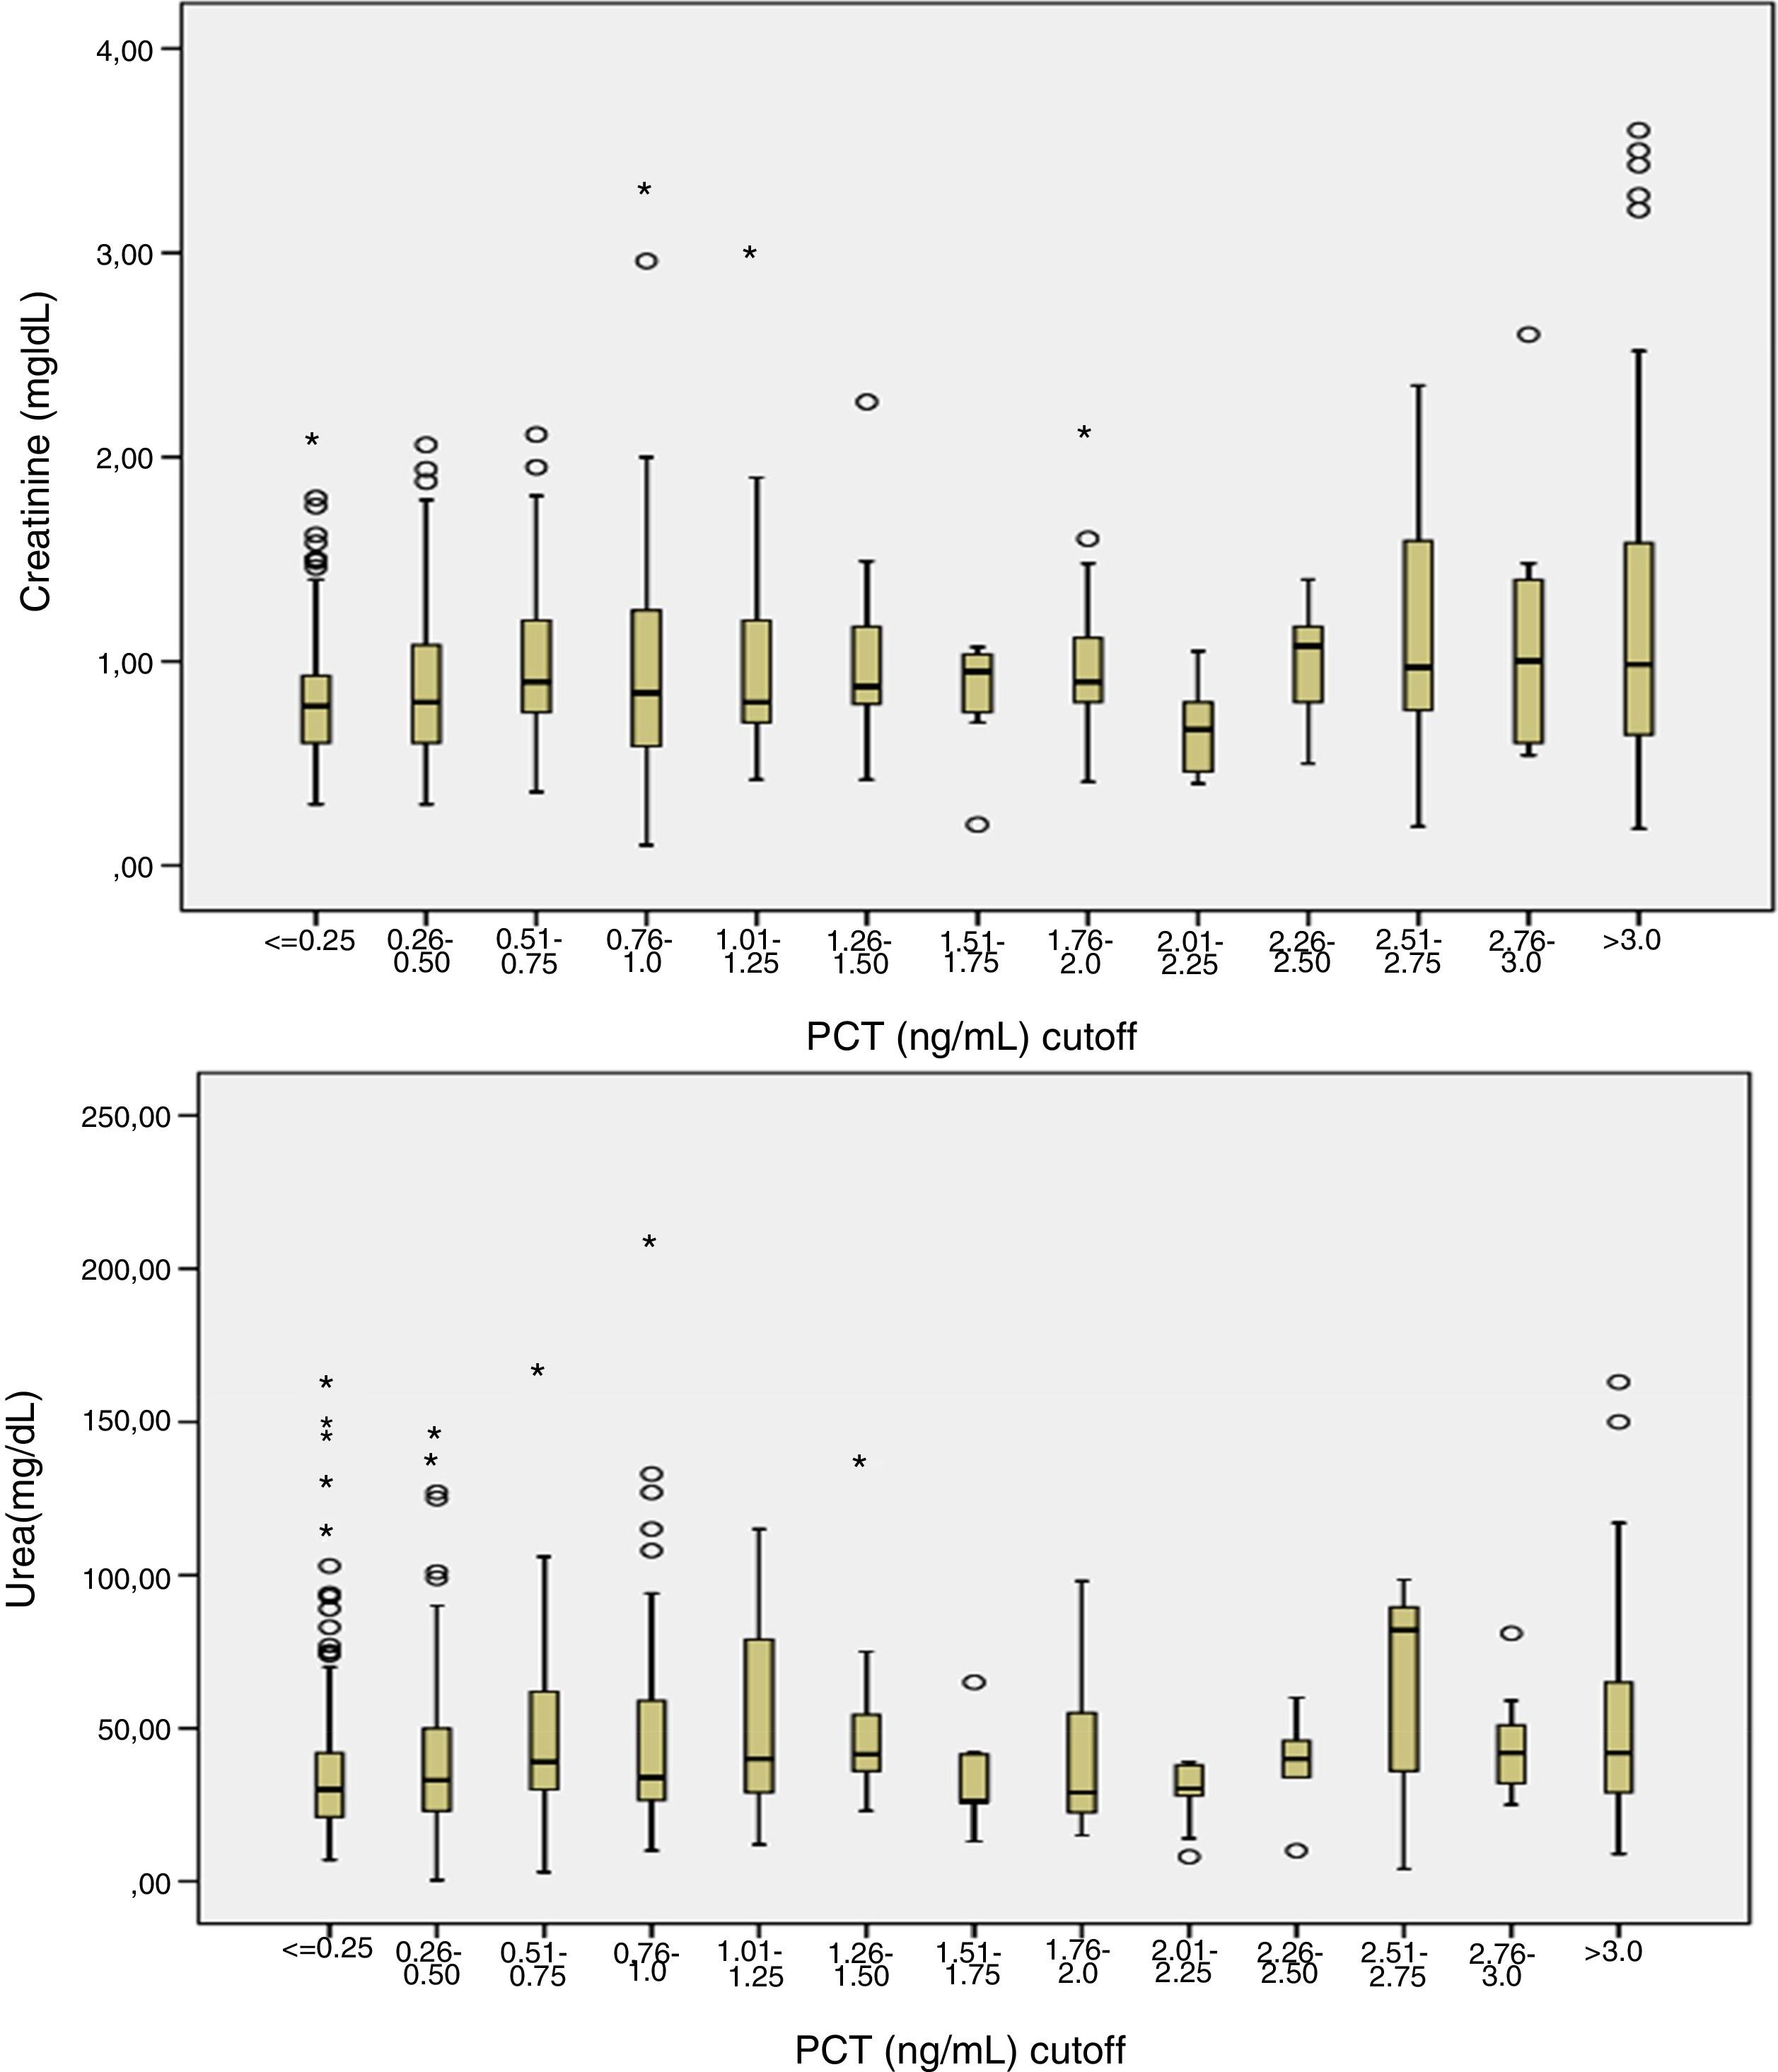
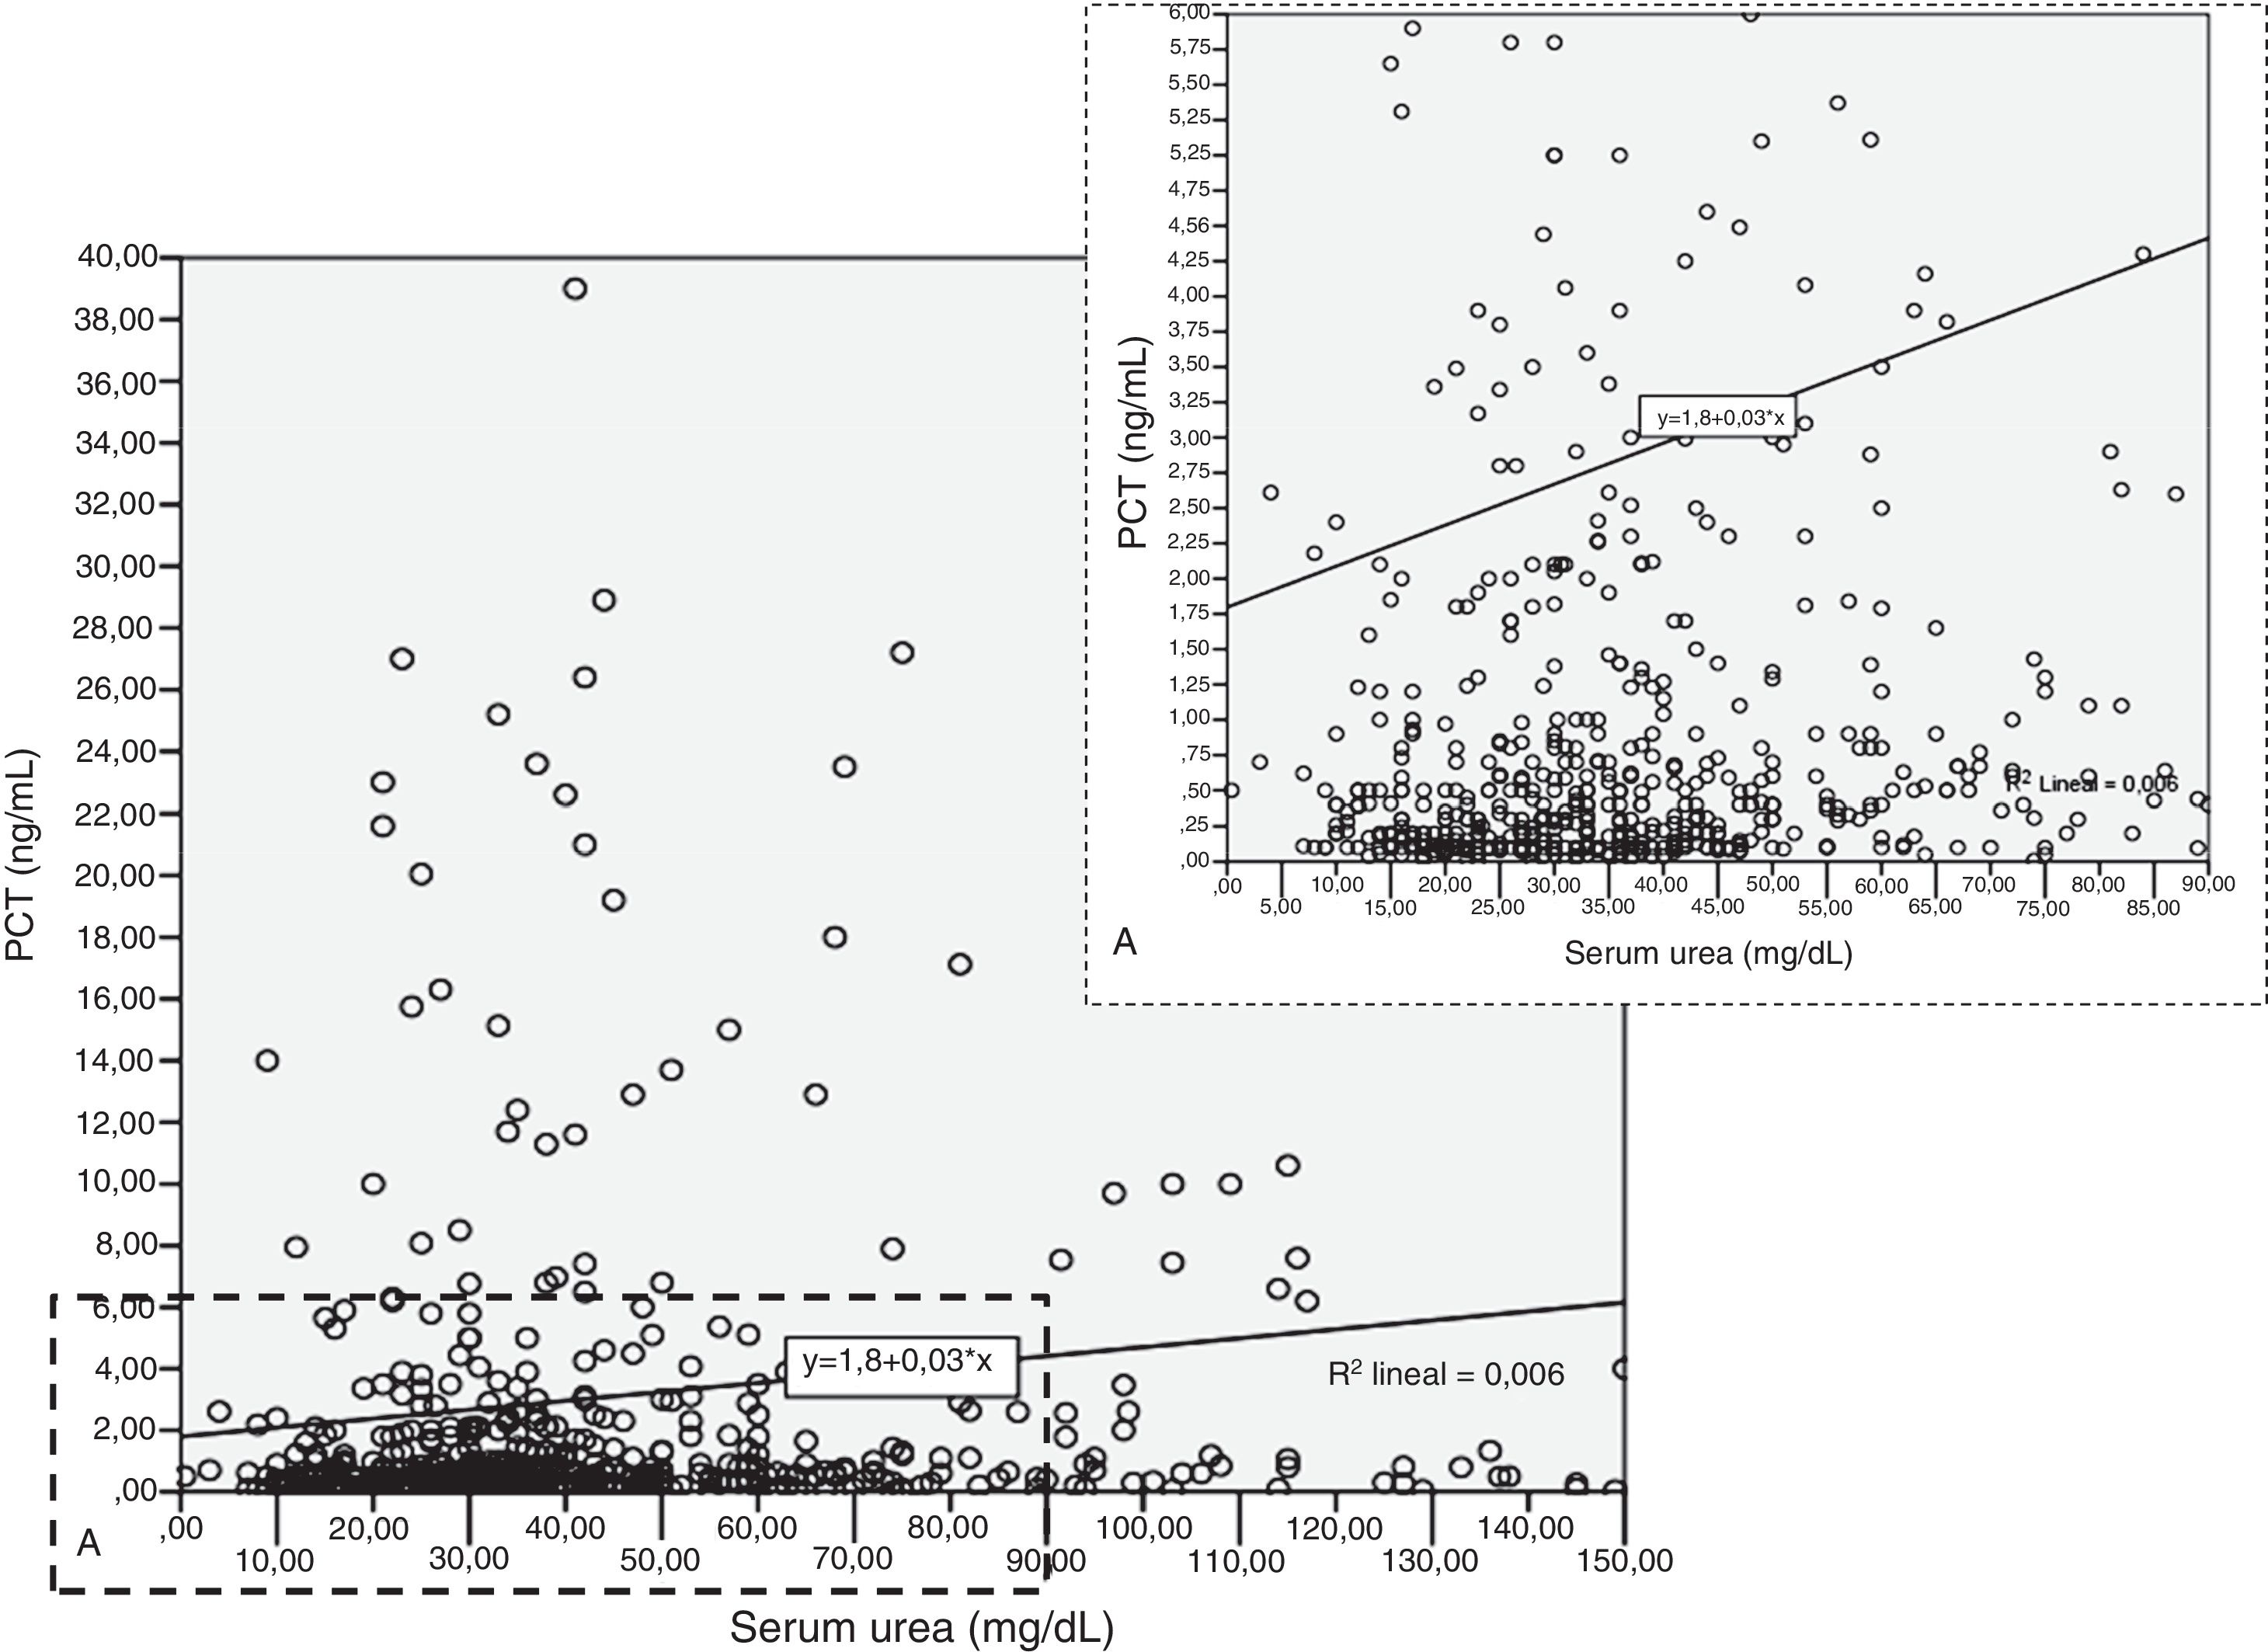
To evaluate the relation among serum creatinine/urea with PCT levels, we first conducted a linear regression analysis and the results are presented in Table 2. Using the standard outer fences formula, an extreme outlier was defined as PCT values >5.75ng/mL. A linear regression analysis without extreme outliers was performed and no differences were observed in respect of the initial analysis with extreme outliers (Table 2). For creatinine (without outlier values), R2 was 0.03 (SD=1.5), which suggests that the creatinine levels could explain only 3% of the variability of PCT. Similar results were obtained when logarithmic transformation of data was performed (R2=0.02, p<0.001; Figure 2e of the electronic material). On the other hand, R2 (without outliers) for urea was 0.018 (SD=1.52), which suggests that only 2% of the variability of PCT could be explained by the urea levels. Similar results were obtained when logarithmic transformation of data was performed (R2=0.010, p=0.013; Figure 3e electronic material). The results were similar when a regression analysis without outlier values was performed (Table 2).
Results based on correlation and simple linear regression analysis for creatinine and urea considering procalcitonin (PCT) as dependent variable.
| Regression statistics | Creatinine | Urea | ||||
|---|---|---|---|---|---|---|
| With outliers | Without outliers | Only outliers | With outliers | Without outliers | Only outliers | |
| Correlation coefficient (r) | 0.18 | 0.17 | 0.008 | 0.08 | 0.13 | 0.18 |
| R-squared (R2) | 0.03 | 0.03 | 0.000 | 0.006 | 0.018 | 0.000 |
| Adjusted R2 | 0.03 | 0.03 | −0.02 | 0.05 | 0.016 | −0.02 |
| Standard deviation (SD) | 9.9 | 1.5 | 26.4 | 10.0 | 1.52 | 26.4 |
| Regression parameters | ||||||
| Intercept (SD) | −0.592 (−2.29 to 1.10) | 0.456 (0.17–0.73) | 30.0 (13.6–46.4) | 1.798 (0.36–3.22) | 0.717 (0.49–0.93) | 28.7 (11.5–46.0) |
| Slope | 3.844 (2.22–5.46) | 0.61 (0.34–0.89) | −0.28 (−11.0 to 10.4) | 0.029 (0.001–0.57) | 0.007 (0.003–0.012) | 0.018 (−0.28 to 0.32) |
A multiple linear regression analysis was used to test the interaction between clinical and laboratory variables (Table 4e electronic material). Two sets of variables showed the best performance when the product of the two explanatory variables was analyzed (p<0.05): creatinine×APACHE II score (CrAP) p<0.001 and creatinine×white cell counts (CrWCC) p=0.009. Secondly, PCT (dependent variable), modified APACHE II score, serum creatinine, white cell counts, chronic heart disease, and the new variables (CrAP and CrWCC) were entered in the final model resulting in R2 slightly increasing to 0.046 (SE=10.0; p<0.001, Table 5e of the electronic material). The final model suggests that only 5% of the variability of PCT could be explained by the confounding variables and their interactions.
Impact of urea on PCT levels considering confounding factors and their interactionsNone of the new variables tested were found to be adequate predictor variables using multiple linear regression analysis (Table 6e electronic material); therefore, were not included in the final model. PCT (dependent variable), modified APACHE II score, urea, white cell counts, and chronic heart disease were entered in the final model showing an R2=0.013 (SE=10.2, p=0.08; Table 7e electronic material). These confounding factors or their interactions based on the final model could not explain the variability of the PCT.
DiscussionThe main conclusion of our study is that the contribution of renal dysfunction (assessed by creatinine and urea levels) on increased PCT concentration is poor. Although PCT values were increased in patients with AKI and creatinine, and urea correlated significantly with PCT, this correlation was very weak. Therefore, the relative contribution of renal dysfunction to PCT values is not greater than 5% in critically ill patients with influenza infection.
Very little is known about the elimination mechanisms of PCT; however, it is likely that renal function interferes with PCT values. Herget-Rosenthal et al.13 observed that serum PCT progressively increased in parallel to the deterioration of renal function. Importantly, although elevated, PCT levels in patients with chronic kidney disease stages I–IV did not markedly differ from those in healthy volunteers. Only in patients with chronic kidney disease stage V and those undergoing peritoneal dialysis, PCT concentrations were significantly higher when compared to healthy controls or patients with stages I–IV. The authors suggested that the progression of renal dysfunction and reduction in urine output could reduce the renal elimination of PCT. Dahaba et al.24 observed in non-septic uremic patients a mean PCT plasma concentration of 1.82 (0.39)ng/mL prior to the start of the first haemodialysis session. The authors suggested that uremia “per-se” is the principal origin of the increased concentrations of PCT; due to increased levels of serum cytokines. Importantly, this PCT concentration was lower than identified in our study, but our patients have a viral infection and the median value of PCT in patients without AKI was 0.4ng/mL as previously reported in another study.25 In contrast, Meisner et al.26 reported that renal elimination of PCT was not the mainstay mechanisms of PCT elimination.
PCT synthesis has been identified in various tissues and cell types such as leukocytes, specifically in peripheral blood mononuclear cells.27,28 Activated peripheral blood mononuclear cells and pro-inflammatory cytokines, such as tumor necrosis factor alpha (TNF)-α and interleukin 1 (IL)-1, are considered to play a key role in the inflammatory process and were also shown to induce PCT production.27 Some authors have observed a strong correlation between serum PCT and PCT released by peripheral blood mononuclear cells cultured in vitro28: we did not observe any correlation between white cell counts and PCT levels (rho=0.03; p=0.45 data not shown). It is likely that the increase of pro-inflammatory cytokines may be the link between inflammation and elevated PCT levels in patients with chronic kidney disease, or those receiving renal replacement therapy. However, the role of this pathway in AKI requires further characterization.
According to our results, we can expect predicted PCT values of 1.06ng/mL, 1.67ng/mL, 2.28ng/mL and 2.89ng/mL for creatinine values of 1, 2, 3, and 4mg/dL, respectively. Although we observed a median value of PCT (1.93ng/mL) similar to predicted PCT (1.67ng/mL) in AKI I patients, the median value of PCT in AKI II patients (5.40ng/mL) was higher than predicted PCT (2.28–2.89ng/mL) by creatinine concentration. We cannot explain this finding, but we might hypothesize that unknown variables other than renal dysfunction, such white blood cells, severity of illness, chronic heart disease or presence of bacterial infection, might play a pivotal role in PCT release/elimination. Although the relative contribution of renal dysfunction to PCT levels is low according to our data, the use of a different PCT cut-off, adjusted to the level of renal dysfunction could increase its diagnostic utility when assessing the probability of bacterial coinfection in this special population of patients with influenza and AKI.
Some limitations in the design of our study must be acknowledged. First, we only assessed renal function using creatinine and urea. Even though these biomarkers are well accepted subrogates of renal function, international consensus recommends using urinary outputs,20 unfortunately, these data was not collected during this study. Second, we examined the PCT levels only upon ICU admission. However, our main goal was to evaluate the relative contribution of AKI to basal PCT levels and not changes over time. Third, we excluded patients with AKI stage III and those who receive continuous renal replacement therapy because the PCT levels in these patients are difficult to interpret due to PCT release associated with microinflammation and/or blood contact with biocompatible membranes.3,4,8,22,24 Fourth, bacterial co-infection was ruled out by microbiology testing in respiratory samples and urinary antigens in patients under mechanical ventilation. However, we cannot certainly rule out bacterial coinfection in non-ventilated patient with only negative urinary antigens. Importantly, less than 20% of patients included in our study were non-ventilated. Finally, we considered only patients with influenza without bacterial infection and therefore our results cannot be generalized to all patients admitted to the ICU.
ConclusionOur study suggests that even though PCT levels in patients with AKI were higher, physicians should not continue thinking that high levels of PCT in patients with AKI are secondary to kidney dysfunction and should be aware of other causes of PCT elevation, including bacterial infections.
Funding/Role of the sponsorsThis study was supported by the Spanish Intensive Care Society (SEMICYUC) and Ricardo Barri Casanovas Foundation. The study sponsors have no role in the study design, data collection, data analysis, data interpretation, or writing of the report. The corresponding author (AR) had full access to all the data in the study and ultimate responsibility for the decision to submit it for publication.
Author contributionsAR, IML, ED, MB, JSV, MIR, DB, GS and LFR conceived and designed the study. All authors, apart from MIR, LFR and DB, contributed to the acquisition and local preparation of the constituent database.
AR, IML and MB contributed to database creation and standardization, design of statistical analyses, and data analysis.
AR, IML, JSV, MIR, AGE, LFR, ED, GS, and BS interpreted the data and wrote the paper.
All authors contributed to the critical examination of the paper for important intellectual content and approval of the final manuscript. Each author, apart from MIR, FLR and DB, acts as the guarantor of data from their individual center. AR acts as overall guarantor for the pooled analysis and the report.
Conflict of interestThe authors declare no conflict of interest.
We are indebted to H1N1 SEMICYUC/REIPI/CIBERES Working Group investigators and Andy Clarke for their English language assistance.