Cardiovascular failure is a common disorder in critical care medicine. When admitted to the ICU, patients with hemodynamic deterioration should be examined rapidly to correctly assess the main determinants of cardiovascular function (preload, afterload and contractility).
This review examines the assessment of contractility and afterload involving the combined use of several hemodynamic monitors, which allows different approaches to the same problem, with a view to improving the efficiency of management and treatment in critically ill patients.
La inestabilidad hemodinámica y la insuficiencia cardíaca son causas frecuentes de ingreso en la unidad de cuidados intensivos. El estudio de los determinantes de la función cardiovascular, fundamentalmente precarga, poscarga y contractilidad adquieren una importancia crucial en estas situaciones.
En este capítulo, se revisarán los conceptos de contractilidad y poscarga, así como sus métodos de evaluación. La tecnología disponible nos permite la combinación de varias técnicas diferentes de monitorización hemodinámica que aportan una información o un enfoque distinto sobre el mismo problema y nos ayudan a evaluar de una manera más precisa las alteraciones de la contractilidad y la poscarga. Esta información es útil para tomar decisiones diagnósticas y terapéuticas que ayuden a mejorar el pronóstico de los pacientes críticos.
Hemodynamic instability and heart failure are two frequent causes of admission to the Intensive Care Unit (ICU). Accordingly, the study of the determinants of cardiovascular function, fundamentally the loading conditions (preload and afterload) and contractility, is of crucial importance in order to adopt diagnostic and therapeutic decisions that can improve the patient prognosis. This chapter reviews the concepts of contractility and afterload, and the methods used to evaluate them in the ICU. The assessment of preload and the response to volume expansion have been addressed in another chapter of this series of updates in hemodynamic monitorization.
Critical patients can develop cardiac dysfunction secondary to a broad range of processes such as ischemic heart disease or septic shock. In addition, the drug treatments and ventilation strategies used in these patients can also trigger heart failure. Contractility indices should evaluate the capacity of the heart to generate work, and should be independent of preload and afterload. The traditional parameters such as stroke volume (SV), cardiac output (CO) and ejection fraction are useful in clinical practice for global hemodynamic assessment, but are very much dependent upon the loading conditions.
In recent years, different indices have been proposed for evaluating myocardial contractility. Although two-dimensional (2D) echocardiography and Doppler ultrasound can suggest a defect in cardiac contractility, their interpretation can be interfered with by the preload or afterload conditions. The existing technology allows us to combine different hemodynamic monitorization techniques offering different information or approaches to one same problem, and helping to more precisely evaluate the possible contractility alterations in critical patients.
On the other hand, an increase in afterload can produce hemodynamic instability in patients with valve disease or myocardiopathy, while a drop in afterload in situations such as sepsis can give rise to severe tissue hypoperfusion. Classical monitorization, in addition to the new hemodynamic monitorization systems and echocardiography, offers us information on ventricular afterload.
Contractility. Indices based on the ventricular pressure–volume ratioContractility can be defined as the capacity of the heart to generate external work independently of preload and afterload. Cardiac dysfunction is fundamentally the result of ventricular pump failure, with the production of insufficient hydraulic energy to maintain effective circulation.1–3
Changes in ventricular contractility are produced by intrinsic cellular mechanisms that regulate the interaction between actin and myosin, independently of the changes in sarcomere length. For this reason, a cardiac contractility or inotropic index should evaluate the capacity of the heart to generate work, and should be independent of the loading conditions. Most of the indices available at experimental or clinical level are partially dependent upon preload or afterload–a fact that may make the evaluation of contractility difficult.
Indices based on the ventricular pressure–volume ratio: Ventricular pressure–volume curves are plotted by relating ventricular pressure to ventricular volume during a complete cardiac cycle, and are a good tool for analyzing ventricular function (Fig. 1). The gradient of the ventricular pressure–volume curve at the end of systole, known as end-systolic elastance (Ees), is regarded as the reference contractility index, due to its relative independence of the loading conditions and sensitivity to changes in inotropism. Other parameters derived from the pressure–volume curve, such as the stroke work (SW)–ventricular end-diastolic volume ratio and the maximum index of ventricular pressure change (dP/dt max)–ventricular end-diastolic volume ratio, have also been shown to be good contractility estimators.4–7
Ventricular pressure–volume loop during a cardiac cycle. SV is the difference between end-diastolic volume (EDV) and end-systolic volume (ESV). The area under the curve represents SW. Ees is the gradient of the end-systolic curve of the different loops generated in several cardiac cycles.
Ees, end-systolic elastance; ESP, ventricular end-systolic pressure; SW, stroke work; SV, stroke volume; EDV, end-diastolic volume; ESV, end-systolic volume.
The determination of Ees requires the generation of different loops of the pressure–volume curve through a reduction of preload (occlusion of the inferior vena cava, treatment with nitroprussiate) or an increase in afterload (administration of vasopressor drugs) (Fig. 2). The generation of complete systolic and diastolic data requires invasive instrumentation of the left ventricle for the simultaneous estimation of pressure and volume measures – which complicates clinical determination of the indices derived from the pressure–volume ratio.5,6
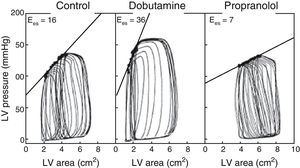
The use of echocardiography with automatic margin detection could facilitate the determination of Ees, since it allows semiautomatic measurement of the area of the left ventricle. Consequently, the changes in arterial pressure or invasive ventricular pressure, together with the changes in the area of the left ventricle could be used to generate pressure-area loops and thus obtain Ees almost on-line8,9 (Fig. 3). In addition, the reduction of preload with the use of a continuous positive airway pressure (CPAP) of 5mmHg–a routine technique often used in the ICU–could prove equivalent to occlusion of the inferior vena cava, according to a recent experimental animal study, though there is not enough clinical evidence to warrant its systematic application.10
Example of different pressure-area loops, showing an increase in Ees with dobutamine and a decrease with propranolol, consistent with changes in contractility (Adapted from Mandarino et al.20).
It must be taken into account that although the parameters derived from the ventricular pressure–volume ratio constitute the reference contractility indices, and the new technologies partially facilitate their measurement at the patient bedside, they cannot be used in unstable patients, since alteration of the loading conditions through occlusion of the inferior vena cava and the administration of vasodilator or vasoactive drugs could trigger a life-threatening situation in hemodynamically unstable subjects.
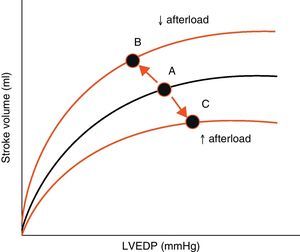
AfterloadAfterload is defined as the “load” against which the heart must contract in order to eject the blood volume. Afterload is an important determinant of cardiac output under given conditions of contractility and preload. The magnitude of myocardial fiber shortening, and thus the corresponding stroke volume ejected by the ventricle, are inversely related to the ventricular afterload (Fig. 4).
Effect of changes in afterload on the Frank-Starling curves. An increase in afterload lowers the stroke volume and increases left ventricle end-diastolic pressure (LVEDP) (displacement of points A to C). A decrease in afterload increases stroke volume and lowers LVEDP (displacement of points A to B).
LVEDP, left ventricle end-diastolic pressure.
Although aortic pressure constitutes one of the main components of ventricular afterload, there is still debate as to which parameter is best for estimating afterload. One way to assess ventricular afterload could be the estimation of systolic ventricular wall stress, which is proportional to the intraventricular pressure and to the radius of the ventricle, divided by the wall thickness (equation of Laplace: stress=P×r/2h). The use of echocardiography may facilitate the determination of this parameter.11
In clinical practice, the most common way to evaluate afterload is by calculating the systemic or pulmonary vascular resistance (VR), which offers information on vascular tone.12 It is important to take into account that the arterial VR value only represents opposition or resistance to a constant flow, which is found fundamentally at arteriolar level, where the compensating mechanisms that control vasomotor tone keep the perfusion pressure within a physiological range. In this context, a complete description of global arterial impedance is not provided, due to the fluctuating nature of blood flow and arterial pressure.
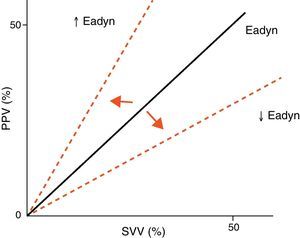
Arterial tone and its changes over time or as a result of vasoactive drug treatment can be determined at the patient bedside using perfusion pressure versus blood flow measures. The resulting ratio is referred to as arterial elastance (Ea), since it is the ratio between the pressure produced (pulse pressure, systolic blood pressure) and the stroke volume, rather than a measure of the sustained effect of a constant flow within a resistance circuit. Since blood flow is phasic, not constant, elastance is a more precise measure of arterial tone than arterial resistance. Likewise, the evaluation of arterial tone requires us to know not only the absolute pressure and flow values but also the relationship between the changes in blood flow and arterial pressure. For this reason, we can use the changes in pulse pressure and in stroke volume instead of pulse pressure/systolic blood pressure and stroke volume. The ratio between pulse pressure variation (PPV) and stroke volume variation (SVV) (parameters commonly used for evaluating the response to volume expansion) during a respiratory cycle is known as dynamic arterial elastance (Eadyn), and affords a functional evaluation of arterial tone. The normal Eadyn value (No.) is close to 1 (Fig. 5). The presence of a decreased or increased vasomotor tone would cause the Eadyn value to be smaller or greater than 1, respectively.3,13,14
The relationship between Ees and Ea, which represents ventricle-arterial “coupling”, has been used even in animal experimentation and in some clinical protocols for evaluating the mechanical-energy properties of the left ventricle.15
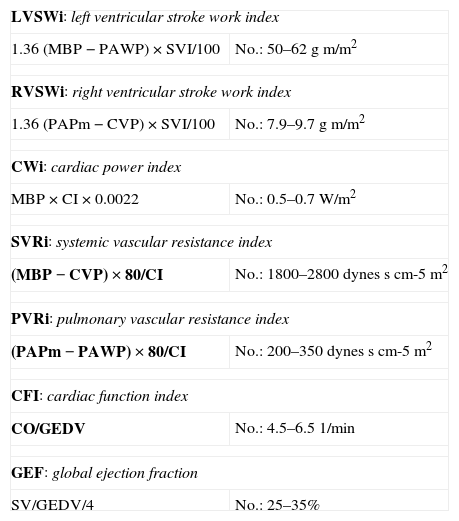
Contractility estimating indices used in the ICUParameters derived from classical hemodynamicsThe introduction of the pulmonary artery catheter by Swan and Ganz in 1970 was a key turning event in monitorization in Intensive Care Medicine. Indeed, this catheter has been the most widely used hemodynamic monitorization technique in the last decades. The Swan-Ganz catheter has greatly contributed to improve our knowledge of cardiovascular function by allowing us to determine intravascular pressures (pulmonary artery pressure, right atrial pressure and pulmonary artery wedge pressure), calculate cardiac output using the thermodilution method, and gain access to mixed venous blood. On the other hand, since its introduction, the catheter has undergone modifications that have even further expanded the information it is able to provide–making it possible to determine the ejection fraction and right ventricle volumes, mixed venous oxygen saturation (SvO2) and cardiac output on a continuous basis. It now moreover offers the possibility of incorporating electrocatheters positioned in the right atrium and ventricle.12 At present, controversy over the use of the pulmonary artery catheter and the technological advances of recent years have led to the development of new hemodynamic monitorization systems that also offer us some of these “old” parameters and at the same time are able to determine “new” cardiovascular function parameters (Table 1).
Hemodynamic parameters.
| LVSWi: left ventricular stroke work index | |
| 1.36 (MBP−PAWP)×SVI/100 | No.: 50–62gm/m2 |
| RVSWi: right ventricular stroke work index | |
| 1.36 (PAPm−CVP)×SVI/100 | No.: 7.9–9.7gm/m2 |
| CWi: cardiac power index | |
| MBP×CI×0.0022 | No.: 0.5–0.7W/m2 |
| SVRi: systemic vascular resistance index | |
| (MBP−CVP)×80/CI | No.: 1800–2800dynesscm-5m2 |
| PVRi: pulmonary vascular resistance index | |
| (PAPm−PAWP)×80/CI | No.: 200–350dynesscm-5m2 |
| CFI: cardiac function index | |
| CO/GEDV | No.: 4.5–6.51/min |
| GEF: global ejection fraction | |
| SV/GEDV/4 | No.: 25–35% |
CO, cardiac output; CI, cardiac index; SVI, stroke volume index; MBP, mean blood pressure; PAPm, mean pulmonary artery pressure; PAWP, pulmonary artery wedge pressure; CVP, central venous pressure; GEDV, global end-diastolic volume.
Traditionally, the parameter most widely used in the ICU for evaluating ventricular function has been cardiac output (stroke volume×heart rate). However, it is important to remember that cardiac output depends on preload (Frank-Starling mechanism) and afterload, as well as on contractility. Consequently, it should be regarded as more of an indicator of global cardiac function than as a contractility estimating index. Furthermore, situations such as septic shock can present an elevated cardiac output despite the existence of severe contractility alterations, as evidenced upon incrementing the vascular tone, which results in the lowering of both the ejection fraction and cardiac output.
The joint use of cardiac output and filling pressures (right atrial pressure, pulmonary artery wedge pressure) yields a series of hemodynamic patterns that can be very useful in clinical practice, and might improve the evaluation of the contractile function. In this context, severe left heart failure is characterized by a low cardiac output and a high pulmonary artery wedge pressure. The most characteristic example of the usefulness of the hemodynamic patterns is the Forrester classification,16 which classifies patients with acute myocardial infarction into four categories based on the cardiac index (greater or lesser than 2.2l/min/m2) and pulmonary artery wedge pressure (greater or lesser than 18mmHg). This classification allows the adoption of treatment strategies, and moreover offers prognostic stratification of the patients.
In any case, an increase in ventricular filling pressure does not necessarily indicate a decrease in ventricular contractility, and instead may reflect an alteration in ventricular compliance secondary to different factors: pericardial disease, restrictive disease, diastolic dysfunction, cardiac hypertrophy or myocardial ischemia. For this reason, the information obtained from studying cardiac output and filling pressures is not enough to establish the mechanisms (alteration of ventricular compliance, diminished contractility, increased afterload, etc.) underlying the clinical and hemodynamic findings of the patient.
Another parameter classically used in the ICU for the evaluation of contractility at the patient bedside is stroke work (SW) (an approximation of the information obtained from the ventricular pressure–volume curves), defined as the product of stroke volume and the difference between mean blood pressure (MBP) and pulmonary artery wedge pressure. This index is also dependent upon preload, but is independent of afterload. As a result, the recording of a low SW could indicate a reduction in cardiac contractility in situations in which volume expansion has been adequate. Many studies in relation to heart failure, ischemic heart disease and sepsis have used this parameter as an indicator of altered contractility, and it has even been related to the patient prognosis.17,18
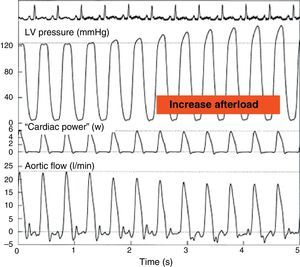
Cardiac power and cardiac reserveThe heart may be regarded as a mechanical pump capable of generating hydraulic energy. Consequently, the capacity of the pump can be expressed as cardiac power (CP), defined as the product of the flow and pressure generated by the heart.19 Thus, CP is the product of cardiac output and mean blood pressure determined simultaneously. The corresponding physical unit is joules (J)/s or watts (W). CP is not significantly influenced by afterload, though it may vary directly with the preload; we therefore should make sure that the heart of the patient is not dependent upon preload before affirming that CP, and therefore pump function, is diminished.
On the other hand, maximum CP or maximum ventricular power is an index of the ejection phase, calculated as the instantaneous product of flow and pressure at the time of maximum flow through the aortic valve and maximum aortic pressure. This parameter has been found to offer good correlation to Ees20 (Fig. 6). The development of echocardiographic techniques for the estimation of aortic flow and the registry of aortic pressure has allowed the semi-invasive determination of maximum CP under clinical conditions. The sensitivity to preload can be corrected on dividing this parameter by (end-diastolic volume2) or (end-diastolic area3/2). However, in clinical practice it has become more popular to use CP employing mean blood pressure and cardiac output, since these are parameters commonly used in the ICU, and the acquisition of maximum CP requires more sophisticated techniques.
Effect of an increase in afterload through partial occlusion of the aorta upon cardiac power. The pressure in the left ventricle increases and the flow in the aorta decreases secondary to the rise in afterload, but the cardiac power remains constant (Adapted from Mandarino et al.20).
LV, left ventricle.
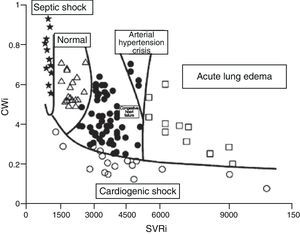
Although the concept of CP is over 100years old, the results of clinical and experimental research, as well as the revision of physiopathological concepts in the field of heart failure, have led to renewed interest in this contractility estimator.19,21,22 It has even been proposed that CP and systemic vascular resistance values can be used represented in two-dimensional plot format for the hemodynamic diagnosis and follow-up of patients with acute heart failure22 (Fig. 7).
Figure showing the classification of the hemodynamic condition of patients with different acute heart failure syndromes according to CWi and SVRi (Adapted from Cotter et al.22).
CWi, cardiac power index; SVRi, systemic vascular resistance index.
On the other hand, the maximum or peak cardiac power index (CPi) after drug stimulation or exercise has been used in recent years to evaluate patients with acute and chronic heart failure. In this sense, many studies have shown that the peak CPi reached during exercise or on administering dobutamine is a more potent predictor of the outcome of patients with chronic heart failure than oxygen consumption, cardiac output, pulmonary artery wedge pressure or the ejection fraction determined by echocardiography.19 These results have been confirmed in critical patients with cardiogenic shock. Tan and Littler17 found that the hemodynamic evaluation of cardiac reserve (the difference between peak CP and basal CP) through stimulation with dobutamine clearly differentiated survivors from non-survivors. The patients with a peak CP of under 1W (the normal basal value for a healthy adult) or a stroke work index of 0.25J/m2 died, while those with higher values survived for over one year. A posterior confirmation of the prognostic value of CP has recently been published.23 The mentioned study determined CP and other hemodynamic parameters in 406 patients with cardiogenic shock included in the SHOCK registry and subjected to pulmonary artery catheter monitorization. Cardiac power was found to be the hemodynamic parameter most closely correlated to mortality in patients with cardiogenic shock.
Echocardiographic parametersEchocardiography is a useful tool for the evaluation of cardiovascular function in the critical patient, since it offers images in real time, at the patient bedside, and in a noninvasive (transthoracic echocardiography, TTE) or minimally invasive manner (transesophageal echocardiography, TEE); as a result, it is increasingly used in the ICU. The study of ventricular function is one of the main indications of echocardiography in the critical patient.24–26
Echocardiography allows us to estimate cardiac output, pulmonary artery pressure, filling pressures and different predictors of volume expansion response. In addition, it allows us to obtain contractility estimators such as the shortening fraction and left ventricle ejection fraction (LVEF), the maximum velocity of the tissue Doppler S-wave at mitral or tricuspid annular level, and the tricuspid annular plane systolic excursion (TAPSE) value for evaluating right ventricular function. The determination and usefulness of these echocardiographic parameters have been commented in the specific chapter on echocardiography in this series of updates.27
The LVEF is the parameter most commonly used for evaluating contractility, though it is also dependent upon afterload. There are two common clinical situations, severe aortic stenosis and severe chronic mitral valve insufficiency, in which LVEF does not reflect the true condition of the ventricle. In cases of severe aortic stenosis, LVEF is often depressed, but increases once the obstruction of flow is resolved. This situation represents a case of important modification of afterload that falsely lowers ventricular function. On the other hand, mitral valve insufficiency represents a situation of low afterload that falsely increases LVEF. In other processes characterized by an important alteration of afterload, LVEF likewise might not be a good estimator of contractile function.
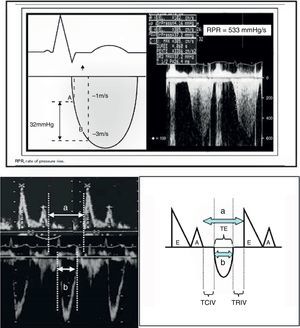
Echocardiography also offers other parameters that are less dependent upon the loading conditions, such as dP/dt max and the Tei index (Fig. 8). In this context, dP/dt max is one of the contractility indices classically used in animal experimentation due to its independence of afterload. At present, ultrasound allows us to obtain the index at the patient bedside. The maximum dP/dt value is recorded before opening of the aortic valve, i.e., at the end of the isovolumetric period; the influence of afterload is therefore limited. The determination of dP/dt requires the presence of mitral valve insufficiency in order to measure the time needed for the regurgitation jet to increase its velocity from 1 to 3m/s (No.: 1200mmHg/s). This index is used in the prognostic evaluation of patients with congestive heart failure when its value is less than 600mmHg/s. Another contractility estimator is the Tei index. This index is relatively independent of preload and afterload (isovolumetric contraction time+isovolumetric relaxation time/ejection time, No.: 0.30–0.38), and requires placing the echocardiographic sample volume in the left ventricle between the mitral valve and the aortic valve (apical 5-chambers), in order to obtain the aortic ejection flow and the mitral filling flow.24,26
a. Calculation of dP/dt max. The figure shows the continuous Doppler registry through the mitral valve in the study of mitral valve insufficiency, and the time measurement scheme required to increase the velocity from 1m/s to 3m/s.
dP/dt=pressure×time increment=(4×32−1×12/measured time).
b. Tei index. The figure shows the mitral valve filling and aortic ejection velocities needed for calculating the index.
Tei index: (a−b)/b.
a: time from mitral valve closure to aperture.
b: ET.
a−b: TRIV+TCIV.
TCIV, isovolumetric contraction time; ET, ejection time; TRIV, isovolumetric relaxation time.
Based on transpulmonary thermodilution, the PiCCO (Pulsion Medical System) monitoring system allows us to calculate cardiac output (CO) and the blood volume contained in the four heart chambers at the end of diastole, referred to as the global end-diastolic volume (GEDV). The ratio between CO and GEDV is called the cardiac function index (CFI), and the ratio between stroke volume (SV) and GEDV/4 is referred to as the global ejection fraction (GEF); both ratios can easily be obtained at the patient bedside.
Combes et al.28 reported a significant correlation between these indices and the left ventricle area shortening fraction (ASF) determined by TEE in a population of critical patients. In addition, these authors found that CFI>4min−1 and GEF>18% estimated ASF≥40% (sensitivity 86% and 88%, specificity 88% and 79%, respectively). This study excluded patients with right ventricle dysfunction, and on the other hand was not designed to evaluate the response of CFI and GEF to inotropic stimulation.
A study has recently been published, exploring whether the indices derived from thermodilution are good estimators of contractility, based on an analysis of their response to inotropic stimulation and volume expansion.29 The main results obtained were that CFI is not altered by volume expansion, while dobutamine infusion significantly increases the baseline CFI value by 29±22%–thus indicating that this parameter may be a good contractility estimator. Similar results were obtained with GEF. Likewise, a significant correlation was found between CFI and LVEF (r: 0.67, p<0.0001), as well as between GEF and LVEF (r: 0.63, p=0.0001). A CFI value of≤4.1min−1 estimated a LVEF of 45% with a sensitivity of 89% and a specificity of 67%, while CFI≤3.2min−1 estimated a LVEF of <35% with a sensitivity of 81% and a specificity of 88%. The authors of the study concluded that CFI should serve to alert clinicians to the probable presence of altered left ventricle contractility, and echocardiography consequently should be used to evaluate ventricular function. Furthermore, CFI could be a useful tool for evaluating the hemodynamic effects of dobutamine. On the other hand, in patients with right ventricle dilatation, CFI may underestimate LVEF, and echocardiography could serve to discard right ventricle involvement.
Lastly, a very recent experimental study has also found CFI and GEF to be good estimators of cardiac contractile function, though they may be dependent upon preload in situations of severe hypovolemia.30
Usefulness of natriuretic peptidesIn response to both volume and pressure overload, the ventricular cardiomyocytes secrete a proteic pro-hormone called pro-Brain Natriuretic Peptide (pro-BNP), which is hydrolyzed to form two peptides: an active form, called Brain Natriuretic Peptide (BNP), and an inactive form known as NT-proBNP (aminoterminal peptide of proBNP), with half-lives of 20 and 120minutes, respectively.31 BNP plays an important role in heart failure, acting as an angiotensin II, norepinephrine and endothelin counter-regulating hormone–inhibiting their production and acting as a vasodilating and diuretic hormone.31
The usefulness of BNP and NT-proBNP as biomarkers for the identification of dyspnea of cardiac origin in the emergency care setting has been extensively documented.32,33 Levels of BNP>100pg/ml or of NT-proBNP>450pg/ml have shown high sensitivity and specificity in diagnosing heart failure. Elevated plasma concentrations of both peptides have been described in both systolic and diastolic left ventricle failure, as well as in situations of right-side pressure overload (pulmonary thromboembolism, cor pulmonale and primary pulmonary hypertension).34 Their role in other scenarios such as the ICU is less clear.
The use of the natriuretic peptides (NPs) in critical patients is conditioned by the high prevalence of confounding factors that can raise the peptide levels in the absence of cardiac dysfunction: patient age, the female gender, a decrease in glomerular filtration, brain damage such as subarachnoid bleeding, a positive fluid balance, and mechanical ventilation with PEEP.34
In critical patients, the NPs have been shown to be useful as a screening tool for discarding cardiac dysfunction, with negative predictive values of up to 96% referred to a cutoff point which different studies have defined as 150pg/ml.35,36 Patients with dysfunction as established from echocardiography have significantly higher BNP levels than patients without dysfunction: 330pg/ml (interquartile range [IQR]: 142–749) versus 115pg/ml (IQR: 50–197) (p<0.0001)–the values being higher in patients with systolic dysfunction than in those with any degree of diastolic dysfunction: 1100pg/ml (IQR: 275–1240) versus 263 (IQR: 126–696) pg/ml (p<0.005).
The plasma BNP concentrations in patients with left ventricle dysfunction and heart failure have been successfully correlated to the left ventricle filling pressures (r=0.72).37 However, cohort studies involving heterogeneous critical patients have shown a significant yet poor linear correlation between NP concentration and pulmonary capillary wedge pressure (BNP r=0.40; NT-proBNP r=0.32).38 Both BNP and NT-proBNP can be elevated in a number of cardiac disorders, independently of the left ventricle filling pressures (depressed left ventricle ejection fraction, left ventricle hypertrophy, depressed right ventricle function, significant mitral valve insufficiency or severe aortic stenosis). Both NPs offer high sensitivity but low specificity in differentiating elevated left ventricle pressures.38
Despite the existence of a clear clinical need, the available data are only beginning to define the potential role of NPs in routine clinical practice in the ICU. In the meantime, we should take advantage of their non-invasive nature in screening for ventricular dysfunction and in evaluating the left ventricle filling pressures.
Afterload estimating indices in the ICUParameters derived from hemodynamic monitorizationThe estimation of afterload in the ICU traditionally has been based on the determination of the systemic or pulmonary vascular resistances using the pulmonary artery catheter. The current state of technological development allows us to use other hemodynamic monitorization systems capable of determining cardiac output and the systemic vascular resistances in a less invasive manner.
On the other hand, there are monitorization systems that allow us to obtain PPV and SVV on a continuous basis, thereby facilitating the evaluation of response to volume expansion, and offering the possibility of calculating Eadyn (PPV/SVV) as an estimator of arterial tone. This information can be very useful in clinical practice for the treatment of situations of hemodynamic instability. In this sense, Pinsky3,13 has proposed a treatment algorithm for application in these situations, based on functional hemodynamic monitorization which on one hand makes use of PPV and the SVV (evaluation of preload dependency and response to volume expansion), and on the other hand uses Eadyn (assessment of vasomotor tone). The algorithm facilitates the decision to administer volume, vasopressor drugs or inotropic agents depending on the information obtained. This algorithm has not yet been validated in the clinical setting. Lastly, Monge Garcia et al.14 have recently published a study in which Eadyn was found to predict the response to volume expansion in preload-dependent patients with acute circulatory failure. An Eadyn value of 0.89 differentiates those patients who will increase their mean blood pressure by 15% after the administration of volume, with a sensitivity of 94% and a specificity of 100%. The authors concluded that from the practical viewpoint, those patients with Eadyn <0.89 should receive vasopressor drugs together with the administration of fluids to increase their mean blood pressure (MBP), while Eadyn≥0.89 would indicate that volume expansion alone could increase arterial pressure without the need for vasopressors.
Echocardiographic parametersEchocardiography allows us to estimate the systemic and pulmonary vascular resistances. In the presence of mitral valve insufficiency, Doppler echocardiography is able to identify patients with systemic vascular resistance SVR>14 wood (>1120dynesscm−5), with good correlation to the data obtained from invasive Swan–Ganz catheterization (sensitivity 70%, specificity 70%), if the ratio between the maximum flow velocity detected in mitral valve insufficiency (Vmax MI) and the integral of the left ventricle outlet tract velocity (ITVlvot) is >0.27 (Vmax MI/ITVlvot>0.27). Likewise, in the presence of tricuspid valve insufficiency (TI), we can quantify pulmonary vascular resistance (PVR) through estimation of the maximum flow velocity detected in TI (Vmax TI) and the integral of the right ventricle outlet tract velocity (ITVrvot) or, alternatively, by estimating the pulmonary pre-ejection period (PPE), pulmonary acceleration time (TAc) and total systolic time (TST).39,40
PVR=(VmaxTI/ITVrvot)×10+0.16 (a value of≥0.175 identifies PVR>2 wood, sensitivity 77%, specificity 81%).
PVR=−0.156+1.154×[(PPE/TAc)/TST]
On the other hand, we can calculate ventricle wall stress, as commented above.
ConclusionsThe evaluation of contractility and afterload, based on echocardiography and other hemodynamic monitorization systems, constitutes a key element in the assessment of cardiovascular function in the critical patient. The combination of different techniques probably allows us to obtain more complete information with a view to improving the patient prognosis.
Please cite this article as: Ochagavía A, et al. Evaluación de la contractilidad y la poscarga en la unidad de cuidados intensivos. Med Intensiva. 2012;36:365–74.


