
We aimed to assess the usefulness of using the right ventricle outflow tract (RVOT) velocity-time integral (VTI) for echocardiographic monitoring of cardiac output compared to the gold standard, the VTI along the left ventricle outflow tract (LVOT).
DesignProspective observational study.
SettingA tertiary intensive care unit.
Patients100 consecutive patients. Interventions: echocardiographic monitoring in critically ill patients.
Main variables of interestWe used intraclass correlation coefficients (ICC) to compare echocardiographic measurements of LVOT VTI through apical window with RVOT VTI through the parasternal and modified subcostal windows and to assess interobserver reproducibility. Preplanned post hoc analyses compared the ICC between ventilated and nonventilated patients.
ResultsAt the time of echocardiography, 44 (44%) patients were mechanically ventilated and 28 (28%) were receiving vasoactive drugs. Good-quality measurements were obtained through the parasternal short-axis and/or apical views in 81 (81%) patients and in 100 (100%) patients through the subcostal window. Consistency with LVOT VTI was moderate for RVOT VTI measured from the modified subcostal view (ICC 0.727; 95%CI: 0.62–0.808) and for RVOT VTI measured from the transthoracic view (0.715; 95%CI: 0.59–0.807).
ConclusionsMeasurements of RVOT VTI are moderately consistent with measurements of LVOT VTI. Adding the modified subcostal window allows monitoring RVOT VTI in all the patients of this selected cohort, even those under mechanical ventilation.
Valorar la utilidad de la integral velocidad-tiempo (IVT) del tracto de salida del ventrículo derecho (TSVD) para la monitorización del gasto cardíaco comparado con el gold standard, el IVT del tracto de salida del ventrículo izquierdo (TSVI).
DiseñoEstudio prospectivo observacional.
ÁmbitoUCI de un hospital terciario.
PacientesCien pacientes consecutivos.
IntervencionesEcocardiografías realizadas para monitorización hemodinámica.
Variables de interés principalesUsamos el coeficiente de correlación intraclase (CCI) para comparar las mediciones de IVT TSVI a través de la ventana apical con el IVT TSVD a través de la ventana paraesternal y subcostal modificada y la reproducibilidad interobservador. Se planeó un análisis post hoc para comparar los resultados en pacientes ventilados con no ventilados.
ResultadosEn el momento de la ecografía, 44 (44%) pacientes estaban en ventilación mecánica y 28 (28%) recibían fármacos vasoactivos. Mediciones de buena calidad se obtuvieron a través de la ventana paraesternal o apical en 81 (81%) pacientes, y en 100 (100%) con la ventana subcostal modificada. La consistencia del IVT TSVI fue moderada con el IVT TSVD medido con la ventana subcostal modificada (CCI 0,727; IC 95%: 0,62-0,808) y la transtorácica (0,715; IC 95%: 0,59-0,807).
ConclusionesEl IVT TSVD presenta una consistencia moderada cuando se compara con el IVT TSVI. Añadir la ventana subcostal modificada permite monitorizar el IVT TSVD en todos los pacientes de esta cohorte, incluso aquellos con ventilación mecánica.
The measurement of cardiac output is pivotal in the management of critically ill patients. Although pulmonary artery catheter monitoring has long been the gold standard for determining cardiac output,1 noninvasive methods have been increasingly used in recent years; in particular, echocardiography has proven feasible and accurate.1,2 Some authors have proposed that echocardiography should be the preferred modality for measuring cardiac output in the initial evaluation of shock.3–5
Various approaches to assess cardiac output with echocardiography in critically ill patients have been described, but determining the stroke volume at the left ventricular outflow tract (LVOT) through the apical window is considered the gold standard. This parameter is calculated by multiplying the cross-sectional area of the LVOT by the velocity-time integral (VTI) of the LVOT. However, errors in measuring the LVOT area are common, resulting in inaccurate calculations of stroke volume. This limitation is especially relevant in emergency settings.6
Since the LVOT area remains constant, any changes in the stroke volume must be due to changes in the LVOT VTI. Therefore, LVOT VTI can serve as a surrogate for stroke volume. This approach could be used not only for the initial assessment of stroke volume, but also for monitoring the response to treatment.7
However, using LVOT VTI as a surrogate of stroke volume is problematic in certain clinical situations (e.g., severe aortic regurgitation or dynamic LVOT obstruction), and this parameter is difficult to measure in patients under mechanical ventilation, where the transthoracic acoustic window may not be feasible. This limitation affect up to 40–50% of patients.8,9
To circumvent these limitations, in patients with severe aortic regurgitation or dynamic LVOT obstruction, VTI could be measured in the right ventricular outflow tract (RVOT) through the parasternal short-axis or modified subcostal windows. The parasternal window is more susceptible to echo air-mediated artifacts in mechanically ventilated patients. By contrast, the short-axis plane through the modified subcostal window approaches the heart from the abdomen, avoiding the lungs, so measurements of RVOT VTI are not affected by mechanical ventilation. Although the subxiphoid view presented some limitations for a different hemodynamic assessment,10 to date, the feasibility of this approach has not been tested.
As in estimations of stroke volume from LVOT VTI, the rationale for estimations from RVOT VTI is based on the principle that the RVOT area remains constant, so changes in stroke volume reflect changes in VTI where the flow is measured.
This prospective study aimed first to compare the feasibility to measure RVOT VTI through the parasternal and the modified subcostal window. Secondly, we aimed to study the correlation of RVOT VTI, measured through the parasternal window or through the modified subcostal window, with LVOT VTI measured through the apical window (gold standard)
Materials and methodsStudyThis prospective observational study was conducted in an intensive care unit (ICU) at a tertiary hospital in Spain from October 2015 to March 2016. The department of health of the regional government to which this hospital is affiliated and the hospital's ethics committee approved the protocol and waived the need for written informed consent because the study did not change standard patient care.
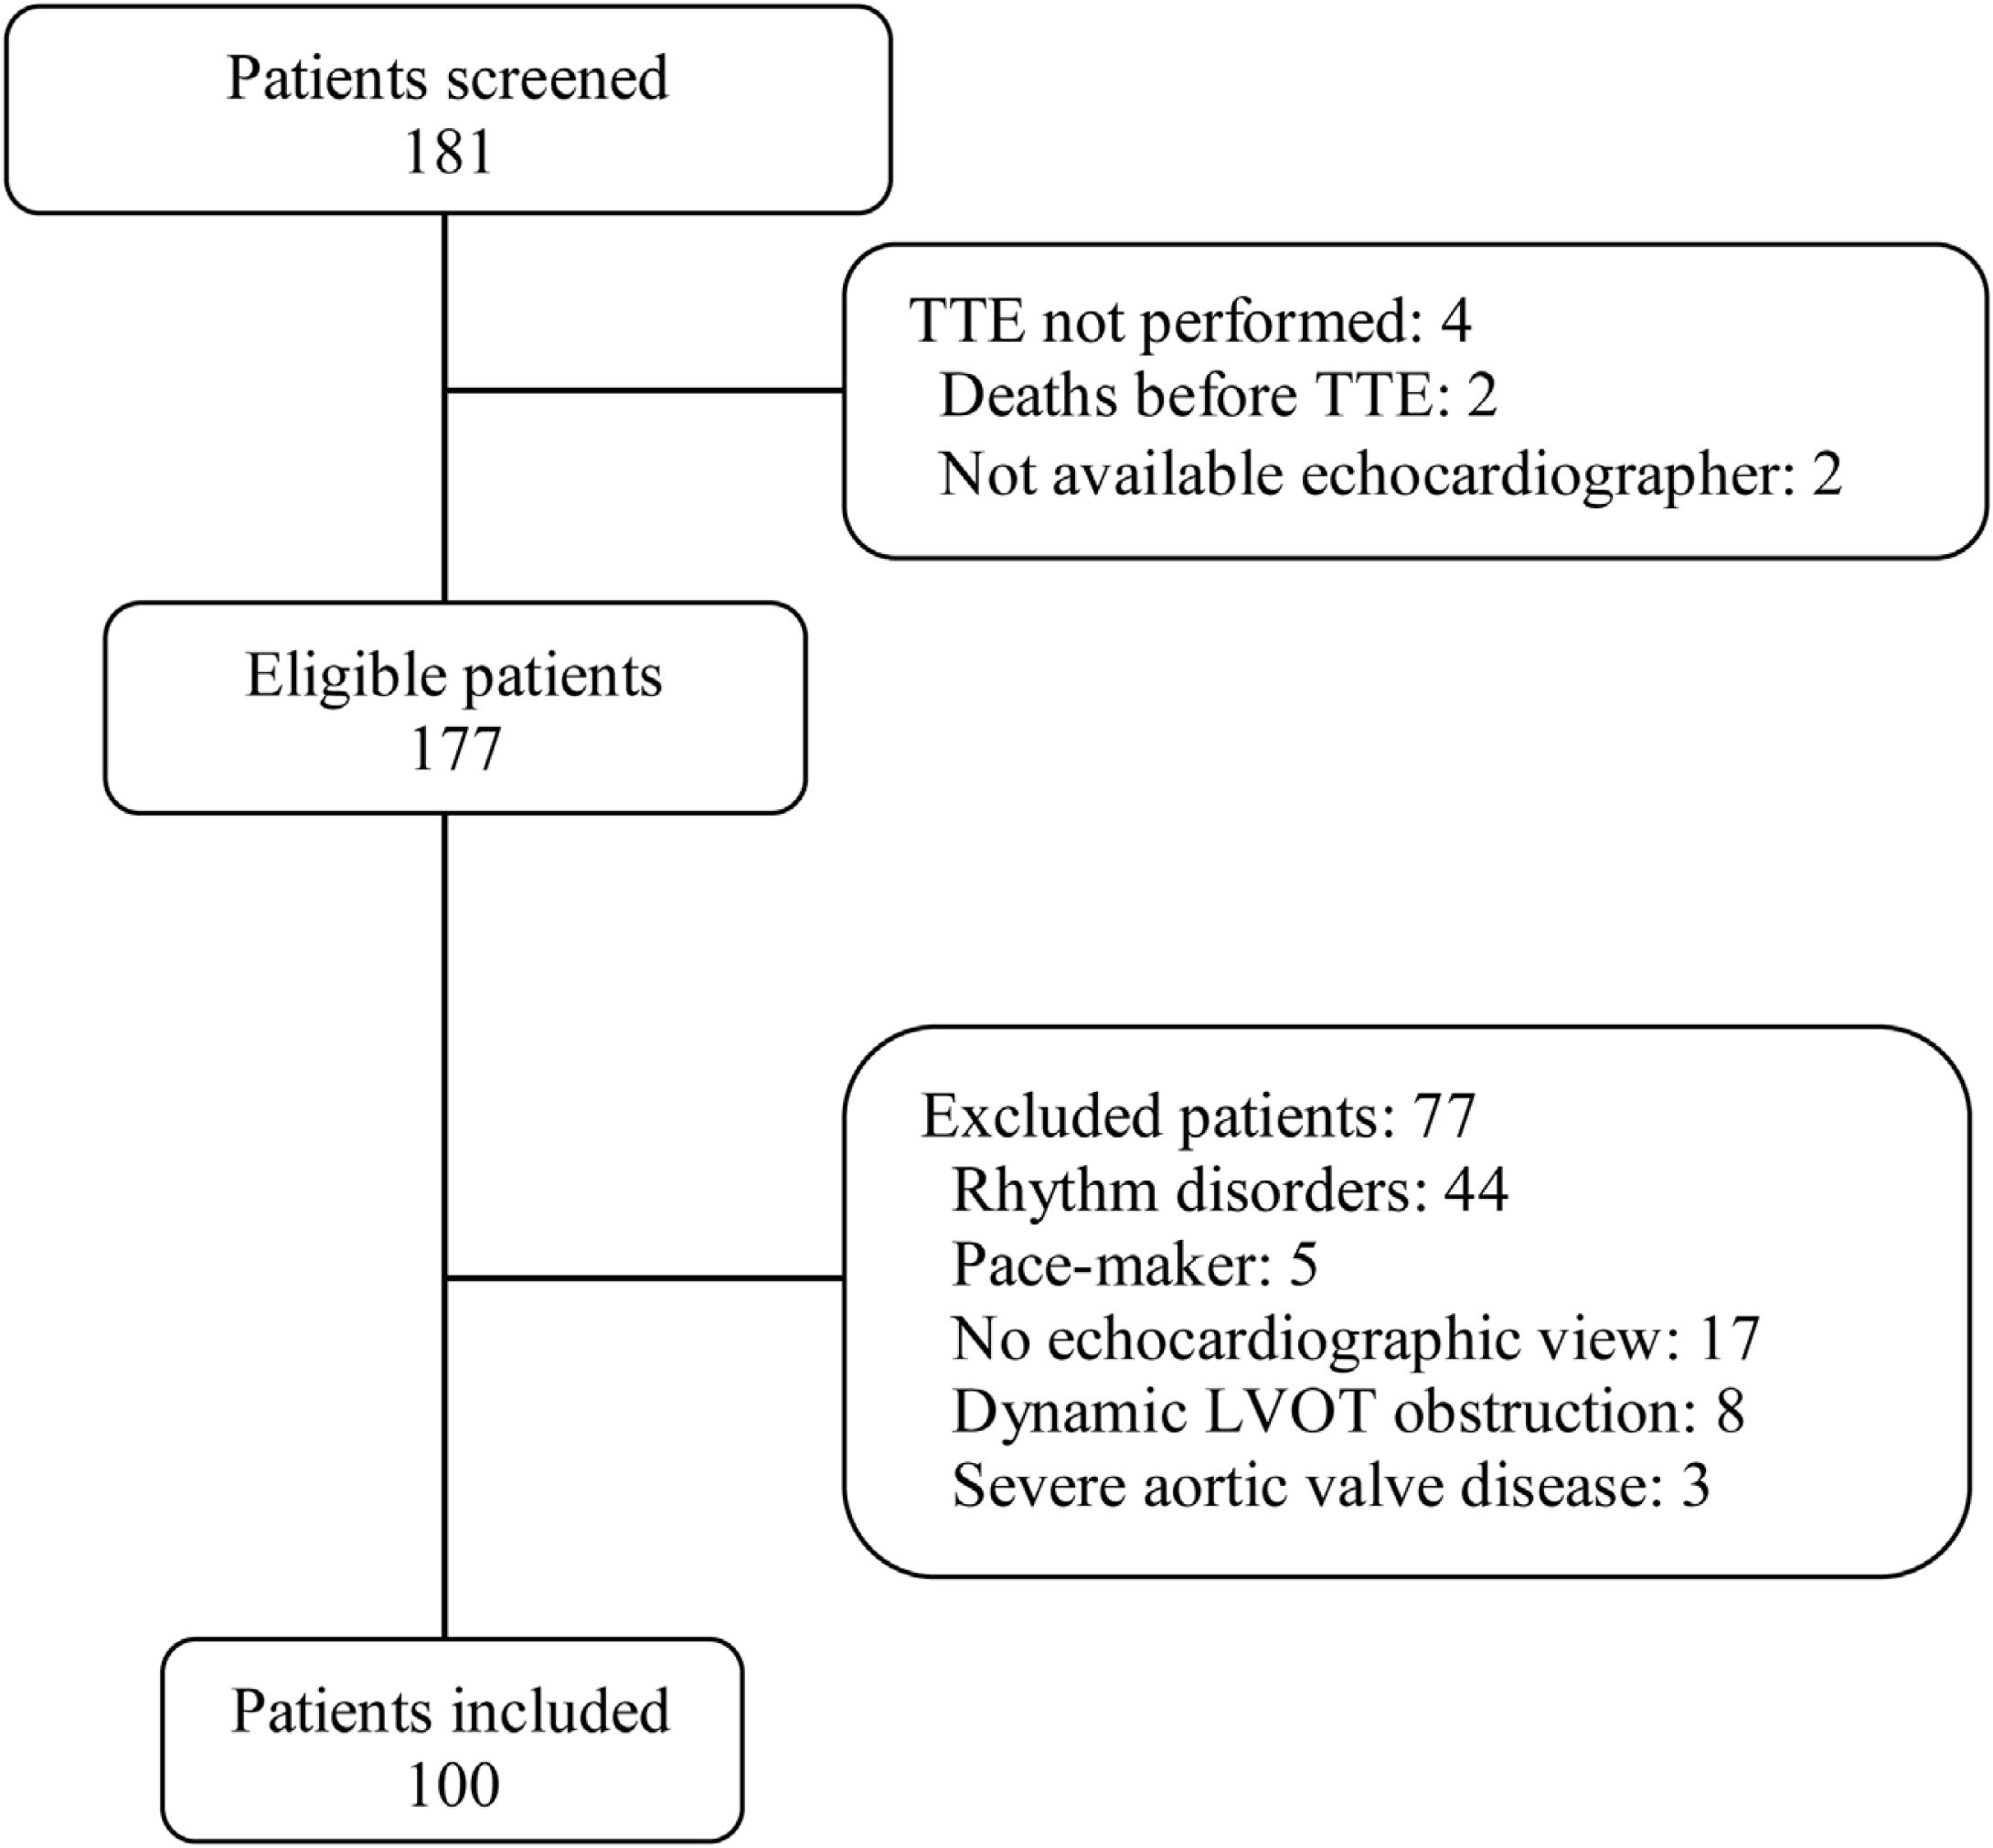
PatientsWe prospectively included 100 adult patients undergoing transthoracic echocardiography in the ICU for the initial diagnosis of shock or for subsequent assessment for hemodynamic optimization. We excluded patients with nonsinus rhythms or atrioventricular conduction abnormalities, pacemakers, dynamic LVOT obstruction, or moderate or severe aortic valve disease, as well as those in whom it was impossible to obtain any echocardiographic images and measurements through any window (e.g., those in prone position).5,11–13
We recorded reason for admission, severity score, vasopressor administration, hemodynamic and ventilatory variables at the time the echografic study was performed, and ICU mortality.
Norepinephrine was administered in patients with hypotension with preserved left ventricular ejection fraction and no signs of preload dependence; doses were tailored to reach a mean arterial pressure>65mmHg. Dobutamine was anticipated to be administered in patients with systolic blood pressure<90mmHg associated with decreased left ventricular ejection fraction. During the procedure, vasoactive drugs were not initiated and the dose of ongoing infusion remained constant.
Doppler echocardiographic studyExperienced echocardiographers (level 3 competence) performed transthoracic echocardiography (EnVisor ultrasound system, Philips, Andover, MA, USA), recording and storing images and waveforms for offline measurements. Echocardiographers obtained conventional pulse-wave Doppler measurements of VTI in the center of the LVOT or RVOT while striving to maintain the angle of the Doppler signal to aortic or pulmonary artery blood flow at close to 0°; they used the apical five-chamber view to measure LVOT VTI and the paraesternal short-axis and modified subcostal views to measure RVOT VTI.
Providing an image similar to that obtained with the parasternal short-axis view, the modified subcostal view14 is obtained by angulating the transducer anteriorly and superiorly toward the right shoulder in a plane approximately 90° from the long axis subcostal view. In the pulmonic valve plane, the valve is seen as a horizontal structure and the vessel walls are clearly visualized (see supplementary material). Echocardiographers traced the leading edge of three consecutive Doppler velocity curves and calculated the mean VTI.15,16
Data analysisTo determine the reliability of RVOT VTI measured in the different windows compared to the gold-standard LVOT VTI, we used a two-way mixed model intraclass correlation coefficient (ICC),17 characterizing and quantifying the prediction error by the mean square error (MSE), root mean square error (RMSE), and mean absolute percentage error (MAPE). To analyze interobserver reproducibility, we used the ICC on repeated measurements by two physicians in 20 randomly selected patients.
Because mechanical ventilation has profound effects on heart function and echocardiographic measurements of hemodynamic parameters between the left and right sides of the heart,18,19 preplanned post hoc analysis compared the ICC results in ventilated versus nonventilated patients.
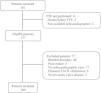
ResultsWe analyzed 100 consecutive patients who met the inclusion criteria (Fig. 1), 44 (44%) under mechanical ventilation, mean PEEP during echocardiography, 6.4cmH2O; 28 (28%) on norepinephrine, mean dose, 0.27mcg/kg/min). Table 1 reports the baseline characteristics of the entire population as well of the subgroups of ventilated and nonventilated patients.
Baseline characteristics of the entire population and of the subgroups of patients according to whether they were under mechanical ventilation at the time of echocardiographic monitoring.
| Without MV(n=56) | With MV(n=44) | Total population(n=100) | |
|---|---|---|---|
| Age, y, mean (±SD) | 59.5 (16.1) | 57.7 (15.4) | 58.8 (14.9) |
| Male gender, n (%) | 33 (58.9) | 25 (56.8) | 58 (58) |
| Comorbiditiesa | |||
| Heart disease, n (%) | 13 (23.2) | 7 (15.9) | 20 (20) |
| Arterial hypertension, n (%) | 29 (51.8) | 20 (45.5) | 49 (49) |
| Diabetes mellitus, n (%) | 12 (21.4) | 10 (22.7) | 22 (22) |
| BMI>30b, n (%) | 5 (8.9) | 2 (4.5) | 7 (7) |
| Vascular disease, n (%) | 4 (7.1) | 2 (4.5) | 6 (6) |
| Neurological disease, n (%) | 9 (16.1) | 4 (9.1) | 13 (13) |
| COPD, n (%) | 1 (1.8) | 4 (9.1) | 5 (5) |
| Other respiratory disease, n (%) | 3 (5.4) | 6 (13.6) | 9 (9) |
| Chronic renal failure, n (%) | 7 (12.5) | 5 (11.4) | 12 (12) |
| Chronic hepatic failure, n (%) | 0 (0) | 2 (4.5) | 2 (2) |
| Cancer, n (%) | 9 (16.1) | 0 (0) | 9 (9) |
| At ICU admission | |||
| Medical diagnosis at admission, n (%) | 38 (67.8) | 37 (84.1) | 75 (75) |
| Primary cardiac disease, n (%) | 10 (17.8) | 5 (11.4) | 15 (15) |
| Primary respiratory disease, n (%) | 8 (14.3) | 15 (34.1) | 23 (23) |
| Surgical disease, n (%) | 13 (23.2) | 3 (6.8) | 16 (16) |
| Urgent surgical intervention, n (%) | 2 (3.6) | 2 (4.5) | 4 (4) |
| Trauma disease, n (%) | 5 (8.9) | 4 (9.1) | 9 (9) |
| Physiopathological characteristics conditioning echocardiography | |||
| Clinical indication for echocardiography | |||
| Initial diagnosis of shock, n (%) | 36 (64.3) | 24 (54.5) | 60 (60) |
| Subsequent hemodynamic optimization, n (%) | 20 (35.7) | 20 (45.5) | 40 (40) |
| MV, n (%) | NA | 44 (100) | 44 (44) |
| PEEP, cmH2O, mean (±SD) | NA | 6.4 (2.1) | 6.4 (2.1) |
| Heart rate, bpm, mean (±SD) | 79 (16.4) | 79 (15.9) | 79 (15.7) |
| Vasoactive drugs, % | 5 (8.9) | 23 (52.3) | 28 (28) |
| Norepinephrine dose, mcg/kg/min, mean (±SD) | 0.20 (0.14) | 0.29 (0.31) | 0.27 (0.28) |
BMI=body mass index; COPD=chronic obstructive pulmonary disease; ICU=intensive care unit; MV=mechanical ventilation; PEEP=positive end-expiratory pressure; SD=standard deviation.
Good-quality Doppler images were obtained in the parasternal short-axis and/or apical views in 81 patients. In the modified subcostal view, good quality Doppler images in all patients.
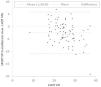
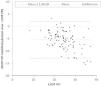
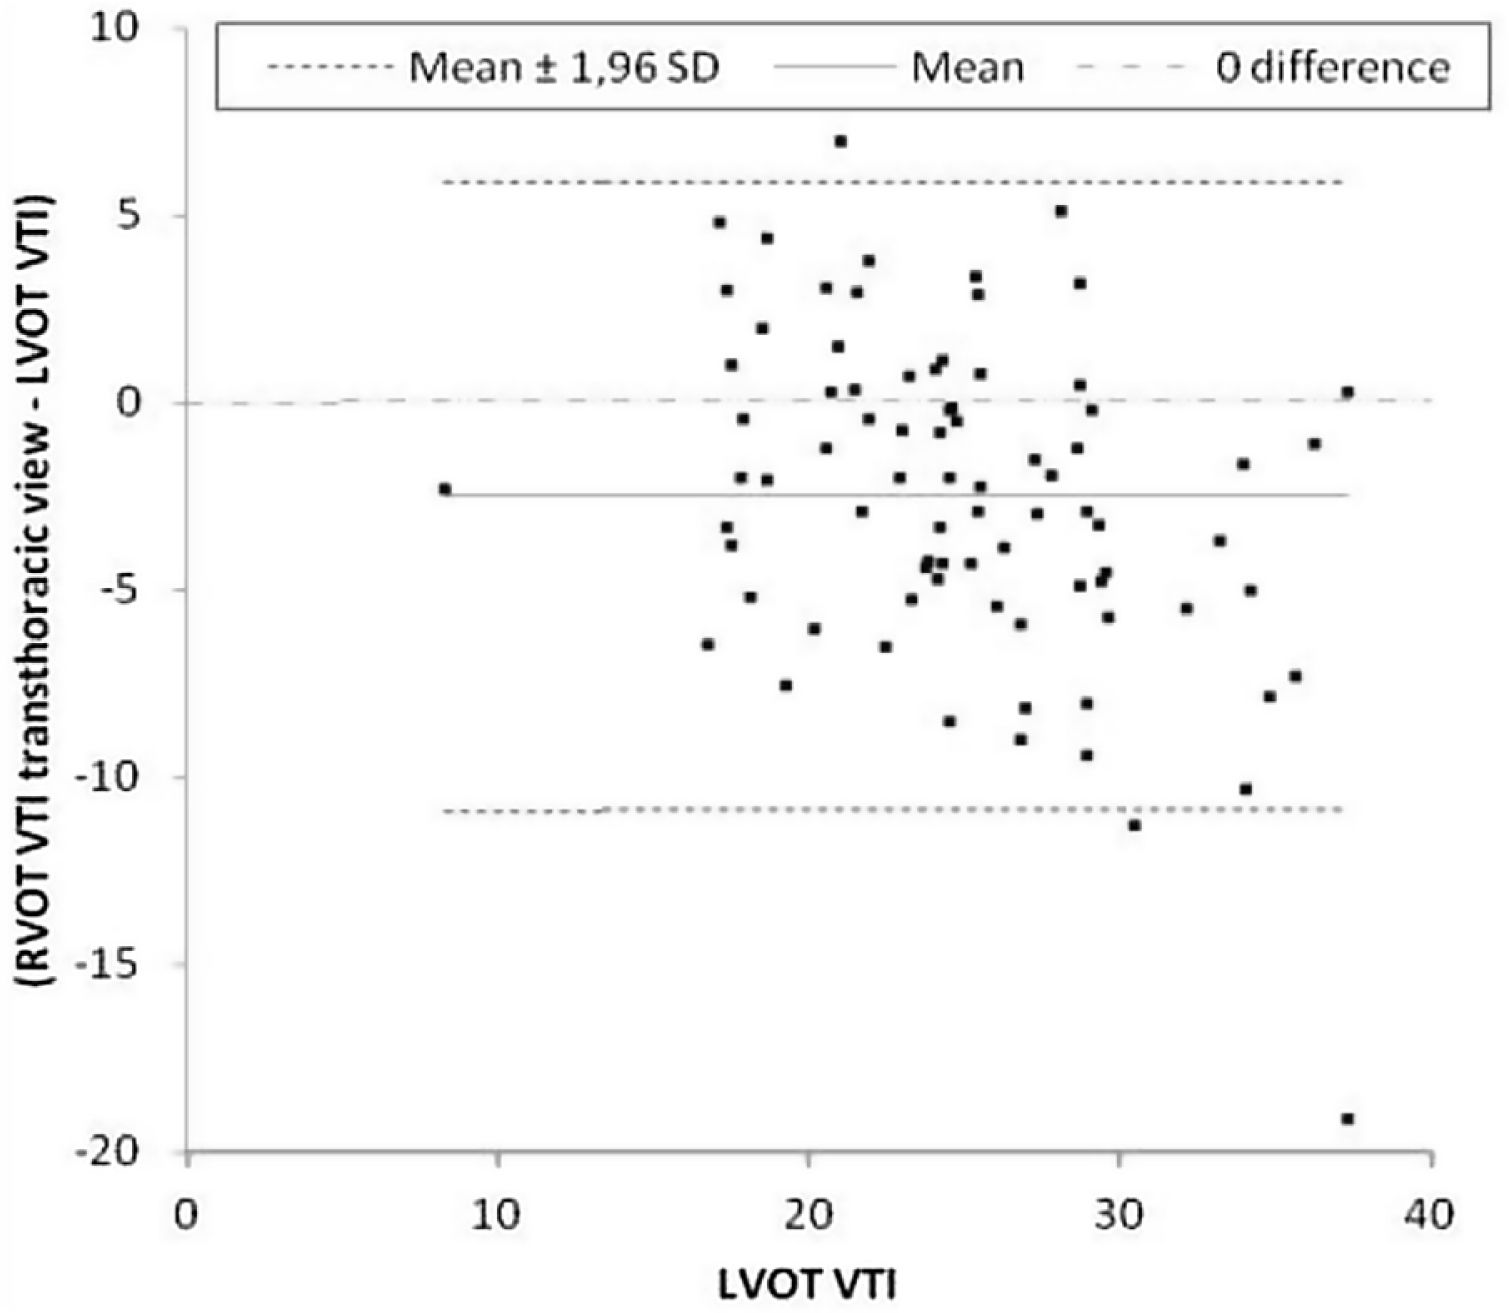
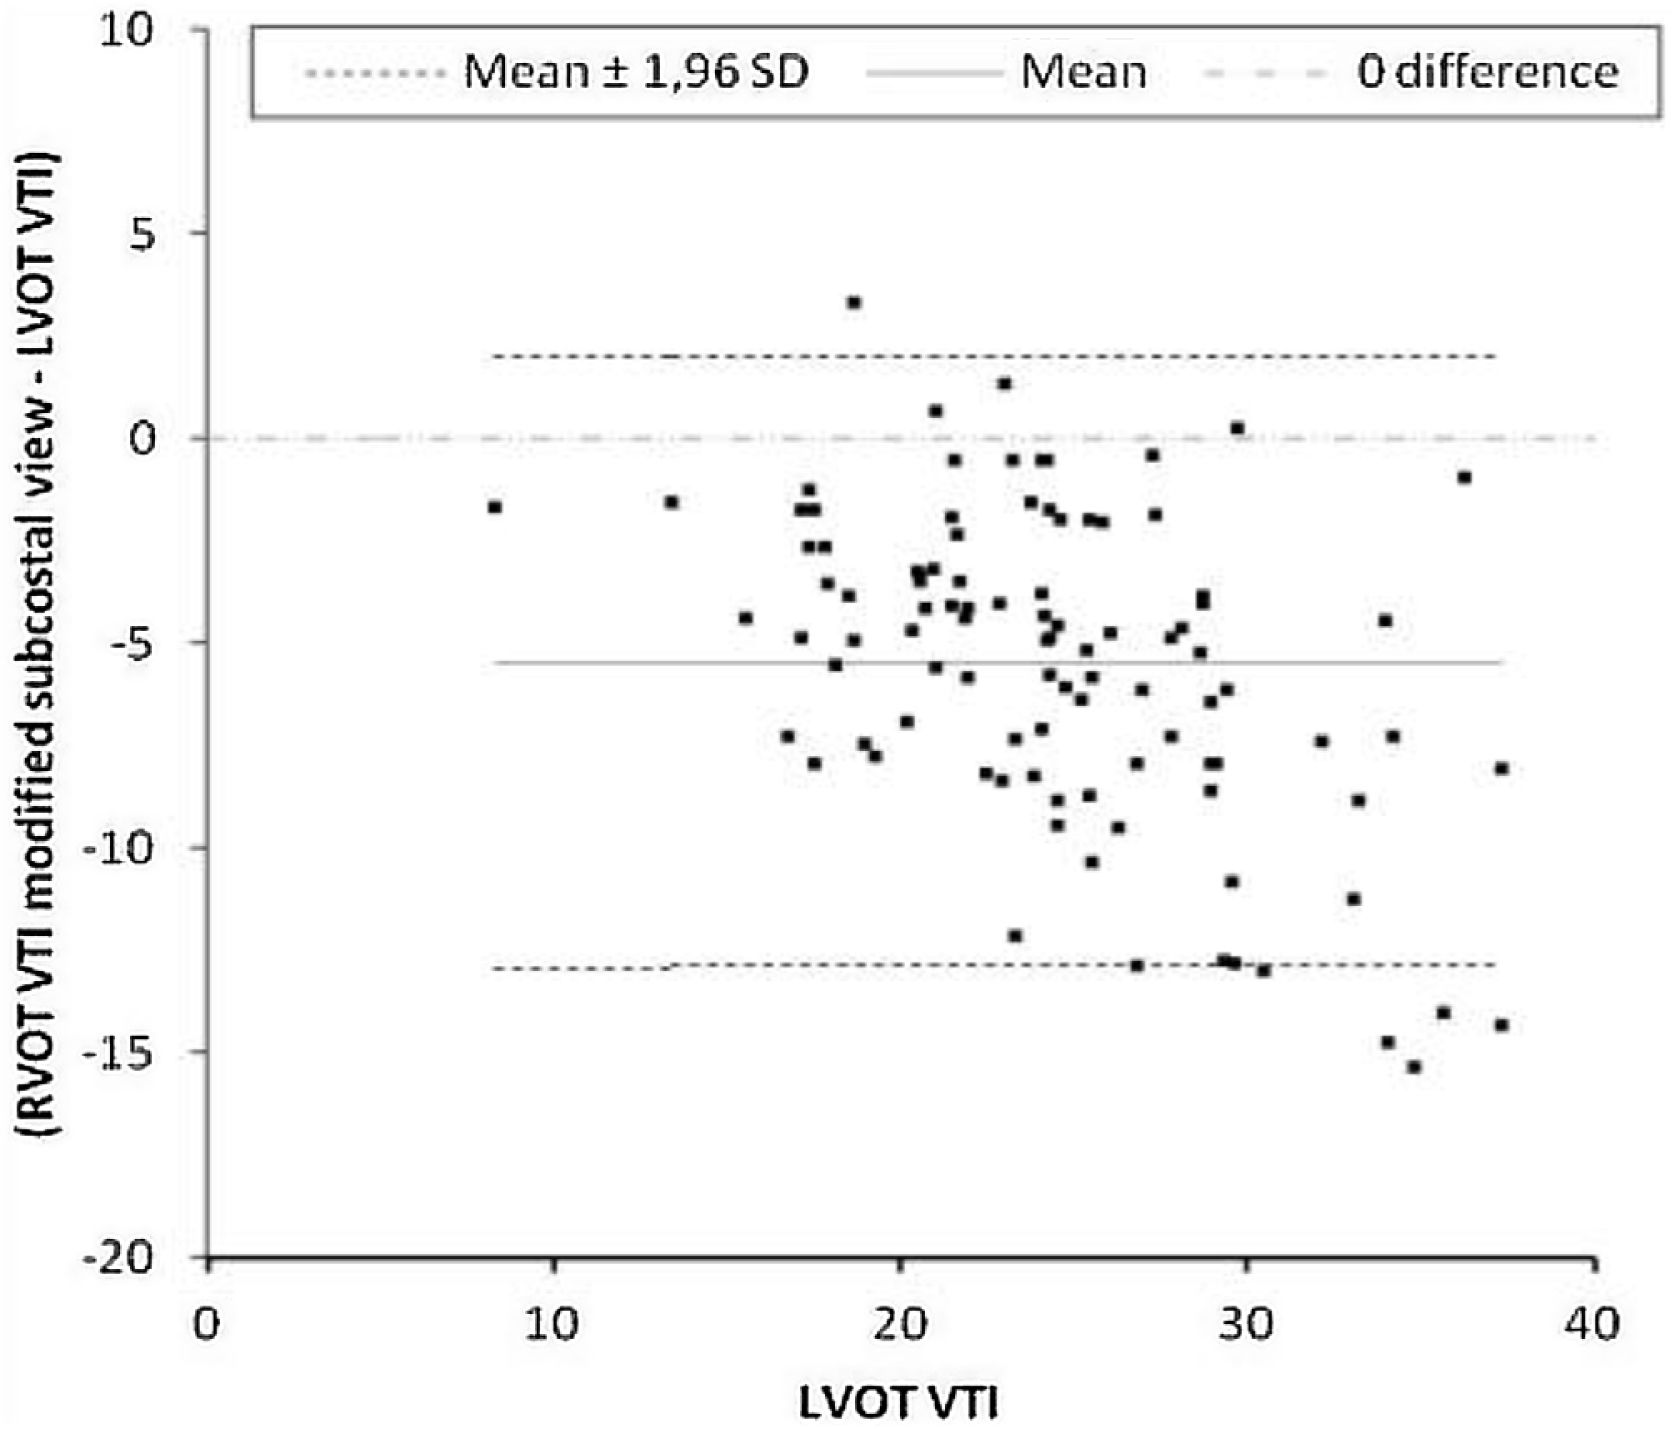
Primary outcomeThe mean difference between LVOT VTI and RVOT VTI was −2±4.5cm when RVOT VTI was measured in the parasternal window (Fig. 2) and −5±3.8cm when RVOT VTI was measured through the modified subcostal window (Fig. 3). The median (IQR) results for VTI obtained with the three windows for the entire group as well as for the subgroups of ventilated and nonventilated patients are presented in Table 2. RVOT VTI was greater than LVOT VTI in only four patients when RVOT VTI was measured through the modified subcostal window and in 22 patients when RVOT VTI was measured through the parasternal window. RVOT VTI was less than 20cm in 14 patients when measured through the parasternal window and in 18 patients when measured through the subcostal windows; all these patients underwent echocardiography for a primary diagnosis of shock, and none were on inotropic drugs. In patients with VTI<20cm, the mean difference between LVOT VTI and RVOT VTI was −1±4.1cm when RVOT VTI was measured through the parasternal window and −3±2.4cm when RVOT VTI was measured through the modified subcostal window.
Outcome measurements.
| Without MV(n=56) | With MV(n=44) | Total population(n=100) | |
|---|---|---|---|
| Apical LVOT VTI, cm, median (IQR) | 22.1 (19.8–24.7) | 25.9 (21.6–29.4) | 24.2 (20.9–28.5) |
| Pes RVOT VTI, cm, median (IQR) | 24.4 (18.8–26.4) | 21.9 (16.5–23.3) | 23.1 (17.1–25.7) |
| Msv RVOT VTI, cm, median (IQR) | 19.2 (16.6–23.5) | 17.6 (14.5–20.9) | 18.9 (15.7–22.6) |
IQR=interquartile range; LVOT=left ventricular outflow tract; MSV=modified subcostal view; MV=mechanical ventilation; PES=parasternal view; RVOT=right ventricular outflow tract; VTI=velocity-time integral.
The ICC between LVOT VTI and RVOT VTI was 0.727 (95%CI 0.62–0.808) when RVOT VTI was measured through the modified subcostal window (Fig. 3) and 0.715 (95%CI 0.59–0.807) when RVOT VTI was measured through the parasternal window (Fig. 2).
Error characterization analyzed for RVOT from the modified subcostal view was as follows: MSE 44.27 (95%CI 34.4–54.9), RMSE 6.65 (95%CI 5.8–7.7), BIAS −5.4 (95%CI −6.2 to −4.7), and MAPE 15.34 (95%CI 12.8–17.8). When MSE was broken down into its parts, the result was as follows: for the RVOT VTI from the modified subcostal view and parasternal view the bias proportion was 0.67 and 0.25 respectively; the variance proportion 0.007 and 0 respectively; the covariance proportion 0.31 and 0.74 respectively.
The interobserver correlation between the two investigators was excellent (ICC=0.93).
Post hoc analysis of results in ventilated versus nonventilated patientsIn the post hoc analysis of the subgroups of patients who were mechanically ventilated and those who were not, the RVOT VTI measurements were closer to the LVOT VTI measurements in mechanically ventilated patients than in nonventilated patients. For measurements of RVOT VTI through the parasternal window (done in 81 patients), the ICC with LVOT VTI was 0.553 (95%CI 0.31–0.729) for nonventilated patients and 0.794 (95%CI 0.636–0.888) for ventilated patients; for measurements of RVOT VTI through the modified subcostal window (done in 100 patients), the ICC with LVOT VTI was 0.629 (95%CI 0.441–0.769) for nonventilated patients and 0.798 (0.658–0.884) for ventilated patients. For measurements of RVOT VTI through the parasternal and modified subcostal window (including only the 81 patients in whom measurements were done through both windows), the ICC was 0.621 (95%CI 0.401–0.774) in nonventilated patients and 0.781 (95%CI 0.615–0.881) in ventilated patients.
DiscussionBecause echocardiographic measurement of cardiac output based on LVOT VTI is unfeasible in some critically ill patients, we aimed to determine whether measurements based on RVOT VTI would be reliable. We found that it is possible to monitor cardiac output through at least one echographic window in near all critically ill patients. In our critically ill population in which 44% of patients were under mechanical ventilation with moderate pressure, measuring LVOT VTI through the gold-standard apical window was feasible in 81% of patients and measuring RVOT VTI through the modified subcostal window was feasible in 100%. Importantly, measurements of RVOT VTI through the parasternal and the modified subcostal window were moderately consistent with measurements of LVOT VTI through the gold-standard apical window. Interestingly, consistency between measurements of RVOT VTI through the parasternal and subcostal windows were only moderate and better in nonventilated patients. This result suggests that cyclic cardiac movements according to the respiratory cycle are different when negative or positive pressure drives the breath, as lung expansion is greater at basal portions in spontaneously breathing patients and upper portions are better aerated while on mechanical ventilation.
Maizel et al.10 reported lower feasibility for subxiphoid view, with no echographic image in 14% of patients. However, they aimed to analyze the quality of two-dimension images through the subxiphoid view for hemodynamic assessment. In our study, 100% of the patients had echographic window of quality enough for Doppler measurements.
Mean RVOT VTI was lower than mean LVOT VTI, and the difference was greater when the modified subcostal window was used, mainly because RVOT VTI through the parasternal window was higher than LVOT VTI when measured in nonventilated patients. This results can be explained by the opposite deterioration of parasternal and subcostal window along the respiratory cycle: while parasternal window deteriorates during inspiration, subcostal window deteriorates during expiration. These differences are mainly due to the greater ease of positioning the transducer to obtain a Doppler angle near 0° in the parasternal window, suggesting that the parasternal and apical windows enable better alignment with the ventricular outflow tracts.10 However, as RVOT VTI was higher measured through the modified subcostal window than through the parasternal window in 4 (4%) patients, anatomical peculiarities might enable a better Doppler angle optimal through the subcostal window in some patients. Our results corroborate Lightly et al.’s14 findings in nonventilated patients, where RVOT TVI was higher in the parasternal window than in the subcostal window; to our knowledge, this is the only other study that compared measurements of right ventricular cardiac output obtained through different windows.
The clinical importance of positive and negative deviations from 0 in a correlation analysis is secondary to the risk of both overestimation and underestimation of the gold standard. It is noteworthy that although right-ventricular and left-ventricular cardiac output are similar when the complete respiratory cycle is considered, the two parameters differ when measured for any given heartbeat. In spontaneously breathing patients, right-ventricular output is greater than left-ventricular output during inspiration, and left-ventricular output is greater than right-ventricular output during expiration; however, in patients under positive-pressure mechanical ventilation, the opposite relations are observed.20–22 Echocardiographic monitoring studies select the best measurements, but when transthoracic windows are used, most of the best measurements are obtained during exhalation, as the increased lung volume during inspiration negatively affects the quality of the echographic images. Mechanical ventilation further limits measurements of left ventricular output through the transthoracic window during inspiration, but its effects on measurements of right ventricular output are not as severe. These differences are lost when populations including both ventilated and nonventilated patients are analyzed.
Measuring RVOT VTI through the subcostal window enables echocardiographic monitoring in patients with clinical limitations for LVOT VTI measurements. Measuring cardiac output through the subcostal window rather than the transthoracic window has several advantages. RVOT VTI measurements are more feasible and more consistent in patients under mechanical ventilation. Measurements deviate from the gold standard in only one direction (i.e., sometimes underestimating, but scarcely overestimating cardiac output) and are possibly less dispersed in patients with lower VTI.
Interobserver reproducibility is an important issue in echocardiographic monitoring of cardiac output because this operator-dependent technique is used for point-of-care hemodynamic monitoring, where different professionals measure the same parameters on different occasions. For this reason, we analyzed interobserver reproducibility by having two experienced echocardiographers measure cardiac output parameters in the same studies to reduce the risk of observer-related bias in our main results. The interobserver correlation was excellent (ICC>0.8). One study reported 6% interobserver variability for systolic volume.7 The most important limitation for the reproducibility of measurements of cardiac output is variability in measurements of aortic outflow tract diameter; for this reason, we used VTI as a surrogate for cardiac output to reduce the impact of this variability.
Limitations of the studyThis study did not consider causes of RVOT obstruction such as severe pulmonary stenosis or severe pulmonary hypertension. However, severe pulmonary stenosis is rare and is therefore unlikely to affect our results. Severe pulmonary hypertension modifies the shape of the VTI curve, mainly by shortening the acceleration time. Nevertheless, the area under the VTI curve has not been related to pulmonary hypertension, even in severe cases. Another possible limitation is that we did not measure the diameter of the RVOT. Our reasons for not measuring this parameter are the same as our reasons for not measuring the LVOT diameter. Moreover, the protocols for measuring RVOT diameter are far from being standardized, and VTI is the best surrogate parameter for clinical decision making.15
Technical limitations did not allow us to store respiratory cycle information along with the echocardiographic images and electrocardiogram waveforms for offline measurements. However, cyclical deterioration of the acoustic window secondary to lung inflation facilitates the recognition of respiratory cycle during echocardiographic monitoring. Importantly, cyclical deterioration of the acoustic window is opposite for the parasternal and subcostal windows: during inspiration parasternal window deteriorates while improves through the subcostal window as heart is pushed down by the lungs, and the opposite during expiration. In addition, the results of the post hoc analysis support the use of right-sided measurements of cardiac output in patients under mechanical ventilation.
None of the patients were under dobutamine perfusion when they underwent echocardiography, because most studies were indicated mainly to diagnose shock. However, VTI was lower than 20cm in 18%, so we consider that our results can be extrapolated to patients with limited cardiac output.
ConclusionThe best approach is to attempt measurements through all windows in each patient; when more than one window is available, the best measurement should be used for clinical decisions. Given the moderate consistency between measurements made in different windows, once a window is chosen for clinical decision making, it should be used for subsequent measurements for hemodynamic monitoring; changing the window will make comparisons with the initial examination less reliable.
Adding the modified subcostal window to echocardiographic monitoring of hemodynamics enables monitoring RVOT VTI, and hence cardiac output monitoring, in all the patients of this selected cohort.
Authors’ contributionsDr. Colinas had full access to all the data in the study and takes responsibility for the integrity of the data and the accuracy of the data analysis. Concept and design: Colinas, Vicho. Acquisition, analysis, or interpretation of data: Colinas, Hernandez, Vicho. Drafting of the manuscript: Colinas, Hernandez, Vicho, Serna, Tuero, Cuesta-Montero. Critical revision of the manuscript for important intellectual content: Colinas, Hernandez, Vicho, Serna, Tuero, Cuesta-Montero, Cuena. Statistical analysis: Cuena. Administrative, technical, or material support: Colinas. Study supervision: Colinas, Hernandez, Vicho.
FundingThe study received no external funding.
Conflict of interestsNo potential conflict of interest relevant to this article was reported.
We thank all the patients and collaborators in the trial; all the medical and nursing staff for their cooperation; and John Giba, B.Sc., for editing an earlier version of the manuscript.