


To evaluate the intrarater and interrater reliability of the Clinical Frailty Scale-Spain (CFS-España) and FRAIL-España and the internal consistency of the FRAIL-España when implemented in critically ill patients by intensive care nurses and physicians.
DesignDescriptive, observational and metric study.
Settingintensive care unit (ICU) of Spain.
PatientsPatients >18 years, with >48 UCI hours.
InterventionNone.
Main variables of interestOn admission, frailty with CFS-España and FRAIL-España (by 3 nurses and 2 intensive care physicians), sex, age, comorbidities and severity.
Results1045 assessments were performed in 206 patients. Not frail patients on admission: 53% according to the CFS-Spain and 34% according to the FRAIL-Spain.
The intraclass correlation coefficient (ICC) shows almost perfect intrarater concordance (>0.80 for CFS-España and >0.90 for FRAIL-España). Agreement by frailty strata (non-fragile, pre-fragile and fragile patients) was substantial or almost perfect, with no major differences in ratings between nurses and physicians.
Interprofessional concordance shows an almost perfect ICC for both scales. The lowest agreement was obtained for the FRAIL-España ratings among physicians. In the frailty strata analysis, agreement was moderate. The highest agreement for the CFS-España was considering level 4 patients as frail.
High reliability of the FRAIL-España and strong correlation of all dimensions with the global assessment were obtained, except for the comorbidities dimension, with a weak correlation.
ConclusionThe CFS-España and FRAIL-España scales are reliable for assessing frailty in critically ill patients by nurses and/or intensive care physicians.
Evaluar la fiabilidad de la Clinical Frailty Scale-España (CFS-España) y la consistencia interna y fiabilidad de la FRAIL-España, implementadas en pacientes críticos por enfermeras/os de intensivos e intensivistas.
DiseñoEstudio descriptivo, observacional de carácter métrico.
ÁmbitoUnidad de cuidados intensivos (UCI) de España.
PacientesPacientes >18 años, con estancia en UCI > 48 horas.
IntervenciónNinguna.
Variables de interés principalesAl ingreso, fragilidad con CFS-España y FRAIL-España (por 3 enfermeras y 2 intensivistas), sexo, edad, comorbilidades (Charlson) y gravedad (SAPS3).
ResultadosSe realizaron 1045 valoraciones a 206 pacientes. Pacientes no frágiles al ingreso: 53% con CFS-España y 34% con FRAIL-España.
El Coeficiente de Correlación Intraclase (CCI) muestra una concordancia intraobservador casi perfecta (>0,80 la CFS-España y >0,90 la FRAIL-España). El acuerdo por estratos de fragilidad (pacientes no frágiles, prefrágiles y frágiles) fue sustancial o casi perfecto, sin grandes diferencias en las valoraciones entre enfermeras e intensivistas.
La concordancia entre profesionales muestra un CCI casi perfecto para ambas escalas. La concordancia más baja se obtuvo en las valoraciones de la FRAIL-España entre intensivistas. Analizando por estratos de fragilidad, el acuerdo fue moderado. El mayor acuerdo de la CFS-España fue considerando a los pacientes del nivel 4 como frágiles.
Se ha obtenido alta confiabilidad de la FRAIL-España y fuerte correlación de todas las dimensiones con la valoración global, excepto la dimensión de comorbilidades, con correlación débil.
ConclusionesLas escalas CFS-España y FRAIL-España son fiables para ser utilizadas en la valoración de la fragilidad de pacientes críticos aplicadas por enfermeras/os de intensivos e intensivistas.
Frailty, understood as an increased vulnerability to unexpected outcomes from seemingly minor events (e.g., a new drug, an infection, or a minor surgical procedure), can lead to unfavorable clinical progress.1 Frail patients are at greater risk of adverse events during hospitalization2 and, upon admission to an intensive care unit (ICU), are more likely to develop post-ICU syndrome,3 experience worsening frailty,4,5 and face increased dependency at hospital discharge.6
Although there are numerous scales to evaluate frailty,7 none is considered as the gold standard. Two commonly used scales, likely due to their simplicity, are the Clinical Frailty Scale (CFS)8,9 and the FRAIL scale.10
The Clinical Frailty Scale (CFS), designed by Rockwood et al.,11 is a 9-level tool that assesses physical fitness through exercise and dependency, categorizing patients as non-frail (levels 1–3), vulnerable (level 4), and frail (mild, moderate, severe, or very severe frailty; levels 5–8). Patients at level 9 are those with a life expectancy < 6 months, regardless of evident signs of frailty. Additionally, the scale considers all patients with dementia as frail, categorizing them into mild, moderate, or severe frailty based on the degree of dementia and dependency.
The FRAIL scale10,12 evaluates the presence or absence of 5 dimensions—Fatigue, Resistance, Ambulation, Illness, and unintentional weight Loss—which form the acronym. Each dimension present adds 1 point, resulting in a score between 0 and 5. Patients are categorized as non-frail (FRAIL = 0), pre-frail (FRAIL = 1–2), or frail (FRAIL = 3–5).
In Spain, these scales are available in Spanish-adapted versions (CFS-España13 and FRAIL-España14) and have been applied to cohorts of critical patients.
In a study conducted in 4 Spanish ICUs,15 the prevalence of frailty—evaluated using the FRAIL scale—among patients aged 65 or older was 34.9%, which was associated with mortality 1 and 6 months after ICU discharge. In a systematic review of ICU studies,16 where frailty was measured using various tools—predominantly the CFS—the prevalence was 30%, also correlated with higher in-hospital mortality rates and long-term mortality. Identifying frail individuals is essential to help healthcare professionals individualize therapeutic limits,17,18 adapt care plans, and provide individualized care19,20 to prevent adverse events. This requires the use of valid and reliable tools to assess frailty.
Several authors have evaluated the reliability of the CFS in various contexts21–33 with mixed results. Published intraclass correlation coefficients (ICCs) for the CFS range from 0.35029 up to 0.9026 for inter-observer reliability and from 0.86222 up to 0.99930 for the intra-observer one. Regarding the FRAIL scale, intra-observer reliability (ICC) ranges from 0.70834 up to 0.823,35 with internal consistency—Kuder-Richardson Formula 20—from 0.44736 up to 0.53.37
The aim of this study was to evaluate the intra- and inter-observer reliability of the Clinical Frailty Scale-España, as well as the internal consistency and intra- and inter-observer reliability of the FRAIL-España when implemented in critical care patients by ICU nurses and intensivists.
Patients and methodsStudy designWe conducted a descriptive, observational, metric study in a polyvalent ICU of a teaching hospital. The Guidelines for Reporting Reliability and Agreement Studies (GRRAS) checklist was followed.38
Population and samplePatients >18 years of age with expected ICU stays > 48 h who consented to participate and were admitted from January 2020 through June 2023 were included. Patients with suspected imminent death or COVID-19 were excluded.
Based on the COSMIN design checklist for outcome measurement instruments,39 at least, 100 pairs of evaluations by 2 independent observers would be required to analyze the inter-observer reliability. Considering a 10% dropout rate, a minimum of 111 evaluation pairs was needed.
VariablesUpon admission, frailty was assessed using the Clinical Frailty Scale-España (CFS-Es)13 and the FRAIL-España (FRAIL-Es).14 Other recorded variables included sex, age, comorbidities (Charlson Comorbidity Index40), and severity level (Simplified Acute Physiology Score 3 [SAPS 3]41).
Reliability and internal consistency assessmentAll participants in the study were assessed for frailty based on their condition in the month prior to hospital admission, using the CFS-Es and FRAIL-Es. The evaluations were conducted in person by 3 intensive care nurses (N1, N2, and N3), with more than 20 years of ICU experience each, and 2 intensivists (I1 and I2) with more than 10 years of specialty experience. Assessments were performed with patients directly or their relatives when patients were not capable of communicating. Not all patients could be evaluated multiple times or by all evaluators. One intensivist (I1) conducted only 1 single evaluation (always with the patient), while the remaining professionals conducted up to 2 evaluations (with relatives and/or the patient), at least, 72 h after the first evaluation. All evaluations were conducted independently. If multiple evaluators coincided during a patient visit, all could ask questions, but the individual frailty scores assigned were always blinded to the other evaluators. Upon patient discharge, the lead investigator had access to each individual evaluation from each evaluator. Although the professionals conducting the frailty evaluations were familiar with the scales, the use of such scales was not part of their routine clinical practice.
The evaluations by N1 were considered the reference among nurses because she was the study lead investigator and conducted the initial interview with the patients or their relatives, which also included questions about dependency and quality of life. Additionally, she was the only nurse to assess all patients included in the study. Evaluations by I2 were considered the reference among intensivists, as he was the only one who conducted 2 evaluations per patient. Comparisons across nurses were established between N1 and N3 due to the smaller number of assessments conducted by N2.
Data analysisQuantitative variables are expressed as median and interquartile range [Q1–Q3], following non-parametric testing (Shapiro-Wilk). Qualitative variables are expressed as absolute (n) and relative (%) frequencies. Group median comparisons were performed using the Mann–Whitney U test.
Concordance was evaluated both within the same professional and among 2 and 3 professionals for the CFS-Es and FRAIL-Es scales using the ICC, through the comparison of variances (ANOVA) with repeated measures,42 when the scales were considered as quantitative variables. Cohen's Kappa (K)43 coefficient was used for comparisons between 2 observers, and Fleiss' Kappa44 was used to assess concordance among 3 observers. Concordance was classified as slight if ≤ 0.20, fair if 0.21–0.40, moderate if between 0.41 and 0.60, substantial if between 0.61 and 0.80, and almost perfect if > 0.80.
Frailty assessments using the CFS-Es stratified patients into 3 options: option A categorized patients into 3 groups: non-frail (CFS-Es = 1–3); vulnerable or with very mild frailty (CFS-Es = 4); frail (CFS-Es = 5–9). Options B and C categorized patients into 2 groups (non-frail and frail): In option B, patients at level 4 were considered non-frail (frail = CFS-Es 5–9). In option C, patients at level 4 were considered frail (frail = CFS-Es 4–9). These stratifications were introduced following a change in nomenclature for level 4 in 2020,9 when it shifted from "vulnerable" (non-frail) to "with very mild frailty" (frail). Assessments using the FRAIL-Es stratified patients into 3 groups (option A): non-frail (FRAIL-Es = 0); pre-frail (FRAIL-Es = 1–2); or frail (FRAIL-Es = 3–5), or 2 groups (Option B): FRAIL-Es scores from 0 to 2 categorized patients as non-frail (Table 1).
Stratifications of the Clinical Frailty Scale-Spain (CFS-Es) and the FRAIL-España (FRAIL-Es).
| CFS-Es | Non-frail | Vulnerable | Frail |
|---|---|---|---|
| CFS-Es (a) | 1–3 | 4 | 5–9 |
| CFS-Es (b) | 1–4 | – | 5–9 |
| CFS-Es (c) | 1–3 | – | 4–9 |
| FRAIL-Es | Non-frail | Pre-frail | Frail |
|---|---|---|---|
| FRAIL-Es (a) | 0 | 1–2 | 3–5 |
| FRAIL-Es (b) | 0–2 | – | 3–5 |
CFS-Es: Clinical Frailty Scale-Spain; FRAIL-Es: FRAIL-España.
Since the FRAIL-Es includes dichotomous items, internal consistency was estimated using the Kuder-Richardson Formula 20.45 Reliability was categorized as very low (<0.20), low (0.21−0.40), moderate (0.41−0.60), high (0.61−0.80), and very high: (>0.80).46 The correlation of each item with the overall scale score was evaluated using the Spearman correlation coefficient and was categorized as null (<0.10), weak (0.10−0.29), moderate (0.30−0.50), and strong correlation (>0.50).47 The internal consistency of the FRAIL-Es was calculated using all evaluations conducted by the 5 professionals.
All values are presented with 95% confidence intervals (CI95%) and p-values, with statistical significance set at p < 0.05. Statistical analyses were performed using IBM SPSS Statistics for Windows (version 29.0, IBM Corp., Armonk, NY, United States).
Ethical considerationsThe study protocol was reviewed and approved by the hospital Research Ethics Committee (CEIm2019/42). Consent was obtained from patients or their closest relatives when personal consent was not possible. Data confidentiality was maintained by assigning alphanumeric codes known only to the principal investigator.
ResultsA total of 212 patients were included in the study, 6 of whom were excluded from this analysis because they were only evaluated once by a single professional. A total of 1045 evaluations were conducted using each scale, consisting of 691 first evaluations (I1 = 105; I2 = 191; N1 = 206; N2 = 70; N3 = 119) and 354 s evaluations (I1 = 0; I2 = 40; N1 = 176; N2 = 43; N3 = 95).
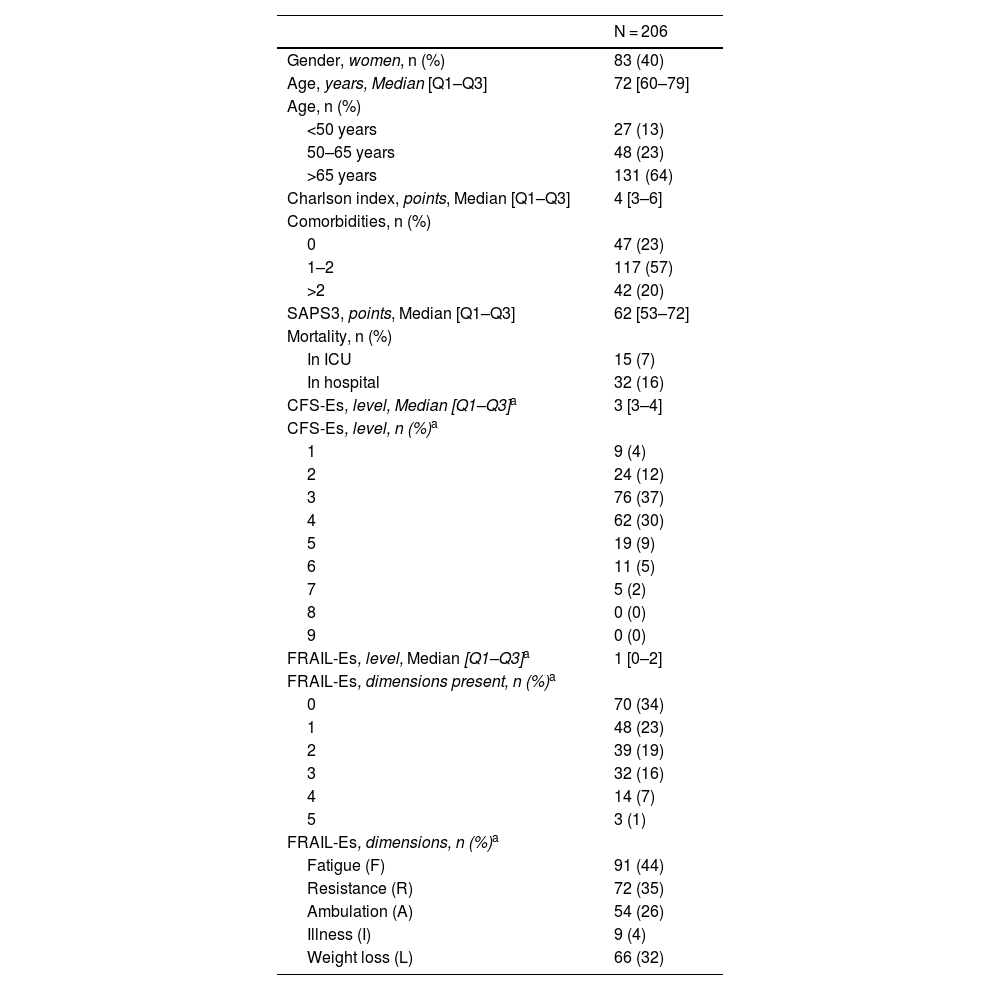
Among the 206 included patients, 40% were women, and the median age was 72 years [60–79]. According to assessments using the CFS-Es scale (CFS-Es = 1–3), 109 (53%) of the patients were not frail at admission vs 70 (34%) according to the FRAIL-Es evaluation. The most common dimension was fatigue [91 patients (44%)], and the least common one, comorbidities [9 patients (4%)] (Table 2). The median Charlson index value was 4 [3–6], with significant differences between non-frail and frail patients evaluated with the FRAIL-Es scale [Charlson, FRAIL-Es 0–2 vs 3–5; 4 [2–6] vs 5 [4–8]; p = 0.001]. Non-frail patients also exhibited lower severity at admission vs frail patients [SAPS3, FRAIL-Es 0–2 vs 3–5; 60 [50–69] vs 68 [60–77]; p = 0.001].
Population descriptive statistics.
| N = 206 | |
|---|---|
| Gender, women, n (%) | 83 (40) |
| Age, years, Median [Q1–Q3] | 72 [60–79] |
| Age, n (%) | |
| <50 years | 27 (13) |
| 50–65 years | 48 (23) |
| >65 years | 131 (64) |
| Charlson index, points, Median [Q1–Q3] | 4 [3–6] |
| Comorbidities, n (%) | |
| 0 | 47 (23) |
| 1–2 | 117 (57) |
| >2 | 42 (20) |
| SAPS3, points, Median [Q1–Q3] | 62 [53–72] |
| Mortality, n (%) | |
| In ICU | 15 (7) |
| In hospital | 32 (16) |
| CFS-Es, level, Median [Q1–Q3]a | 3 [3–4] |
| CFS-Es, level, n (%)a | |
| 1 | 9 (4) |
| 2 | 24 (12) |
| 3 | 76 (37) |
| 4 | 62 (30) |
| 5 | 19 (9) |
| 6 | 11 (5) |
| 7 | 5 (2) |
| 8 | 0 (0) |
| 9 | 0 (0) |
| FRAIL-Es, level, Median [Q1–Q3]a | 1 [0–2] |
| FRAIL-Es, dimensions present, n (%)a | |
| 0 | 70 (34) |
| 1 | 48 (23) |
| 2 | 39 (19) |
| 3 | 32 (16) |
| 4 | 14 (7) |
| 5 | 3 (1) |
| FRAIL-Es, dimensions, n (%)a | |
| Fatigue (F) | 91 (44) |
| Resistance (R) | 72 (35) |
| Ambulation (A) | 54 (26) |
| Illness (I) | 9 (4) |
| Weight loss (L) | 66 (32) |
CFS-Es: Clinical Frailty Scale-Spain; FRAIL-Es: FRAIL-España.
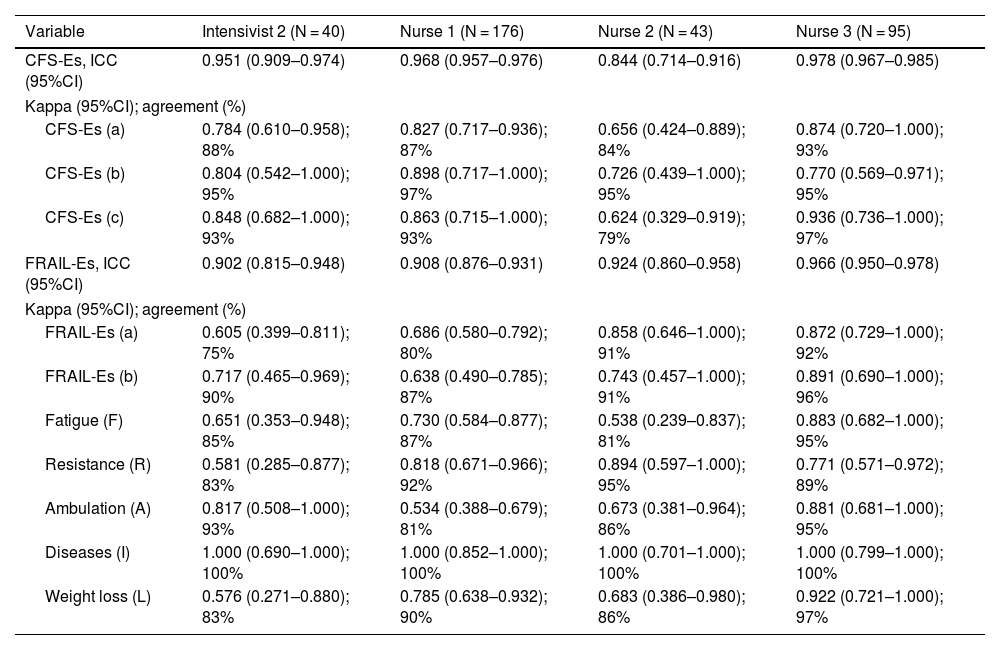
The ICC demonstrated near-perfect agreement between first and second evaluations by each professional, with values >0.80 for the CFS-Es and >0.90 for the FRAIL-Es (Table 3).
Intra-observer reliability of the Clinical Frailty Scale-Spain and the FRAIL-Spain.
| Variable | Intensivist 2 (N = 40) | Nurse 1 (N = 176) | Nurse 2 (N = 43) | Nurse 3 (N = 95) |
|---|---|---|---|---|
| CFS-Es, ICC (95%CI) | 0.951 (0.909–0.974) | 0.968 (0.957–0.976) | 0.844 (0.714–0.916) | 0.978 (0.967–0.985) |
| Kappa (95%CI); agreement (%) | ||||
| CFS-Es (a) | 0.784 (0.610–0.958); 88% | 0.827 (0.717–0.936); 87% | 0.656 (0.424–0.889); 84% | 0.874 (0.720–1.000); 93% |
| CFS-Es (b) | 0.804 (0.542–1.000); 95% | 0.898 (0.717–1.000); 97% | 0.726 (0.439–1.000); 95% | 0.770 (0.569–0.971); 95% |
| CFS-Es (c) | 0.848 (0.682–1.000); 93% | 0.863 (0.715–1.000); 93% | 0.624 (0.329–0.919); 79% | 0.936 (0.736–1.000); 97% |
| FRAIL-Es, ICC (95%CI) | 0.902 (0.815–0.948) | 0.908 (0.876–0.931) | 0.924 (0.860–0.958) | 0.966 (0.950–0.978) |
| Kappa (95%CI); agreement (%) | ||||
| FRAIL-Es (a) | 0.605 (0.399–0.811); 75% | 0.686 (0.580–0.792); 80% | 0.858 (0.646–1.000); 91% | 0.872 (0.729–1.000); 92% |
| FRAIL-Es (b) | 0.717 (0.465–0.969); 90% | 0.638 (0.490–0.785); 87% | 0.743 (0.457–1.000); 91% | 0.891 (0.690–1.000); 96% |
| Fatigue (F) | 0.651 (0.353–0.948); 85% | 0.730 (0.584–0.877); 87% | 0.538 (0.239–0.837); 81% | 0.883 (0.682–1.000); 95% |
| Resistance (R) | 0.581 (0.285–0.877); 83% | 0.818 (0.671–0.966); 92% | 0.894 (0.597–1.000); 95% | 0.771 (0.571–0.972); 89% |
| Ambulation (A) | 0.817 (0.508–1.000); 93% | 0.534 (0.388–0.679); 81% | 0.673 (0.381–0.964); 86% | 0.881 (0.681–1.000); 95% |
| Diseases (I) | 1.000 (0.690–1.000); 100% | 1.000 (0.852–1.000); 100% | 1.000 (0.701–1.000); 100% | 1.000 (0.799–1.000); 100% |
| Weight loss (L) | 0.576 (0.271–0.880); 83% | 0.785 (0.638–0.932); 90% | 0.683 (0.386–0.980); 86% | 0.922 (0.721–1.000); 97% |
ICC: intraclass correlation coefficient; 95%CI: 95% confidence interval.
CFS-Es: Clinical Frailty Scale-Spain; FRAIL-Es: FRAIL-Spain.
CFS-Es (a): non-frail (1–3), vulnerable (4), frail (5–9); CFS-Es (b): non-frail (1–4), frail (5–9); CFS-Es (c): non-frail (1–3), Frail (4–9).
FRAIL-Es (a): non-frail (0), pre-frail (1–2), frail (3–5); FRAIL-Es (b): non-frail (0–2), frail (3–5).
All comparisons p < 0.001.
When stratifying the scales, agreement levels ranged from substantial to near-perfect for both the CFS-Es and FRAIL-Es, depending on the stratification options. No significant differences in reliability were seen between nurses and intensivists. The FRAIL-Es dimensions with the lowest agreement were fatigue and ambulation, while comorbidities showed the highest agreement (Table 3).
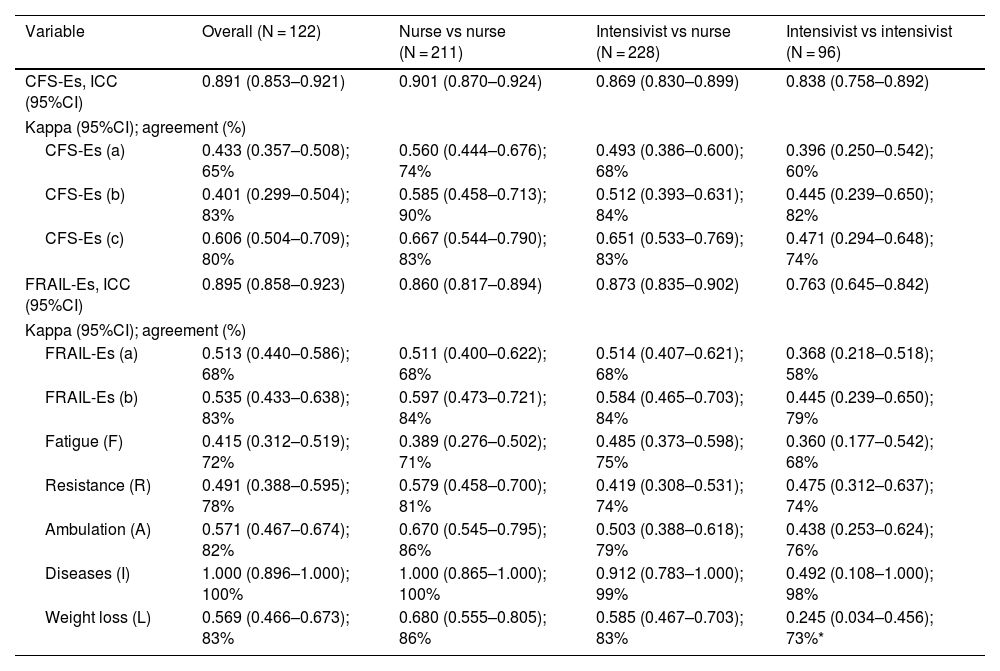
Inter-observer reliabilityAgreement among different professionals, measured by ICC (95%CI), was nearly perfect for both CFS-Es and FRAIL-Es. The lowest agreement was seen in FRAIL-Es evaluations among intensivists [ICC (95%CI), 0.763 (0.645–0.842); p < 0.001] (Table 4).
Inter-observer reliability of the Clinical Frailty Scale-Spain and the FRAIL-Spain.
| Variable | Overall (N = 122) | Nurse vs nurse (N = 211) | Intensivist vs nurse (N = 228) | Intensivist vs intensivist (N = 96) |
|---|---|---|---|---|
| CFS-Es, ICC (95%CI) | 0.891 (0.853–0.921) | 0.901 (0.870–0.924) | 0.869 (0.830–0.899) | 0.838 (0.758–0.892) |
| Kappa (95%CI); agreement (%) | ||||
| CFS-Es (a) | 0.433 (0.357–0.508); 65% | 0.560 (0.444–0.676); 74% | 0.493 (0.386–0.600); 68% | 0.396 (0.250–0.542); 60% |
| CFS-Es (b) | 0.401 (0.299–0.504); 83% | 0.585 (0.458–0.713); 90% | 0.512 (0.393–0.631); 84% | 0.445 (0.239–0.650); 82% |
| CFS-Es (c) | 0.606 (0.504–0.709); 80% | 0.667 (0.544–0.790); 83% | 0.651 (0.533–0.769); 83% | 0.471 (0.294–0.648); 74% |
| FRAIL-Es, ICC (95%CI) | 0.895 (0.858–0.923) | 0.860 (0.817–0.894) | 0.873 (0.835–0.902) | 0.763 (0.645–0.842) |
| Kappa (95%CI); agreement (%) | ||||
| FRAIL-Es (a) | 0.513 (0.440–0.586); 68% | 0.511 (0.400–0.622); 68% | 0.514 (0.407–0.621); 68% | 0.368 (0.218–0.518); 58% |
| FRAIL-Es (b) | 0.535 (0.433–0.638); 83% | 0.597 (0.473–0.721); 84% | 0.584 (0.465–0.703); 84% | 0.445 (0.239–0.650); 79% |
| Fatigue (F) | 0.415 (0.312–0.519); 72% | 0.389 (0.276–0.502); 71% | 0.485 (0.373–0.598); 75% | 0.360 (0.177–0.542); 68% |
| Resistance (R) | 0.491 (0.388–0.595); 78% | 0.579 (0.458–0.700); 81% | 0.419 (0.308–0.531); 74% | 0.475 (0.312–0.637); 74% |
| Ambulation (A) | 0.571 (0.467–0.674); 82% | 0.670 (0.545–0.795); 86% | 0.503 (0.388–0.618); 79% | 0.438 (0.253–0.624); 76% |
| Diseases (I) | 1.000 (0.896–1.000); 100% | 1.000 (0.865–1.000); 100% | 0.912 (0.783–1.000); 99% | 0.492 (0.108–1.000); 98% |
| Weight loss (L) | 0.569 (0.466–0.673); 83% | 0.680 (0.555–0.805); 86% | 0.585 (0.467–0.703); 83% | 0.245 (0.034–0.456); 73%* |
ICC: intraclass correlation coefficient; 95%CI: 95% confidence interval.
CFS-Es: Clinical Frailty Scale-Spain; FRAIL-Es: FRAIL-Spain.
CFS-Es (a): non-frail (1–3), vulnerable (4), frail (5–9); CFS-Es (b): non-frail (1–4), frail (5–9); CFS-Es (c): non-frail (1–3), frail (4–9).
FRAIL-Es (a): non-frail (0), pre-frail (1–2), frail (3–5); FRAIL-Es (b): non-frail (0–2), frail (3–5).
Stratified scale analysis revealed moderate to substantial agreement for both the CFS-Es and FRAIL-Es, depending on stratification. The highest agreement for CFS-Es occurred when patients were categorized into 2 strata (non-frail and frail), considering patients at level 4 as frail (Option C). Intensivists showed lower agreement vs nurses. Also, agreement was lower between intensivists and nurses. FRAIL-Es dimensions with the lowest agreement among professionals were weight loss and fatigue, while comorbidities showed the highest agreement (Table 4).
Internal consistency of the FRAIL-EsThe FRAIL-Es showed high reliability measured by Kuder-Richardson Formula 20 (95%CI), 0.643 (0.608–0.677). Strong correlations were observed between 4 different dimensions (Fatigue, Resistance, Ambulation, and Involuntary Weight Loss) and the global scale score, while the comorbidities dimension showed weak correlation (Table 5).
DiscussionThe reliability of the CFS-Es and FRAIL-Es frailty scales is high, and the FRAIL-Es demonstrates strong internal consistency, regardless of the professional implementing them.
Intra-observer reliabilityThe CFS-Es intra-observer reliability is consistent with the results reported by Abraham et al. in the validation of the French version implemented by nurses [ICC (95%CI), 0.87 (0.76–0.93)] and intensivists [ICC (95%CI), 0.86 (0.72–0.93)]. Other validated versions in non-critical patients also show excellent intra-observer reliability, such as the Portuguese30 [ICC (95%CI), 0.999 (0.998–0.999)] and Greek versions31 [ICC (95%CI), 0.89 (0.85–0.92)]. The Brazilian version29 reported lower reliability (ICC, 0.641). These findings confirm that the CFS-Es has very good intra-observer reliability, whether implemented by nurses or intensivists.
Furthermore, the FRAIL-Es also shows very high intra-observer reliability, outperforming the Mexican (ICC, 0.82) and Chinese (ICC, 0.708) versions. The comorbidities dimension achieved 100% agreement, likely due to its objective assessment based on patient health records, whereas other dimensions relied on information from patients or families.
Inter-observer reliabilityThe reliability of the CFS-Es across different observers was similar to the one reported by Vrettos et al.31 in their validation study of the Greek version in non-critical hospitalized elderly patients [ICC (95%CI), 0.87(0.82−0.90)]. On the other hand, the reliability data of the CFS-Es exceed that reported by Abraham et al.22 in the validation of the French version among intensivists [ICC (95%CI), 0.76(0.57−0.87)] intensive care nurses [ICC (95%CI), 0.76(0.57−0.87)] or between intensivists and nurses [ICC (95%CI), 0.75(0.56−0.87) and 0.73(0.52−0.85), respectively, as well as the reliability data reported by Rodrigues et al.29 (ICC, 0.350) in the validation of the Brazilian version among volunteers. In their validation of the Danish version, Nissen et al.26 achieved higher reliability among intensivists [ICC (95%CI), 0.90(0.82−0.96)], but this validation was not conducted with patient or family interviews. Instead, it involved the evaluation of written case reports, thereby excluding potential variability in patient and family responses. Even so, their reliability data are very close to those reported for the CFS-Es.
Although we did not find any studies evaluating the reliability of the FRAIL scale in critical patients, 2 studies that evaluated it among non-hospitalized adults report reliability scores lower than those of the FRAIL-Es (ICC, 0.82 in the Mexican version35 and ICC, 0.708 in the Chinese version3).4
Regarding agreement among groups, 5 studies implemented in critical patients evaluate the reliability of the CFS.23–25,28,32 In the study by Flaatten et al.,32 intensivists and intensive care nurses assessed the frailty of elderly patients (<80 years) and categorized them into 3 strata (CFS = 1–3 not frail, CFS = 4 vulnerable, and CFS = 5–9 frail). The reliability obtained among intensivists was higher than that of the CFS-Es [K(95%CI, 0.80 (0.77−0.84)] as was the reliability among nurses [K(95%CI, 0.77(0.71−0.83)], and between intensivists and nurses [K(95%CI, 0.77(0.71−0.83) and 0.80(0.77−0.84), respectively]. This superiority may be related to the fact that it was a multicenter study with 3920 patients from 22 European countries that obtained a total of 1923 pairs of evaluations. Surkan et al.28 implemented the CFS (the original English version) in 158 ICU patients older than 18 years. The reliability between an intensivist and a geriatric resident or geriatrician was much lower than that obtained for the CFS-Es [K (95%CI, 0.32 (0.17–0.46) and 0.29 (−0.11 to 0.69), respectively].
In the study by Pugh et al.,25 the CFS (original in English) was also implemented by intensivists and intensive care nurses. However, in this case, patients were categorized into 2 groups (CFS = 1–4 and CFS = 5–9). The reliability obtained was more similar to that of the CFS-Es [K(95%CI, intensivist-nurse 0.59 (0.44–0.75), nurse-nurse 0.63 (0.45–0.82)], except among intensivists, in whom it was higher [K (95%CI, 0.70 (0.67–0.80)]. However, the agreement percentage among intensivists was 63% vs 82% for the CFS-Es. Similarly, Hope et al.,24 who analyzed variability among researchers, patients, or relatives, obtained reliability scores among the 3 groups (CFS = 1–3, CFS = 4, and CFS = 5–9; K (95%CI, 0.43 (0.42–0.46)] similar to the overall reliability of the CFS-Es and slightly higher [K (95%CI, 0.62 (0.53 to 0.70)] when analyzing variability by categorizing patients into 2 groups (CFS = 1–4 and CFS = 5–9). In a retrospective study, Darvall et al.23 reported a Kappa coefficient of 0.67 and an agreement percentage of 45% between the observations made by a researcher and a resident intensivist, which is a Kappa coefficient slightly higher than the CFS-Es with a lower agreement percentage. Moreover, it is important to note that the evaluations from study by Darvall et al.23 were conducted after reviewing the patients’ health records, excluding potential variability from patient or family interviews.
Finally, the inter-observer reliability by groups for the CFS-Es is lower than that reported for the Turkish27 (K, 0.811) and Chinese33 (K, 0.60) versions, both implemented in ambulatory patients older than 65 years.
We did not find any studies evaluating inter-observer agreement for the FRAIL scale or its different versions. The overall data for the FRAIL-Es are moderate, whether analyzing agreement between 2 (non-frail and frail) or 3 groups (non-frail, pre-frail, and frail). The evaluations conducted by intensivists yielded the lowest scores, likely due to moderate agreement in the illness and weight loss dimensions. The Kappa coefficient of 0.492 among intensivists in the illness dimension, was undoubtedly influenced by the sample, as the agreement among intensivists was 98%, and the 2 evaluations were based on the same health record. Unintentional weight loss showed fair agreement among intensivists and moderate or substantial agreement in other comparisons (intensivist vs nurse and nurse vs nurse, respectively), possibly due to the difficulty in quantifying this dimension. Some patients were never weighed and unaware of their weight change, though repeated questioning could lead to reflection and greater clarity in the second evaluation.
Internal consistency of FRAIL-EspañaThe internal consistency of FRAIL-Es, measured using the Kuder-Richardson Formula 20, is higher than that observed by Dong et al.34 in the Chinese version of the FRAIL (KR-20 = 0.485) and by Aprahamian et al.36,37 in the Brazilian Portuguese version (KR-20 (95%CI), 0.447 (0.290–0.605) and KR-20 = 0.53). Although a high internal consistency was achieved, it may not have been higher due to the low number of items (5) included in the scale.46 The correlation between the items of the scale and the overall assessment was strong, except for the comorbidities item. This issue has also been reported by Rosas-Carrasco et al.35 in the Mexican Spanish version and by Susanto et al.,48 who obtained lower correlations than those of FRAIL-Es. Rosas-Carrasco et al.35 suggested that the reason for this low correlation may be that comorbidities are not as closely related to the development of frailty as the other dimensions of the scale are. However, in our cohort, we observed that frail patients (FRAIL-Es = 3–5) had a significantly higher Charlson Index vs non-frail patients (FRAIL-Es = 0–2). Certainly, comorbidities are related to frailty, though possibly to a lesser degree than the other dimensions evaluated. Alternatively, this may be related to representativeness, as only 4% of patients exhibited the comorbidities dimension.
Strengths and limitations of the studyThe primary strength of this study is evaluating whether the scales are equally reliable when implemented by intensive care nurses or intensivists. Frailty assessment should be interprofessional, as a patient's frailty level may impact nursing care and/or medical treatment.
Disagreements when evaluating the same patient (either between different evaluators or by the same evaluator at different times) could have been influenced by varying responses from patients and families. It was not always possible to conduct all evaluations with the patient or their relatives. Additionally, responses could be influenced by social desirability bias, where participants only give responses they believe to be appropriate rather than truthful. When multiple relatives were present, efforts were made to include everyone in the responses to reach a consensus, but this was not always feasible. Obtaining an objective assessment is challenging, both with a scale using closed questions (like FRAIL-Es) and with open-ended scales dependent on the professional's expertise (like CFS-Es).
Furthermore, studies evaluating reliability in critical patients are scarce, with some focusing on very specific populations (>60 or >80 years) and implemented by different professionals, making comparisons with the present study difficult.
Another limitation could be the lack of prior training for professionals implementing the scales. Although they were familiar with the scales, they did not use them routinely, and the learning curve may have influenced their reliability.49 In this regard, comparisons with other studies were not possible, as such data were not reported.
It could also be considered a limitation the fact that not all evaluators were able to assess patient frailty at 2 different timeframes. While desirable, the patients’ clinical and/or care conditions did not always allow this.
Recommendations for future researchAfter establishing the reliability of the scales when implemented in critical patients, it would be interesting to analyze the reliability of these scales in a different cohort of patients or in non-hospitalized adults.
ConclusionsThe CFS-Es and FRAIL-Es scales are reliable for assessing frailty in critically ill patients, whether implemented by intensive care nurses or intensivists.
CRediT authorship contribution statementSusana Arias-Rivera: Conceptualization, Methodology, Software, Validation, Formal Analysis, Research, Resources, Data Management, Drafting, Writing – Review & Editing, Visualization, Supervision, Project Administration, Funding Acquisition. María Mar Sánchez-Sánchez: Validation, Research, Resources, Writing – Review & Editing. Raquel Jareño-Collado: Validation, Research, Resources, Writing – Review & Editing. Marta Raurell-Torredà: Methodology, Validation, Research, Resources, Writing – Review & Editing, Visualization. Lorena Oteiza-López: Validation, Research, Resources, Writing – Review & Editing. Sonia López-Cuenca: Validation, Research, Resources, Writing – Review & Editing. Israel John Thuissard-Vasallo: Validation, Formal Analysis, Research, Resources, Writing – Review & Editing. Fernando Frutos-Vivar: Validation, Research, Resources, Writing – Review & Editing, Visualization.
Critical review of intellectual content: all authors reviewed the final manuscript before submission for publication.
FundingThis work received support from the Spanish Ministry of Economy and Competitiveness, ISCIII-FIS, grant PI20/01231.
None declared.
None declared.

