To evaluate changes in the epidemiology of mechanical ventilation in Spain from 1998 to 2016.
DesignA post hoc analysis of four cohort studies was carried out.
SettingA total of 138 Spanish ICUs.
PatientsA sample of 4293 patients requiring invasive mechanical ventilation for more than 12 h or noninvasive ventilation for more than one hour.
InterventionsNone.
Variables of interestDemographic variables, reason for mechanical ventilation, variables related to ventilatory support (ventilation mode, tidal volume, PEEP, airway pressures), complications during mechanical ventilation, duration of mechanical ventilation, ICU stay and ICU mortality.
ResultsThere was an increase in severity (SAPS II 43 points in 1998 vs. 47 points in 2016), changes in the reason for mechanical ventilation (decrease in chronic obstructive pulmonary disease and acute respiratory failure secondary to trauma, and increase in neurological disease and post-cardiac arrest). There was an increase in noninvasive mechanical ventilation as the first mode of ventilatory support (p < 0.001). Volume control ventilation was the most commonly used mode, with increased support pressure and pressure-regulated volume-controlled ventilation. A decrease in tidal volume was observed (9 ml/kg actual b.w. in 1998 and 6.6 ml/kg in 2016; p < 0.001) as well as an increase in PEEP (3 cmH2O in 1998 and 6 cmH2O in 2016; p < 0.001). In-ICU mortality decreased (34% in 1998 and 27% in 2016; p < 0.001), without geographical variability (median OR 1.43; p = 0.258).
ConclusionsA significant decrease in mortality was observed in patients ventilated in Spanish ICUs. These changes in mortality could be related to modifications in ventilation strategy to minimize ventilator-induced lung injury.
Evaluar cambios en la epidemiología de la ventilación mecánica en España desde 1998 hasta 2016.
DiseñoAnálisis post-hoc de cuatro estudios de cohortes.
Ámbito138 UCI españolas.
Pacientes4293 enfermos con ventilación mecánica invasiva más de 12 horas o no invasiva más de una hora.
IntervencionesNinguna.
Variables de interés principalesDemográficas, motivo de ventilación mecánica, relacionadas con el soporte ventilatorio (modo de ventilación, volumen tidal, PEEP, presiones en vía aérea), complicaciones, duración de la ventilación mecánica, estancia y mortalidad en la UCI.
ResultadosSe observa aumento en la gravedad (SAPS II 43 puntos en 1998 frente a 47 puntos en 2016), cambios en el motivo de la ventilación mecánica (disminución de la enfermedad pulmonar obstructiva crónica e insuficiencia respiratoria secundaria a traumatismo y aumento de la patología neurológica y tras parada cardiaca). Aumento en la ventilación no invasiva como primer modo de soporte ventilatorio (p < 0,001). El modo más utilizado es la ventilación controlada por volumen con un aumento de la presión de soporte y de la ventilación controlada por volumen regulada por presión. Disminuyó el volumen tidal (9 ml/kg peso estimado en 1998 y 6,6 ml/kg en 2016, p < 0,001) y aumentó la PEEP (3 cmH2O en 1998 y 6 cmH2O en 2016, p < 0,001). La mortalidad disminuye (34% en 1998 y 27% en 2016; p < 0,001) sin variabilidad geográfica (MOR 1,43; p = 0,258).
ConclusionesSe observa una disminución en la mortalidad de los enfermos ventilados en UCI españolas. Esta disminución podría estar relacionada con cambios para minimizar el daño inducido por el ventilador.
Mechanical ventilation (MV) is probably the most widely used therapeutic procedure in Intensive Care Units (ICUs), and is a technique with a long history. Following a period of ventilation with negative pressure, induced by the invention of the iron lung in 1929, Ibsen introduced positive pressure ventilation outside the operating room in 1952.1 This marked the birth of the Intensive Care Unit. Observational studies2–10 have shown the percentage of patients admitted to the ICU who require MV to be between 33–53%. Studies in the general population11 in turn have found that about 2% of all adults receive MV at one time or other (39% during more than 96 h), and the percentage is moreover rising.12–16
Although the use of MV is associated to a decrease in mortality among patients with acute respiratory failure (ARF), the technique is not without complications17 — the most important of which is ventilator-induced lung injury, which can sustain or worsen lung dysfunction. As a result, in the last few decades many clinical trials have been carried out with the purpose of preventing or minimizing ventilator-induced lung injury, based on the use of noninvasive positive pressure ventilation,18 lung protective ventilation strategies,19,20 adjustment of positive end-expiratory pressure (PEEP),21 ventilation in prone decubitus22 and the early use of neuromuscular blockers,23 and of reducing the duration of MV through the adjustment of sedation24,25 and early identification of the moment for starting patient weaning from MV.26 Some of these interventions, which initially focused on the management of patients with acute respiratory distress syndrome (ARDS), now appear to be applicable to all patients subjected to MV.27
The present study was carried out to evaluate the changes that have taken place in the way in which MV is applied in patients admitted to Spanish ICUs participating in four international studies on MV. In addition, an analysis was made to determine whether such changes are accompanied by changes in patient outcomes, and whether variability is observed conditioned to the geographical setting involved, according to the different regional societies of the Spanish Society of Intensive and Critical Care Medicine and Coronary Units (Sociedad Española de Medicina Intensiva, Crítica y Unidades Coronarias [SEMICYUC]). Some of the results of this analysis have been previously published in a Doctoral Thesis.28
Patients and methodsA post hoc analysis was made of four prospective, multicenter observational studies carried out during a one-month period in the years 1998,4,29,30 2004,31 201032 and 2016.33 The studies included patients requiring invasive MV during more than 12 h or noninvasive ventilation during more than one hour. For the purpose of the present analysis, we only included those patients admitted to ICUs in Spain.
The methodology used was similar in all four studies, with some differences in the recorded variables (the list of variables compiled in each study are described in Table S1 of the Supplementary material). All the studies recorded the following variables: basal demographic data (age, gender, estimated weight and height, severity estimated by the SAPS II score), and reason for starting MV. Likewise, the following parameters were recorded on a daily basis and for as long as the patient was subjected to MV (up to a maximum of 28 days): arterial gases, parameters programmed and measured by the ventilator (mode, tidal volume, respiratory frequency, fraction of inspired oxygen, PEEP, peak pressure, plateau pressure), administration of sedatives and neuromuscular blockers, and the appearance of complications such as ARDS, ventilator-associated pneumonia (VAP), sepsis and organ dysfunction (cardiovascular, renal, hepatic, hematological), and the date of and situation at discharge from the ICU and from hospital. Table S2 of the Supplementary material describes the operating definitions used. The Ethics Committees of each hospital approved the study protocol, and the need for informed consent was adjusted to the decision of each Committee.
In the studies of 1998 and 2004, each investigator received a manual describing the data to be recorded and the definitions used, together with data recording forms in paper format. The investigators completed a form for each patient included in the study and forwarded it to the coordinating center (Hospital Universitario de Getafe, Madrid) for inclusion in an electronic database. In the studies of 2010 and 2016, data registry took place through a secure website. In addition, before the analysis, all the data were checked for atypical and potentially erroneous values and information. The cases with missing information referred to principal study variables were not included in the analysis. The STROBE (Strengthening the Reporting of Observational Studies in Epidemiology) statement on observational cohort studies was followed.34
Statistical analysisThe results were reported as the mean (standard deviation [SD]), median (percentile 25, percentile 75), absolute frequencies and proportions, as applicable. The comparison of continuous variables was made based on analysis of variance (ANOVA) or the Kruskal–Wallis test, while the chi-square test was used for the comparison of categorical variables.
In order to estimate the changes over time in the different ventilatory strategies, we chose two of them: noninvasive ventilation as first ventilatory support mode, and the early application (within the first 48 h of ventilatory support) of a protective ventilation strategy, defined as a tidal volume < 6 ml/kg estimated body weight (b.w.) or a tidal volume < 8 ml/kg and a peak pressure or plateau pressure <30 cmH2O. To the effects of analysis, and for each strategy, a multivariate logistic regression model was generated. The model included the following variables: year-study (coded as dummy variable ), age, gender, SAPS II score, and the reason for starting MV recoded into three groups: exacerbated chronic respiratory failure (chronic obstructive pulmonary disease [COPD], asthma, other chronic lung disease), hypoxemic acute respiratory failure (ARDS, postoperative respiratory failure, heart failure, pneumonia, sepsis, aspiration, trauma), and neurological disease. Multilevel estimation adjustment was performed (patients at the first level and regional societies at the second level). Estimation of the random variability of the results among the regional societies of the SEMICYUC was based on calculation of the median odds ratio (MOR), defined as the mean value of the odds ratio (OR) between two patients corresponding to different regional societies (one of greater risk and the other of lesser risk) and equal values in all the variables of the model, on randomly selecting two societies. The MOR may be conceived as the median increase in risk which a patient would have on being transferred to a geographical region of greater risk.35
Estimation of the evolution over time of mortality in the ICU was based on a logistic regression model, with multilevel estimation adjustment (patients at the first level and regional societies at the second level). The model included the following variables: year-study (coded as dummy variable ), age, gender, SAPS II score, reason for starting MV, variables related to the patient course during MV (complications during MV, such as ARDS, sepsis, ventilator-associated pneumonia, organ dysfunction), variables related to ventilatory support (use of noninvasive ventilation, protective ventilation strategy) and variables related to treatment (sedation, neuromuscular block). Estimation of the random variability of the results among the regional societies was based on calculation of the MOR.
The Stata 14.0 statistical package (StataCorp LP, College Station, TX, USA) was used throughout for data analysis.
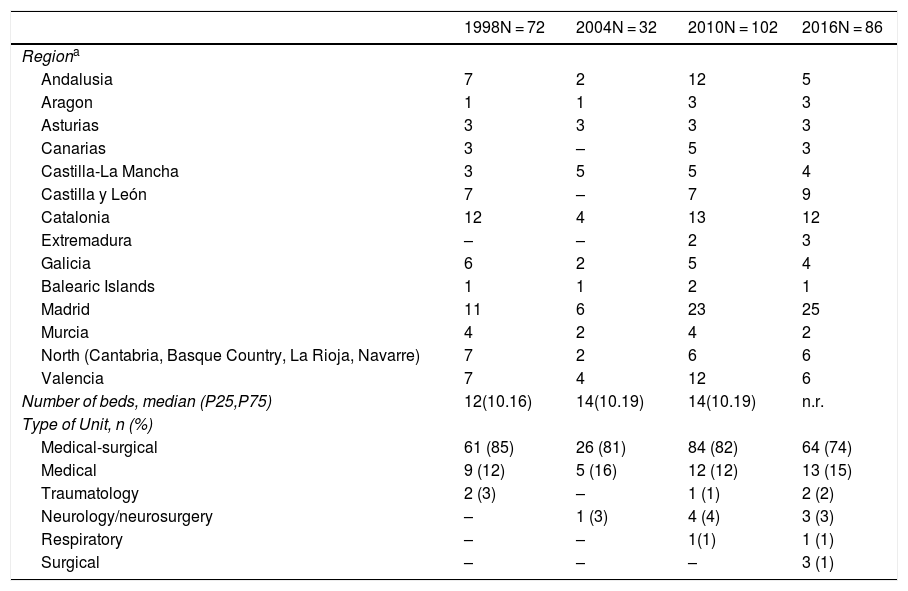
ResultsParticipating Units and included patientsA total of 138 ICUs participated in the four studies, and 14 of them (10%) participated in all four studies. Table 1 shows the distribution by geographical areas and the characteristics of the Units participating in each study.
Comparison of the characteristics of the Intensive Care Units participating in each study.
| 1998N = 72 | 2004N = 32 | 2010N = 102 | 2016N = 86 | |
|---|---|---|---|---|
| Regiona | ||||
| Andalusia | 7 | 2 | 12 | 5 |
| Aragon | 1 | 1 | 3 | 3 |
| Asturias | 3 | 3 | 3 | 3 |
| Canarias | 3 | – | 5 | 3 |
| Castilla-La Mancha | 3 | 5 | 5 | 4 |
| Castilla y León | 7 | – | 7 | 9 |
| Catalonia | 12 | 4 | 13 | 12 |
| Extremadura | – | – | 2 | 3 |
| Galicia | 6 | 2 | 5 | 4 |
| Balearic Islands | 1 | 1 | 2 | 1 |
| Madrid | 11 | 6 | 23 | 25 |
| Murcia | 4 | 2 | 4 | 2 |
| North (Cantabria, Basque Country, La Rioja, Navarre) | 7 | 2 | 6 | 6 |
| Valencia | 7 | 4 | 12 | 6 |
| Number of beds, median (P25,P75) | 12(10.16) | 14(10.19) | 14(10.19) | n.r. |
| Type of Unit, n (%) | ||||
| Medical-surgical | 61 (85) | 26 (81) | 84 (82) | 64 (74) |
| Medical | 9 (12) | 5 (16) | 12 (12) | 13 (15) |
| Traumatology | 2 (3) | – | 1 (1) | 2 (2) |
| Neurology/neurosurgery | – | 1 (3) | 4 (4) | 3 (3) |
| Respiratory | – | – | 1(1) | 1 (1) |
| Surgical | – | – | – | 3 (1) |
n.r.: not registered.
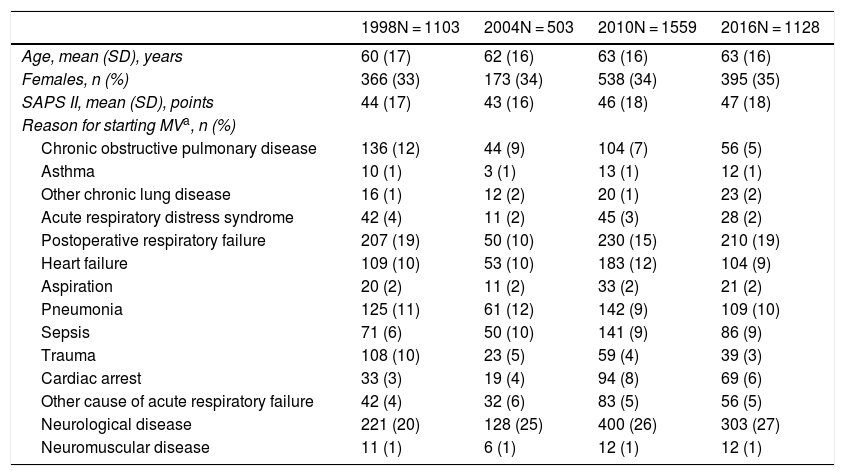
In the course of the study periods, a total of 17,205 patients were admitted to the participating Units; of these patients, 4293 (25%) met the inclusion criteria. Table 2 compares the basal characteristics of the patients among the four studies. One feature that persisted over time was the fact that patients requiring MV were typically males in the sixth decade of life, though an increase was observed in patient severity upon admission (from a mean SAPS II score of 43 points in 1998, estimating an in-hospital mortality rate of 30.5%, to a mean SAPS II score of 47 points in 2016, estimating an in-hospital mortality rate of 39%; p < 0.001), as well as a significant change (p < 0.001) in the reason for mechanical ventilation (decrease in COPD and of acute respiratory failure secondary to trauma, and increase in neurological disease and post-cardiac arrest).
Comparison of the basal characteristics of the patients included in each study.
| 1998N = 1103 | 2004N = 503 | 2010N = 1559 | 2016N = 1128 | |
|---|---|---|---|---|
| Age, mean (SD), years | 60 (17) | 62 (16) | 63 (16) | 63 (16) |
| Females, n (%) | 366 (33) | 173 (34) | 538 (34) | 395 (35) |
| SAPS II, mean (SD), points | 44 (17) | 43 (16) | 46 (18) | 47 (18) |
| Reason for starting MVa, n (%) | ||||
| Chronic obstructive pulmonary disease | 136 (12) | 44 (9) | 104 (7) | 56 (5) |
| Asthma | 10 (1) | 3 (1) | 13 (1) | 12 (1) |
| Other chronic lung disease | 16 (1) | 12 (2) | 20 (1) | 23 (2) |
| Acute respiratory distress syndrome | 42 (4) | 11 (2) | 45 (3) | 28 (2) |
| Postoperative respiratory failure | 207 (19) | 50 (10) | 230 (15) | 210 (19) |
| Heart failure | 109 (10) | 53 (10) | 183 (12) | 104 (9) |
| Aspiration | 20 (2) | 11 (2) | 33 (2) | 21 (2) |
| Pneumonia | 125 (11) | 61 (12) | 142 (9) | 109 (10) |
| Sepsis | 71 (6) | 50 (10) | 141 (9) | 86 (9) |
| Trauma | 108 (10) | 23 (5) | 59 (4) | 39 (3) |
| Cardiac arrest | 33 (3) | 19 (4) | 94 (8) | 69 (6) |
| Other cause of acute respiratory failure | 42 (4) | 32 (6) | 83 (5) | 56 (5) |
| Neurological disease | 221 (20) | 128 (25) | 400 (26) | 303 (27) |
| Neuromuscular disease | 11 (1) | 6 (1) | 12 (1) | 12 (1) |
Over time, a significant increase was observed (p < 0.001) in the application of noninvasive mechanical ventilation as first ventilatory support mode, though with a tendency to decrease in the last study: in 1998, a total of 4% of the patients were initially subjected to noninvasive ventilation, versus 18%, 21% and 17% in 2004, 2010 and 2016, respectively. Table S3 of the Supplementary material shows the characteristics of the patients initially subjected to noninvasive ventilation.
The duration of noninvasive ventilation in the ICU also changed over time, with a median of 36 h in 2004, 23 h in 2010, and 27 h in 2016. Approximately one-third of the patients required invasive ventilation (Table S3 of the Supplementary material). Significant variations were observed (p < 0.001) in the percentage failure rate, due to greater failure in the year 2004 (41%) versus similar percentages in the other three studies.
In the multivariate analysis, on adjusting for demographic variables and the reason for starting MV, a significant increase in the use of the technique was observed over time (Fig. 1). Geographic variability was recorded in the application of noninvasive ventilation, though such variability decreased over time from MOR 1.85 (95% confidence interval [95%CI]: 0.90–2.80) in 1998 to MOR 1.44 (95% confidence interval: 1.14–1.74) in 2016.
Adjusted probability of the use of noninvasive ventilation and of protective ventilation strategies over time. Adjustment is made according to year-study (coded as dummy variable, taking as reference the first study published in 1998), age, gender, SAPS II score and reason for starting MV.
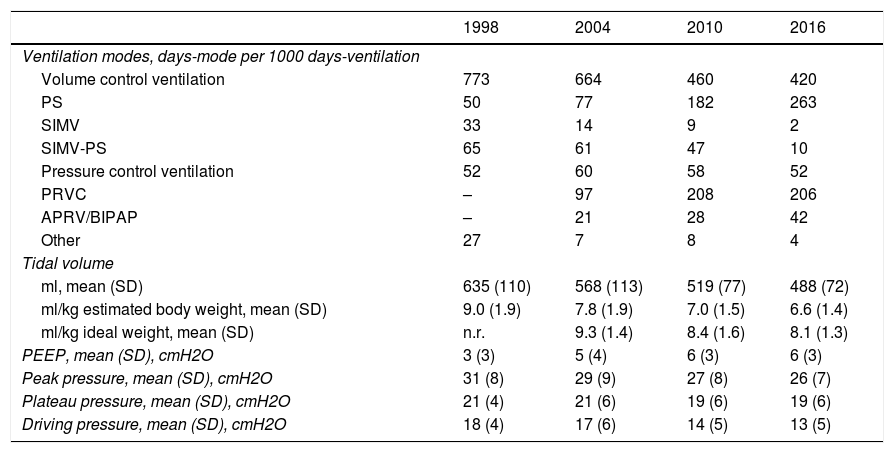
Table 3 compares the changes recorded in ventilation modes and ventilatory parameters. From the time of the first study, significant changes were seen in the way of ventilating the patients. Although volume control ventilation remained the most widely used ventilation mode, a gradual increase was observed in the use of pressure support and dual modes such as pressure-regulated volume control ventilation.
Evolution of the use of ventilation modes and programmed ventilatory parameters at the start of mechanical ventilation.
| 1998 | 2004 | 2010 | 2016 | |
|---|---|---|---|---|
| Ventilation modes, days-mode per 1000 days-ventilation | ||||
| Volume control ventilation | 773 | 664 | 460 | 420 |
| PS | 50 | 77 | 182 | 263 |
| SIMV | 33 | 14 | 9 | 2 |
| SIMV-PS | 65 | 61 | 47 | 10 |
| Pressure control ventilation | 52 | 60 | 58 | 52 |
| PRVC | – | 97 | 208 | 206 |
| APRV/BIPAP | – | 21 | 28 | 42 |
| Other | 27 | 7 | 8 | 4 |
| Tidal volume | ||||
| ml, mean (SD) | 635 (110) | 568 (113) | 519 (77) | 488 (72) |
| ml/kg estimated body weight, mean (SD) | 9.0 (1.9) | 7.8 (1.9) | 7.0 (1.5) | 6.6 (1.4) |
| ml/kg ideal weight, mean (SD) | n.r. | 9.3 (1.4) | 8.4 (1.6) | 8.1 (1.3) |
| PEEP, mean (SD), cmH2O | 3 (3) | 5 (4) | 6 (3) | 6 (3) |
| Peak pressure, mean (SD), cmH2O | 31 (8) | 29 (9) | 27 (8) | 26 (7) |
| Plateau pressure, mean (SD), cmH2O | 21 (4) | 21 (6) | 19 (6) | 19 (6) |
| Driving pressure, mean (SD), cmH2O | 18 (4) | 17 (6) | 14 (5) | 13 (5) |
APRV: airway pressure release ventilation; BIPAP: bilevel/biphasic positive airway pressure; PRVC: pressure-regulated volume control; SD: standard deviation; n.r.: not registered; SIMV: synchronized intermittent mandatory ventilation; PEEP: positive end-expiratory pressure; PS: pressure support.
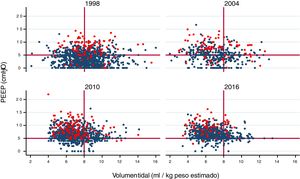
A gradual decrease was observed in programmed tidal volume, from an average of 9 ml/kg estimated body weight in 1998 to a mean tidal volume of 6.6 ml/kg estimated body weight in 2016 (p < 0.001) (Fig. 2A), together with a statistically significant increase (p < 0.001) in applied PEEP, from an average of 3 cmH2O in 1998 to a mean PEEP of 6 cmH2O in 2016 (Fig. 2B). Fig. 3 shows the time course of the tidal volume-PEEP ratio in patients with and without criteria of ARDS.
Cumulative proportion (in each year of study) of patients according to: A) tidal volume in ml/kg estimated body weight. A curve shift to the left is observed over time, indicating that a greater proportion of patients are being ventilated with a lesser tidal volume; B) PEEP in cmH2O. A curve shift to the right is observed over time, indicating that there has been an increase in the PEEP level with which the patients are ventilated.
Relationship between tidal volume (in ml/kg estimated body weight) and PEEP in each year of study. A gradual shift upwards and to the left is observed, indicating that ventilation is performed with lower tidal volume settings and higher PEEP levels, in both patients with ARDS (red circles) and in patients without ARDS (blue circles).
The mentioned changes implied a significant decrease (p < 0.001) in both plateau pressure and driving pressure (Table 3).
Likewise, the group of patients with ARDS (associated to MV or as a complication arising during MV) showed an increase in ventilation in prone decubitus, from 16% in 1998 to 3% in 2004, 13% in 2010 and 30% in 2016.
The adjusted model for assessing the evolution over time of the early application (within the first 48 h of ventilatory support) of a protective ventilation strategy revealed a significant increase over time (Fig. 1). Geographical differences were also observed with this strategy, varying from MOR 1.69 (95%CI: 1.26–2.12) in 1998 to MOR 1.55 (95%CI: 1.22–1.87) in 2016.
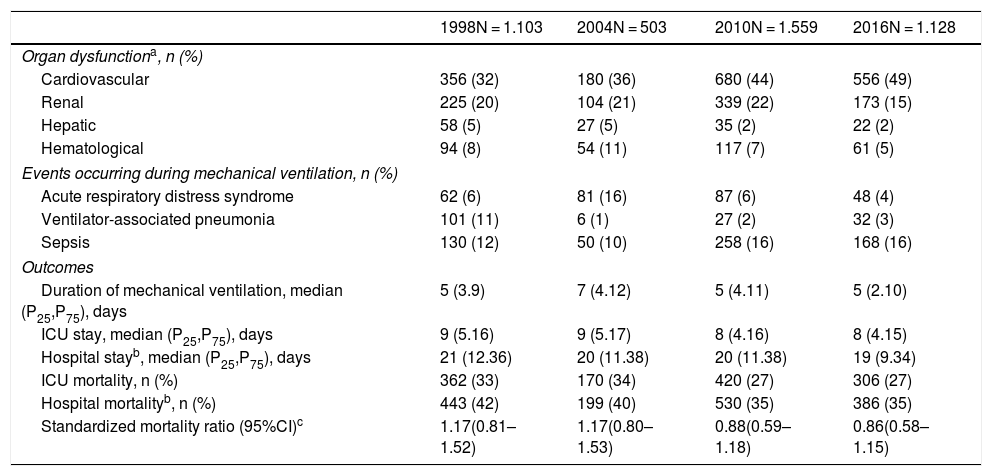
OutcomesTable 4 shows the variation of outcomes over time. In general, statistically significant changes were recorded referred to the presence of complications and organ dysfunction, with a clinically relevant variation over time of some complications (e.g., an extraordinarily high incidence of ARDS in the study of 2004). It should be noted that although there were statistically significant differences, in the case of the duration of ventilatory support they could be less relevant from the clinical perspective (differences of only 1–2 days). Likewise, no relevant differences were observed in the days of stay in the ICU or in hospital.
Evolution of the complications during mechanical ventilation and of the main outcomes.
| 1998N = 1.103 | 2004N = 503 | 2010N = 1.559 | 2016N = 1.128 | |
|---|---|---|---|---|
| Organ dysfunctiona, n (%) | ||||
| Cardiovascular | 356 (32) | 180 (36) | 680 (44) | 556 (49) |
| Renal | 225 (20) | 104 (21) | 339 (22) | 173 (15) |
| Hepatic | 58 (5) | 27 (5) | 35 (2) | 22 (2) |
| Hematological | 94 (8) | 54 (11) | 117 (7) | 61 (5) |
| Events occurring during mechanical ventilation, n (%) | ||||
| Acute respiratory distress syndrome | 62 (6) | 81 (16) | 87 (6) | 48 (4) |
| Ventilator-associated pneumonia | 101 (11) | 6 (1) | 27 (2) | 32 (3) |
| Sepsis | 130 (12) | 50 (10) | 258 (16) | 168 (16) |
| Outcomes | ||||
| Duration of mechanical ventilation, median (P25,P75), days | 5 (3.9) | 7 (4.12) | 5 (4.11) | 5 (2.10) |
| ICU stay, median (P25,P75), days | 9 (5.16) | 9 (5.17) | 8 (4.16) | 8 (4.15) |
| Hospital stayb, median (P25,P75), days | 21 (12.36) | 20 (11.38) | 20 (11.38) | 19 (9.34) |
| ICU mortality, n (%) | 362 (33) | 170 (34) | 420 (27) | 306 (27) |
| Hospital mortalityb, n (%) | 443 (42) | 199 (40) | 530 (35) | 386 (35) |
| Standardized mortality ratio (95%CI)c | 1.17(0.81–1.52) | 1.17(0.80–1.53) | 0.88(0.59–1.18) | 0.86(0.58–1.15) |
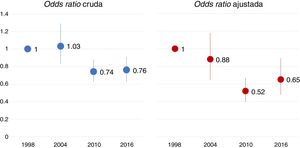
Mortality in the ICU experienced a significant change between 2004 and 2010, with a similar percentage being recorded in 2016. Table S4 of the Supplementary material shows the descriptive analysis of mortality in each study. Fig. 4 displays the raw and adjusted mortality probability rates over time, taking as reference (odds ratio 1) the study of 1998. The multilevel logistic regression model showed no geographical variability in ICU mortality (MOR 1.43; p = 0.258).
Odds ratio of mortality in the ICU over time, taking the first study as reference. The adjusted model included the following variables: year-study, age, gender, SAPS II score, reason for mechanical ventilation, variables related to evolution during mechanical ventilation (complications such as ARDS, sepsis, pneumonia and organ dysfunction), variables related to ventilatory support (use of noninvasive ventilation, protective ventilation strategy) and variables related to treatment (sedation, neuromuscular block).
We also recorded a significant decrease over time in the standardized mortality rate, though it remained stable from 2010 onwards (Table 4).
The studies of 2010 and 2016 recorded limitation of life support instructions. In 2010, a total of 15% of the patients had such instructions, and their in-hospital mortality rate was 89%. In 2016, the percentage increased to 19% of the patients, with an in-hospital mortality rate of 90%.
DiscussionThe main finding of our study is that the mortality rate among patients requiring MV in Spanish ICUs has decreased over the last 18 years, though the figure has remained stable at 27% since the year 2010 - albeit with a slightly higher severity index in 2016 (47 points, predicted mortality rate of 39%) than in 2010 (46 points, predicted mortality rate of 37%). These changes in mortality have been associated to changes in clinical practice, with the generalized adoption (though with differences depending on the geographical setting) of protective ventilation strategies, reducing tidal volume to allow airway pressure to be kept below the level considered to be damaging to the lungs.36
The mortality observed in this study corresponds to the lower mortality range reported in both studies including patients from different countries9,37 and in national studies.38–45 In the course of the 18-year period between the first and the last study, we recorded a progressive decrease in mortality, though the figures remained similar in the last two studies. Furthermore, this decrease has occurred despite a change in the case-mix of the ventilated patients, characterized by an increase in the latest studies of patients with neurological disease, whose mortality rate is higher than in patients with other disease conditions such as heart failure or COPD – the presence of which has gradually decreased in the Units that have participated in our studies. A relevant finding is the fact that no geographical variability of mortality in the ICU was observed.
The investigation of MV in the last two decades evidences changes in routine clinical practice,31–33 though there is still significant heterogeneity in its implementation.46 One of the changes would be an increased utilization of noninvasive ventilation as the first ventilatory support measure. Few studies have evaluated this evolution over time. A French study reported an increase from 16% in 1997 to 24% in 2011.18 In Spain we have also observed an increase in the use of noninvasive mechanical ventilation as first ventilatory support mode, with a percentage use similar to that reported in other countries47 – though in our case significant variability is seen among the different regional societies of the SEMICYUC.
Technological advances in the field of MV have caused ventilators to evolve from simple machines offering few options to microprocessor-based systems allowing a broad range of ventilation modes. At present there are almost 200 ventilatory mode denominations, though many of them are similar in terms of their operating characteristics.48 While to date no studies have demonstrated the superiority of one mode over the rest,49 the preferred mode – as in other studies39,42,44 – remains the volume assist-control strategy, though its use has gradually decreased in favor of partial support modes such as pressure support, or dual modes such as volume control ventilation with pressure regulation. Mention must be made of the gradual decrease in the use of synchronized intermittent mandatory ventilation (SIMV), with or without pressure support, to the point where it has now become a marginal mode.50 On the other hand, as in other countries,51 little use is made of more complex modes (proportional assist ventilation [PAV], neurally adjusted ventilatory assist [NAVA]) – possibly because these proportional modes are protected by manufacturing patent rights and are not available in all commercially available mechanical ventilators.
Probably the greatest change produced as a result of clinical research is the so-called lung protective ventilation strategy, characterized by ventilation with low tidal volume settings (<6 ml/kg ideal body weight) and high PEEP, with the aim of maintaining a plateau pressure <30 cmH2O.36 This strategy, initially indicated for patients with ARDS,19,20 has been extended to the general population of patients subjected to MV.27 It gradually has been incorporated to routine clinical practice. Observational studies have recorded a progressive decrease from 8 and 10 ml/kg reported in the studies published in the closing years of the last century3,5,29 to tidal volumes <8 ml/kg but >6 ml/kg, maintaining a plateau pressure at the safety limits in the most recent studies.38–40,42–45 We observed a similar trend in our case. There has been a gradual decrease in tidal volume, though settings of <6 ml/kg are not reached probably because the current volumes secure the target plateau pressure < 30 cmH2O and/or driving pressure <15 cmH2O.52 Fewer changes are seen in PEEP level. In the implementation of this strategy we have also recorded differences between the different geographical regions.
The changes observed in the ventilation strategies (increased use of noninvasive ventilation and progressive implementation of protective ventilation) may have influenced the observed changes in patient mortality. A meta-analysis including individual data from patients participating in 9 randomized clinical trials has reported that a decrease in daily water balance, plateau pressure and tidal volume, and an increase in PEEP, reduced the mortality rate among patients with ARDS over a period of 17 years.53 In a mediation analysis of the global patients included in the four international studies to which our own cohort belongs, we observed a moderate effect (< 25%) upon mortality on the part of the protective ventilation strategy in the subgroup of patients with PaO2/FiO2between 100–200.33
Our study has a number of limitations that may influence interpretation of the results. Although a significant number of ICUs participated in the study, they do not represent all such Units in Spain. Thus, although we do consider the participating Units to be highly representative, there may have been selection bias causing limitations in the drawing of conclusions. However, the changes observed in the 14 Units that participated in all four studies were similar.
In conclusion, over the last two decades there has been a significant decrease in mortality among ventilated patients in Spanish ICUs. These changes in turn may have been influenced by the increased use of ventilatory strategies designed to minimize ventilator-induced lung damage.
AuthorshipOscar Peñuelas, Fernando Frutos-Vivar and Andrés Esteban, as coordinators of the four studies, had access to all the data of the studies and accept responsibility for their reliability.
Study design: Andrés Esteban, Fernando Frutos-Vivar, Oscar Peñuelas, Antonio Anzueto.
Data compilation (investigators in 3 or 4 studies): Antonio García-Jiménez, Raúl de Pablo, Manuel Valledor, Miquel Ferrer, Miguel León, José María Quiroga, Susana Temprano, Inmaculada Vallverdú, Rafael Fernández, Federico Gordo.
Statistical analysis: Alfonso Muriel, Oscar Peñuelas, Fernando Frutos-Vivar.
Data interpretation: Alfonso Muriel, Oscar Peñuelas, Fernando Frutos-Vivar.
Drafting of the manuscript: Fernando Frutos-Vivar.
Critical review of the manuscript: Oscar Peñuelas, Fernando Frutos-Vivar, Alfonso Muriel, Jordi Mancebo, Antonio García-Jiménez, Raúl de Pablo, Manuel Valledor, Miquel Ferrer, Miguel León, José María Quiroga, Susana Temprano, Inmaculada Vallverdú, Rafael Fernández, Federico Gordo, Antonio Anzueto, Andrés Esteban.
Final approval of the manuscript: Oscar Peñuelas, Fernando Frutos-Vivar, Alfonso Muriel, Jordi Mancebo, Antonio García-Jiménez, Raúl de Pablo, Manuel Valledor, Miquel Ferrer, Miguel León, José María Quiroga, Susana Temprano, Inmaculada Vallverdú, Rafael Fernández, Federico Gordo, Antonio Anzueto, Andrés Esteban.
Conflicts of interestThe authors declare that they have no conflicts of interest.
Thanks are due to all the investigators indicated in Annex 1.
Please cite this article as: Peñuelas O, Frutos-Vivar F, Muriel A, Mancebo J, García-Jiménez A, de Pablo R, et al. Ventilación mecánica en Espa˜na, 1998-2016: epidemiología y desenlaces. Med Intensiva. 2021;45:3–13.


