


1) To evaluate the ability of baseline and on 24 h serum calprotectin, in comparison to canonical biomarkers (lactate and procalcitonin), for prognosis of 28-day mortality in critically ill septic patients; and 2) To develop a predictive model combining the three biomarkers.
DesignA single-center, retrospective study.
SettingIntensive Care Unit of a university hospital.
Patients or participantsOne hundred and seventy three septic pacientes were included.
InterventionsMeasurement of baseline lactate, procalcitonin and calprotectin level and procalcitonin and calprotectin levels on 24 h.
Main variables of interestDemographics and comorbidities, SOFA score on ICU admission, baseline lactate, procalcitonin and calprotectin on admission and on 24 h and 28-day mortality.
Results1) On ICU admission, lactate was the only biomarker achieving a significant accuracy (AUC: 0.698); 2) On 24 h, no differences were found on procalcitonin and calprotectin levels. Procalcitonin and calprotectin clearances were significantly lower in non-survivors and both achieved a moderate performance (AUCs: 0.668 and 0.664, respectively); 3) A biomarker based-model achieved a significant accuracy (AUC: 0.766), trending to increase (AUC: 0.829) to SOFA score alone; y 4) Baseline lactate levels and procalcitonin and calprotectin clearance were independent predictors for the outcome.
Conclusions1) Baseline and on 24 h calprotectina and procalcitonin levels lacked ability in predicting 28-day mortality; 2) Accuracy of clearance of both biomarkers was moderate; and 3) Combination of SOFA score and the predictive biomarker based-model showed a high prognostic accuracy.
1) Valorar en pacientes críticos sépticos la capacidad de la medida basal y a las 24 horas de calprotectina sérica, en comparación con marcadores convencionales (lactato y procalcitonina), para predecir mortalidad a los 28 días; y 2) Generar un modelo predictivo basado en la combinación de biomarcadores.
DiseñoEstudio unicéntrico, retrospectivo.
ÁmbitoUnidad de Cuidados Intensivos de un hospital universitario.
Pacientes o participantes173 pacientes sépticos.
IntervencionesMedida de las concentraciones basales de lactato, procalcitonina y calprotectina y de procalcitonina y calprotectina a las 24 horas.
Variables de interés principalesDatos demográficos y comorbilidades, escala SOFA al ingreso, lactato al ingreso, y procalcitonina y calprotectina basal y a las 24 horas y mortalidad a los 28 días.
Resultados1) Al ingreso, el lactato fue el único biomarcador con un rendimiento predictivo significativo (AUC: 0,698); 2) A las 24 horas no se observaron diferencias en las concentraciones de procalcitonina y calprotectina sérica, pero sí en el aclaramiento de ambos biomarcadores, que mostraron un rendimiento moderado (AUCs: 0,668 y 0,664); 3) Un modelo combinando biomarcadores bioquímicos alcanzó un rendimiento significativo (AUC: 0,766), con tendencia a incrementar (AUC: 0,829) el de la escala SOFA aislada; y 4) Las concentraciones de lactato basal y el aclaramiento de procalcitonina y calprotectina fueron predictores independientes del evento.
Conclusiones1) Calprotectina y procalcitonina basal y a las 24 horas carecen de valor para predecir mortalidad a los 28 días; 2) El rendimiento del aclaramiento de ambos fue moderado; y 3) La combinación de la escala SOFA y un modelo combinando los biomarcadores sanguíneos mostró un rendimiento pronóstico alto.
Sepsis is a life-threatening condition caused by a dysregulated host response to infection resulting in multiple organ dysfunction.1 Despite significant improvements in care, existing epidemiologic studies suggest that sepsis remains a huge burden across all regions, with a high incidence and mortality.2 Therefore, an early diagnosis and identification of high-risk sepsis patients is key, increasing the possibility of initiating early and specific treatments. Severity scoring systems, such as Acute Physiology and Chronic Health Evaluation (APACHE) and Simplified Acute Physiology Score (SAPS) for mortality, or Sequential Organ Failure Assessment (SOFA) to assess and characterize the degree of organ dysfunction, are commonly used in critical care to inform about mortality prediction and risk stratification and optimization of patient outcomes. However, their use to guide decision-making and their applicability in the real-life clinical practice have been questioned.3 An easy-measurable tool for the early identification of high-risk patients, as circulating biochemical markers, would be key in aiding clinical decision-making and optimizing the use of health care resources. Biomarkers such as procalcitonin have been reported as useful tools for diagnosis of bacterial infection in critically ill patients,4 but its prognostic value is controversial.5 Therefore, an accurate and early evaluation of the prognosis of sepsis is still lacking and the research on new biomarkers is a priority for sepsis.6 Besides, in view of the complexity of the sepsis pathophysiology, a combination of several biomarkers may be a more effective strategy for diagnosis and prognosis, but this requires further evaluation.7
Calprotectin, as part of the innate immune system, has emerged as a promising sepsis biomarker. It is a heterodimeric protein belonging to the family of calcium-binding S100 leucocyte proteins and composed by two calcium binding proteins: S100A8 and S100A9, also called myeloid-related proteins (MRP) 8 and MRP-14. Calprotectin is an abundant cytosolic protein that is constitutively expressed in neutrophils and other immune cells, such as monocytes and activated macrophages.8,9 During inflammation and mediated through neutrophil activation, it is released actively and exerts a critical role in regulating the inflammatory response by modulating leukocyte recruitment and inducing cytokine secretion.9,10 In critically ill patients, calprotectin has been reported as a helpful biomarker for early diagnosis of sepsis,11 but its prognostic value has been scarcely evaluated and results are controversial.12–14 A recent health economic analysis on the predictive use of blood calprotectin concludes that this biomarker helps clinical decision making in sepsis and indicates that it has a cost-saving and life-saving impact on the healthcare system.15
In this study, we aimed: 1) to evaluate the ability for prognosis of baseline, on 24 h and clearance of serum calprotectin for prognosis of 28-day mortality, in comparison to conventional biomarkers, and 2) to develop a predictive model, based on laboratory tests (lactate, procalcitonin and calprotectin) measured in blood samples collected in the first 24 h of Intensive Care Unit (ICU) stay, for predicting 28-day mortality in patients with sepsis. We hypothesized that a combination of these biomarkers would be better than any single biomarker for this purpose and we tested whether the addition to SOFA score could improve the prediction of mortality in these patients.
Patients and methodsStudy design and populationWe conducted a single-center, retrospective study enrolling consecutive adult (≥ 18 years) patients admitted to the ICU of Santa Lucía University Hospital (Cartagena, Spain) from January 2015 to November 2016 and fulfilling criteria for severe sepsis or septic shock, according to Sepsis-2 definition. For definitive inclusion in the study, only those patients with SOFA ≥ 2 and therefore met criteria for the new Sepsis-3 definition for sepsis were included. Other exclusion criteria were (a) age < 18 years; (b) patients developing sepsis while on ICU but admitted to the ICU for other reasons; (c) lack of blood sample for the measurement of biomarkers; (d) pregnancy; (e) limitation of therapeutic effort; (f) lack of informed consent; and (g) patients transferred from or to other ICUs.
The study protocol was approved by the local Ethics Committee of our hospital (E.O.2013-28 Enm.3 BIOMARCADORES) and was performed in accordance with the Declaration of Helsinki ethical guidelines.
Data collectionFor eligible patients, demographic, comorbidities, laboratory and microbiological tests and outcome data were extracted from electronic medical records and laboratory information systems. A database was prepared for register of collected data and all patient identities were coded for blindness.
Outcome measuresAll patients were followed-up to 28 days for the outcome of all-cause mortality.
Blood sampling and biomarker testingIn all patients, baseline blood samples were collected on admission to ICU and a second sample was drawn at 24 h of ICU stay. Blood samples were centrifuged at 3000×g for 5 min to obtain serum and analysed for procalcitonin and reported to clinicians within 1 h from collection. Leftover serum for calprotectin was immediately frozen and stored to −80 °C until testing.
Baseline blood lactate levels were measured on ICU by amperometry on an ABL 90 FLEX point-of-care testing analyzer (Radiometer Medical ApS, Brønshøj, Denmark), with a limit of detection of 0.1 mmol/L. Procalcitonin levels were measured by a chemiluminiscent enzyme immunoassay on G600II analyzer (Fujirebio Diagnostics Inc. Japan) and a electrochemiluminescence immunoassay on Cobas e601 and Cobas e401 analyzers (Roche Diagnostics, Switzerland), both with a limit of detection of 0.02 ng/mL and a functional sensitivity of 0.06 ng/mL. Serum calprotectin levels were measured by a particle enhanced turbidimetric immunoassay (PETIA) (Gentian AS, Norway) using a Cobas c702 instrument (Roche Diagnostics, Switzerland). According to manufacturer´s data, limit of quantification is 0.30 mg/L.
Procalcitonin and calprotectin clearance was defined by using the following formula: Clearance24 h = 100 × (Biomarker levelICU admission − Biomarker level24 h)/Biomarker levelICU admission
A positive value denotes a decrease or clearance of biomarker levels, whereas a negative value denotes an increase in the biomarker after 24 h.
Statistical analysisThe normality of continuous variables was tested by Kolmogorov-Smirnov or Shapiro-Wilk and they are reported as median (interquartile range [IQR]) or mean (standard deviation [SD]), as appropriate. Categorical variables are presented as frequency and percentage in each category. Mann–Whitney U and chi-squared or Fisher exact tests, as appropriate, were used to compare continuous and categorical data between groups, respectively.
To evaluate the ability for predicting 28-day mortality of SOFA score, calprotectin and the other tested biomarkers we estimated the area under the curve (AUC) of the receiver operating characteristic (ROC) curves and optimal cut-offs were defined as the value maximizing the Youden index.
In addition, a logistic regression equation was constructed to predict the probability of 28-day mortality. For this, all biomarkers with a univariate significance of p-value < 0.15 as covariates and 28-day all-cause mortality as the dependent variable were included in the multivariate analysis, after testing for collinearity using the variance inflation factor (VIF), using a mixed and forward-backward stepwise variable selection procedure (p-value < 0.05 and p-value > 0.10 respectively). The logistic regression equation for predicting a logit transformation of the probability of 28-day mortality was created using the coefficients generated for each biomarker in the final step of the regression model. Discriminative ability and calibration of the model generated were assessed by the ROC AUC and Hosmer-Lemeshow test, respectively. ROC AUC for combinations of SOFA score and biomarkers or the novel model from regression analysis was calculated by logistic regression analysis. The Delong method was used for comparison of significant ROC AUCs.
We performed analyses using the software packages SPSS 21.0 (SPSS Inc., IL, USA) and MedCalc 15.0 (MedCalc Software, Ostend, Belgium). In all tests, a two-sided p value of < 0.05 was considered significant.
ResultsBaseline characteristics and laboratory findingsDuring study period, 202 patients with sepsis, according to Sepsis-2 definition, were admitted to ICU. According to exclusion criteria, 29 patients were excluded (Fig. 1). Finally, 173 patients (median age: 67 years [interquartile range: 55−76; (IQR); 109 (63%) male) were included in the study. According to Sepsis-3 definition, 101 patients were diagnosed as sepsis (58.4%) and 72 (41.6%) as septic shock on ICU admission. The most common source of infection was abdominal (42.8%) and infection was microbiologically documented in 132 patients (75.7%). In these cases, Gram-negative bacteria were the main causative agent for infection (n = 69 [39.9%]), followed by polybacterial infection (n = 32 [18.5%]) and Gram-positive bacteria (n = 24 [13.9%]). Blood culture was requested in 145 (83.8%) patients and bacteremia was detected in 68 (39.3%) patients, being Escherichia coli the most frequent isolate (n = 22). The 28-day mortality rate was 15%. Patients’ characteristics according to survival status are presented in Table 1.

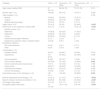
Characteristics of patients according to 28-day mortality.
| Variables | Totaln = 173 | Survivorsn = 147 (85%) | Non-survivorsn = 26 (15%) | p |
|---|---|---|---|---|
| Age in years; median (IQR) | 67 (55−76) | 66 (54−75) | 72 (70−78) | 0.101 |
| Gender, male; n (%) | 109 (63) | 90 (61.2) | 19 (73.1) | 0.249 |
| Type of patient; n (%) | 0.798 | |||
| Medical | 109 (63) | 93 (63.3) | 16 (61.5) | |
| Surgical | 39 (22.5) | 32 (21.8) | 7 (26.9) | |
| Medical requiring surgery | 25 (14.5) | 22 (15) | 3 (11.5) | |
| Septic shock; n (%) | 72 (41.6) | 50 (34) | 22 (84.6) | <0.001 |
| SOFA score on ICU admission; median (IQR) | 8 (5−10) | 7 (5−9) | 10 (8−14) | <0.001 |
| Infection source; n (%) | 0.612 | |||
| Abdominal | 74 (42.8) | 63 (42.9) | 11 (42.3) | |
| Respiratory | 36 (20.8) | 28 (19.0) | 8 (30.8) | |
| Urinary | 36 (20.8) | 33 (22.4) | 3 (11.5) | |
| Central nervous system infections | 3 (1.7) | 3 (2.0) | 0 | |
| Bacteremia of unknown origin or catheter-related bloodstream infections | 10 (5.8) | 9 (6.1) | 1 (3.8) | |
| Skin and soft tissues | 8 (4.6) | 6 (4.1) | 2 (7.7) | |
| Other | 6 (3.4) | 5 (3.4) | 1 (3.8) | |
| Comorbidities; n (%) | ||||
| Diabetes mellitus | 64 (37) | 56 (38.1) | 8 (30.8) | 0.476 |
| Hypertension | 107 (61.8) | 87 (59.2) | 20 (76.9) | 0.086 |
| Inmunosupresión | 36 (28) | 29 (19.7) | 7 (26.9) | 0.405 |
| Chronic kidney disease | 29 (16.8) | 19 (12.9) | 10 (38.5) | 0.003 |
| Chronic obstructive pulmonary disease | 19 (11) | 16 (10.9) | 3 (11.5) | 1.000 |
| Active cancer | 48 (27.7) | 38 (25.9) | 10 (38.5) | 0.186 |
| Cardiovascular disease | 52 (30.1) | 40 (27.2) | 12 (46.2) | 0.052 |
| Chronic liver disease | 10 (5.8) | 7 (4.8) | 3 (11.5) | 0.175 |
| Acute kidney injury on ICU admission; n (%) | 123 (71.1) | 100 (68) | 23 (88.5) | 0.034 |
| Need for replacement renal therapy; n (%) | 37 (21.4) | 21 (14.3) | 16 (61.5) | <0.001 |
| Need for invasive mechanical ventilation; n (%) | 84 (48.6) | 60 (40.8) | 24 (92.3) | <0.001 |
| ICU lenght of stay (days) | 5 (3−10) | 5 (3−11) | 5 (2−10) | 0.834 |
| In-hospital lenght of stay (días) | 10 (15−32) | 18 (11−37) | 9 (5−16) | <0.001 |
| Laboratory findings | ||||
|---|---|---|---|---|
| On ICU admission | ||||
| Procalcitonin (ng/mL) | 14.2 (4.7−38.1) | 13.5 (4.4−38.1) | 15.6 (6.7−27.6) | 0.731 |
| Calprotectin (mg/L) | 6.6 (4.0−10.1) | 6.5 (4.1−10.6) | 7.0 (3.1−10.1) | 0.768 |
| Lactate (mmol/L) | 2.3 (1.4−3.6) | 2.2 (1.3−2.5) | 3.0 (2.3−6.2) | 0.001 |
| On 24 h | ||||
| Procalcitonin (ng/mL) | 11.8 (4.3−33.1) | 10.5 (4.2−31.4) | 25.4 (6.2−57.5) | 0.050 |
| Calprotectin (mg/L) | 6.6 (3.5−12.9) | 6.1 (3.4−11.5) | 11.5 (4.4−14.9) | 0.167 |
| Clearance biomarkers | ||||
| Procalcitonin (%) | 25.1 (−16.8 to 43.9) | 29.5 (−5.1 to 44.5) | −12.9 (−101.5 to 37.3) | 0.006 |
| Calprotectin (%) | 0 (−35.6 to 25.3) | 1.8 (−29.2 to 26.6) | −27.8 (−50.6 to 15.4) | 0.019 |
ICU: Intensive Care Unit; IQR: Interquartile range; SOFA: Sequential Organ Failure Assessment.
In the comparison among non-survivors and survivors, SOFA score was higher in the non-survivors (Table 1). Concerning laboratory findings, on ICU admission only lactate levels were significantly higher in non-survivors and differences were not found for procalcitonin and calprotectin levels. On blood samples collected on 24 h, differences between groups were not detected for both biomarkers. However, procalcitonin and calprotectin clearances were significantly lower in non-survivor patients (Table 1).
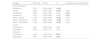
Prognostic value of SOFA score and biomarkers for 28-day mortalityThe predictive ability of SOFA score and circulating biomarkers and their optimal cutoffs for predicting 28-day mortality were computed (Tables 2 and 3and Fig. 2a–c). On ICU admission, only SOFA score (ROC AUC: 0.736) and lactate levels (ROC AUC: 0.698) achieved a significant accuracy, withouth difference between both (p = 0.495). Serum calprotectin and procalcitonin levels measured on admission and on 24 h did not achieve a significant accuracy for the outcome. The accuracy of SOFA score on ICU admission to predict 28-day mortality did not improve in combination with the biomarkers evaluated in this study (Table 2). The discriminative ability for procalcitonin and calprotectin clearance was statistically significant, achieving ROC AUC of 0.668 and 0.644, respectively, withouth a significant difference between both (p = 0.739).
ROC curves of biomarker levels to predict 28-day mortality.
| Variable | ROC AUC | 95% CI | p | p (comparison vs. SOFA score) |
|---|---|---|---|---|
| On ICU admission | ||||
| SOFA score | 0.736 | 0.664−0.800 | <0.001 | – |
| Lactate | 0.698 | 0.623−0.765 | <0.001 | 0.495 |
| Procalcitonin | 0.521 | 0.444−0.598 | 0.727 | 0.007 |
| Calprotectin | 0.518 | 0.441−0.595 | 0.789 | 0.018 |
| SOFA + Lactate | 0.750 | 0.678−0.812 | <0.001 | 0.217 |
| SOFA + Procalcitonin | 0.734 | 0.662−0.798 | <0.001 | 0.773 |
| SOFA + Calprotectin | 0.736 | 0.664−0.800 | <0.001 | 0.981 |
| On 24 h | ||||
| Procalcitonin | 0.621 | 0.498−0.743 | 0.054 | |
| Calprotectin | 0.585 | 0.455−0.715 | 0.199 | |
| Clearance | ||||
| Procalcitonin | 0.668 | 0.545−0.790 | 0.007 | |
| Calprotectin | 0.644 | 0.527−0.760 | 0.016 | |
SOFA: Sequential Organ Failure Assessment; ROC AUC: Receiver Operating Characteristic Area Under Curve; CI: Confidence interval.
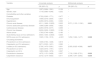
Optimal cutoffs for biomarkers with a significant accuracy for 28-day mortality.
| Cutoff | S (%) 95% CI | Sp (%) 95% CI | PPV (%) 95% CI | NPV (%) 95% CI | |
|---|---|---|---|---|---|
| SOFA score (ICU admission) | ≥8 | 80.8 (60.6−93.4) | 53.7 (45.3−62.0) | 23.6 (15.2−33.8) | 94.0 (86.7−98.0) |
| Lactate (mmol/L) (ICU admission) | ≥2.3 | 84 (65.1−95.6) | 52.4 (44.0−60.7) | 23.9 (15.6−33.9) | 95.1 (87.8−98.6) |
| Procalcitonin clearance (%) | ≤11.3 | 65.4 (44.3−82.8) | 71.4 (63.4−78.6) | 28.8 (17.8−42.1) | 92.1(85.5−96.3) |
| Calprotectin clearance (%) | ≤−20.7 | 61.5 (40.6−79.8) | 68.0 (59.8−75.5) | 25.4 (15.3−37.9) | 90.9 (83.9−95.6) |
SOFA: Sequential Organ Failure Assessment; S: Sensitivity; Sp: Specificity; PPV: Positive predictive value; NPV: Negative predictive value; CI: Confidence Interval.

a. Receiver operating characteristic curves of SOFA score and circulating biomarker levels on admission; b. Receiver operating characteristic curves of biomarker levels on 24 h; c. Receiver operating characteristic curves of biomarker clearances; d. Receiver operating characteristic curves of SOFA and SEPCART scores to predict 28-day mortality.
From multivariate analysis, SOFA score and lactate on ICU admission, chronic kidney injury, procalcitonin clearance and calprotectin clearance in the first 24 h were independent predictors of 28-day mortality (Table 4).
Univariate and multivariate regression analysis for 28-day mortality.
| Variable | Univariate analysis | Multivariate analysis | ||
|---|---|---|---|---|
| OR (95% CI) | p | OR (95% CI) | p | |
| Age | 1.027 (0.994−1.061) | 0.109 | – | |
| Gender, male | 1.719 (0.680−4.348) | 0.252 | – | |
| Comorbidities and other variables | ||||
| Diabetes | 0.722 (0.295−1.771) | 0.477 | – | |
| Inmunosupresión | 1.499 (0.576−3.904) | 0.407 | – | |
| Hypertension | 2.299 (0.872−6.063) | 0.093 | – | |
| Chronic renal disease | 4.211 (1.669−10.623) | 0.002 | 3.571 (1.123−11.361) | 0.031 |
| Chronic obstructive pulmonary disease | 1.068 (0.288−3.959) | 0.922 | – | |
| Cardiovascular disease | 2.293 (0.978−5.377) | 0.056 | – | |
| Chronic liver disease | 2.609 (0.629−10.820) | 0.186 | – | |
| Active cancer | 1.793 (0.749−4.288) | 0.190 | – | |
| Acute kidney injury (on ICU admission) | 3.603 (1.030−12.603) | 0.045 | – | |
| SOFA score (on ICU admission) | 1.325 (1.159−1.515) | <0.001 | 1.252 (1.062−1.477) | 0.008 |
| Circulating biomarkers | ||||
| Procalcitonin (on ICU admission) | 1.036 (0.763−1.408) | 0.819 | – | |
| Calprotectin (on ICU admission) | 0.871 (0.530−1.431) | 0.585 | – | |
| Lactate (on ICU admission) | 2.736 (1.470−5.091) | 0.001 | 2.055 (0.925−4.568) | 0.077 |
| Procalcitonin (on 24 h) | 1.320 (0.973−1.791) | 0.074 | – | |
| Calprotectin (on 24 h) | 1.280 (0.828−1.979) | 0.267 | – | |
| Procalcitonin clearance | 1.672 (1.151−2.428) | 0.007 | 1.716 (1.090−2.701) | 0.020 |
| Calprotectin clearance | 2.372 (1.214−4.633) | 0.011 | 2.006 (1.047−3.843) | 0.036 |
A multivariate logistic regression model using circulating biomarker levels was constructed to predict the 28-day mortality. Combining these three biomarkers (SEPCART score), through a regression equation, the log of probability was converted to the probability of 28-day mortality as follows:
As to goodness of fit, the following pseudo-R2 indices were obtained: McFadden’s R2: 0.151, Cox-Snell R2: 0.120 and Nagelkerke R2: 0.210. The absence of multicolinearity between predictors was confirmed for all variables (mean VIF = 1.03). The Hosmer–Lemeshow chi-square value was 8.18 (p = 0.416), indicating that the model had a good calibration.
In the ROC curve analysis, SEPCART and SOFA scores achieved a similar AUC in predicting 28-day mortality, without a statistically significant difference between both (0.766 (95% CI: 0.677−0.856) vs. 0.736 (95% CI: 0.635−0.838); p = 0.650) (Fig. 2d). The optimal cutoff value for the probability of 28-day mortality was 0.151, with a sensitivity, specificity, negative predictive value and positive predictive value of 69.2% (95% CI: 48.2–85.7 %), 71.4% (95%CI: 63.4−78.6%), 92.9% (95% CI: 86.5−96.9%) and 30.5% (95% CI: 18.8-43.2%), respectively. The addition of SEPCART score to SOFA score result in a better performance (0.829; 95% CI: 0.765−0.882; p < 0.001), with a trend to statistical significance when both ROC curves were compared (p = 0.055).
DiscusionSepsis is still a major challenge in critical care. Because it is a time-sensitive condition, its early diagnosis for initiation of antimicrobial therapy, the source control and a close monitoring remain as the cornerstones to decrease the morbidity and mortality related to sepsis.16 However, the early risk stratification of septic patients still remains an unsolved issue and novel strategies are required.6 In this sense, canonical blood biochemical markers are useful to help monitor patient response to treatment and guide therapeutic decisions in individual patients,17 but their ability for risk stratification is controversial.18 In this sense, novel emergent biomarkers, such as MR-proADM, have been reported as helpful tools to predict the prognosis of critically ill patients with sepsis.19 Besides, due to the complex nature of sepsis,20 in which the host response involves the interplay between different mechanisms, models combining different biochemical markers represent a new and interesting strategy to overcome the limited prognostic performance of single parameters.21,22
This single-center study demonstrated that: 1) procalcitonin and calprotectin levels, measured on ICU admission and on 24 h, did not predict the prognosis of critically ill patients with sepsis; 2) for both biomarkers, clearance on first 24 h achieved a moderate accuracy for predicting 28-day mortality; and 3) a model combining the levels and clearance of two canonical biomarkers widely used for the management of septic patients, lactate and procalcitonin, and an emergent sepsis marker, calprotectin, was valuable for predicting 28-day mortality in ICU patients with sepsis. Although this novel model increased numerically, but without a significant difference, the performance of SOFA score alone, it trended to improve the prognostic value of SOFA score.
Lactate is a well-known indicator of sepsis severity and a marker of resuscitation23 and its levels are known to be associated with 28-day mortality in patients with sepsis.24 Concerning other conventional biomarkers, a recent review showed that unique baseline and isolated measurement of procalcitonin and CRP are not useful for determining the mortality prognosis among critically ill sepsis patients.18 A potential strategy to improve this prognostic value is by using serial measurements because their time courses may be more reliable than their absolute levels, but time for collection of blood samples and the optimal clearance cutoff for accurate risk assessment has not been clearly defined.25 Finally, calprotectin, as signature of neutrophil activation, has recently emerged as sepsis biomarker. In critically ill patients, higher serum calprotectin levels have been reported in patients with sepsis12,26 and it is a helpful marker for early diagnosis of sepsis in these patients.11 However, its potential as prognostic biomarker is still controversial. In Emergency Department patients, the ROC AUC of calprotectin for predicting 28-day mortality in septic patients was 0.813.27 In critically ill patients, serum calprotectin concentrations predict short-term mortality with a moderate performance (ROC AUC: 0.64) but better than procalcitonin (ROC AUC: 0.56),12 and in the subgroup of septic patients high calprotectin concentrations on ICU admission predict long-term mortality risk.26 In patients with septic shock, plasma calprotectin levels were also significantly higher in non-survivors and this biomarker could indicate a higher risk of death and help the stratification for improved care and treatment selection.28 However, in Lee et al. study, no difference was reported for calprotectin levels in critically ill surgical patients according to survival.14 Besides, the potential role of serial measurement of calprotectin has not been evaluated yet.
In our study, only ICU admission lactate levels achieved a significant, but moderate, performance for predicting mortality (ROC AUC: 0.698). Baseline procalcitonin levels lacked prognostic value for mortality, finding previously reported by our group29 and recently by Ríos-Toro et al.30 Concerning procalcitonin clearance, although different studies have reported the prognostic usefulness of variations of procalcitonin levels measured on admission and on fifth day,30,31 on 72 h32 and on 48 h,33 these are too long periods to be used as a predicting time in sepsis, a condition in which prognostic and therapeutic tools must be reinforced earlier to improve the evolution of patients. In our study, procalcitonin clearance in the first 24 h achieved a weak, although statiscally significant, performance (ROC AUC: 0.668), although higher than that reported by Ríos-Toro et al. (ROC AUC: 0.51).30 Similar findings were found for calprotectin. No differences were observed in calprotectin levels on ICU admission, similarly to Lee et al.,14 and serial measurements on first 24 h achieved a poor performance to predict mortality (ROC AUC: 0.585).
Similarly to other previous studies, we tested the prognostic ability of combined biomarkers. A model generated from regression analysis combining 3 independent predictors of 28-day mortality (SEPCART score, including baseline lactate and procalcitonin and calprotectin clearance on first 24 h) achieved a significant performance (ROC AUC: 0.766), increasing this accuracy to 0.829 in combination with SOFA score. The performance of this approach was similar than those reported in previous studies combining procalcitonin, lactate, neutrophil-to-white blood cell ratio and IL-6 in Emergency Department patients (ROC AUC: 0.823)34 or pentraxin-3, procalcitonin, lactate and interleukin-6 (IL-6) in ICU patients (ROC AUC: 0.778).21 However, conversely to Song et al. study,21 our novel model combining blood-based biomarkers did not improve significantly the accuracy of SOFA alone, limiting a potential applicability in the real-life clinical practice.
There were some limitations to this study. First, an estimation of sample size was not previously calculated and the final size depended on available reagent provided by manufacturer for measurement of calprotectin levels. Second, serial lactate levels at prefixed timepoints to calculate blood lactate clearance were not available. The observation of a better prognosis with decreasing lactate levels in critically ill patients, including those with sepsis, is consistent throughout the literature,35–37 although the optimal or desired rate of lactate clearance is a contentious area.38 Some authors have hardly criticized the value of lactate clearance in sepsis.39 Recent studies have reported a low accuracy for lactate clearance at 24 h as predictor of mortality in critically ill patients, with a ROC AUC of 0.620,40 or no difference for predicting mortality was reported by Lestari et al. when baseline lactate and lactate clearance were compared.41 Third, the results for calprotectin are assay- and matrix-dependent and results could vary according to type of sample used.42,43 In our study, blood tubes for serum were centrifuged within 2 h after blood collection, immediately transferred to the secondary tube, as recommended by the manufacturer, and the samples were stored according to stability results previously reported.43
In conclusion, both serum calprotectin and procalcitonin, measured on ICU admission baseline and on 24 h, lacked the ability for prognosis of 28-day mortality and only their clearance achieved a significant but moderate accuracy. The combined biomarker approach using baseline lactate and serial measurements of procalcitonin and calprotectin showed good performance in predicting 28-day all-cause mortality among the critically ill patients diagnosed with sepsis as defined by Sepsis-3. Furthermore, the addition of this combination of biomarkers to SOFA score appears promising as tool for risk stratification in ICU septic patients, although more studies including populations with larger sample size are required to confirm this finding.
Author contributionsLGGR and LAB conceived and designed the study and supervised the conduct of the trial and data collection. LAB and APC measured calprotectin in serum samples. RJS and JMAG contributed to the enrollment of patients and clinical data collection. CRR provided statistical advice to analyze the data. LGGR drafted the article, and MDAO and PCZ contributed substantially to its revision. All authors have accepted responsibility for the entire content of this manuscript and approved its submission.
FundingThis work was supported by Gentian AS, Moss, Norway, providing reagents and other materials for measurement of calprotectin. Gentian AS did not participate in the study design, collection and analysis of data.
Disclosure statementThe authors report there are no competing interests to declare.

