
Skeletal muscle atrophy is commonly associated to critical illness. Muscle mass in critically ill patients can rapidly atrophy after Intensive Care Unit (ICU) admission due to prolonged bed rest, sedatives and neuromuscular blocking agents prescription and other clinical conditions such as hypermetabolism with increased protein catabolism.1,2 Furthermore, muscle mass atrophy is associated with adverse clinical outcomes.3 Therefore, the aim of this study was, first, to describe changes in skeletal muscle mass in critically ill patients with COVID-19 and, second, to identify predictors of muscle atrophy during ICU stay.
This was a prospective cohort of critically ill patients with ARDS due to COVID-19 that were admitted in the Intensive Care Unit. Only patients with computed tomography (CT) scans for diagnostical purposes, performed in the first 24–48h after admission and a second CT during ICU length of stay on mechanical ventilation were included. This study was reviewed and approved by the Institutional Review Board.
Nutritional assessment, within 24−48h of ICU admission, included measurements such as mid-arm circumference, calf circumference, abdominal circumference, and half arm span, using a tape with 0.1cm precision (SECA 201, Germany). Weight and height were estimated using validated equations,4 and BMI was calculated. Nutritional risk was assessed using a modified NUTRIC-Score, considering factors such as age, SOFA score, APACHE II score, comorbidities, pre-ICU hospital length of stay, and the first 24h of mechanical ventilation (MV). High nutritional risk was defined as a score ≥5.5 Prescribed drugs (e.g., midazolam, fentanyl, vecuronium, propofol) were also documented from medical records daily between CT scans.
Abdominal non-contrast CT scans were performed in a supine position using a 64-slice Siemens Healthineers scanner. A transverse CT-image at the level of the third lumbar vertebra (L3) was used for skeletal muscle area (SMA) assessment, and change between CT-assessments was calculated. DICOM files were analyzed with coreslicer.com software. Participants were categorized by time between scans (<10 days, 10–20 days, >20 days).
Orogastric tubes were routinely placed. Calories and protein were prescribed following ESPEN guidelines (25kcal/kg, 1.3g/kg, respectively).6 Adjusted body weight was used to calculate the energy requirement in patients with a BMI>30kg/m2. Daily recording of energy and protein provision was done. Total energy provided was calculated from non-nutritional calorie sources and enteral nutrition (EN) prescriptions. Cumulative protein (CPD) and energy (CED) deficits on the day of the second CT scan were also determined.
Quantitative variable distribution was evaluated using the Shapiro-Wilk test. Descriptive statistics included categorical variables (absolute and relative frequency) and quantitative variables (mean±SD or median with IQR). The total change and per day of the SMA were reported in cm2 and percentage (%) of change. Differences between genders were assessed with the Mann-Whitney U test. The daily and total CPD and CED of each group were analyzed comparing the SMA of the initial measurement vs the subsequent measurement using t-Student test for paired samples. Linear regression examined factors associated with SMA loss percentage. Analysis was conducted with Stata Intercooled (Version 14). Statistical significance was set at P<.05.
Fourteen critically ill patients were included in this analysis (50% females). Severity of disease score was 10±3 using SOFA and 18±6 for APACHE II. The nutritional risk was 4±1 using NUTRIC-Score; only 4 (28.6%) patients were detected with high nutritional risk.
No significant differences in muscle mass loss percentage were found between patients with low versus high nutritional risk (18.1 [10.7–24.5] vs 12.9 [12–15.6], P=.671). The total CED and CPD to the day of second CT were 6141 (3850–9584) kcals and 313 (219–516) g, respectively (Table 1).
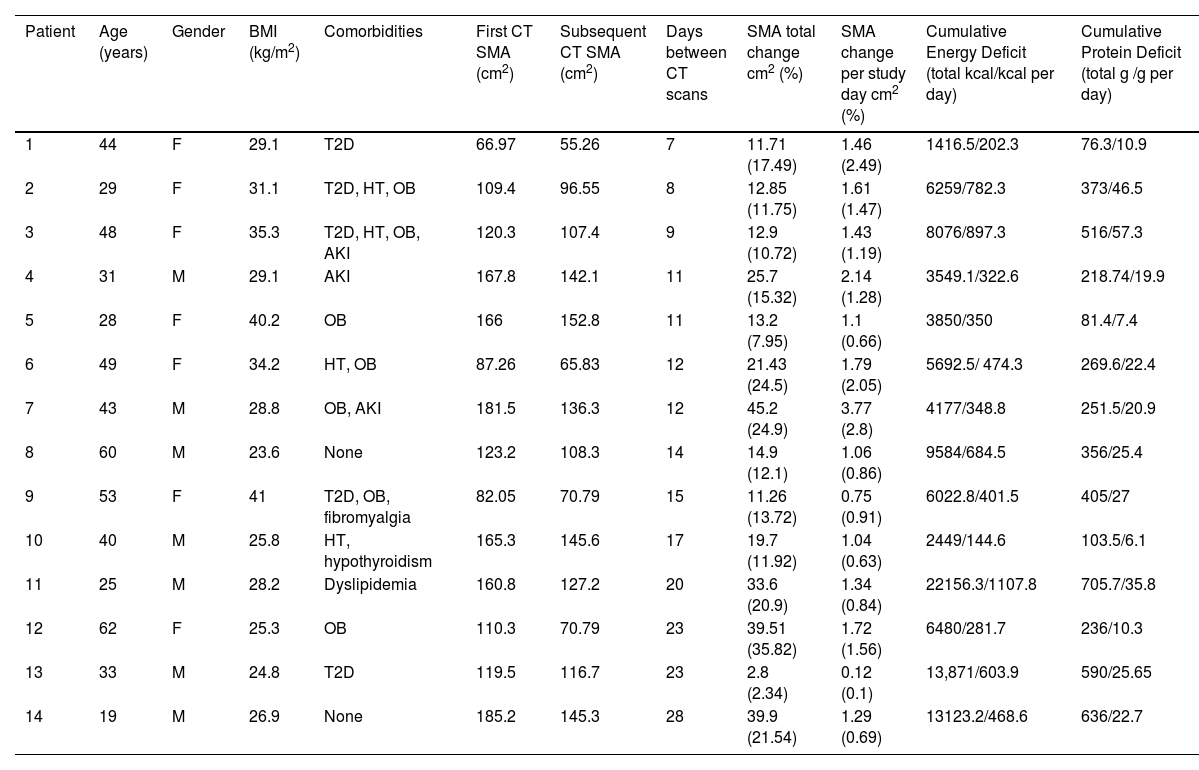
Clinical characteristics of critically ill patients.
| Patient | Age (years) | Gender | BMI (kg/m2) | Comorbidities | First CT SMA (cm2) | Subsequent CT SMA (cm2) | Days between CT scans | SMA total change cm2 (%) | SMA change per study day cm2 (%) | Cumulative Energy Deficit (total kcal/kcal per day) | Cumulative Protein Deficit (total g /g per day) |
|---|---|---|---|---|---|---|---|---|---|---|---|
| 1 | 44 | F | 29.1 | T2D | 66.97 | 55.26 | 7 | 11.71 (17.49) | 1.46 (2.49) | 1416.5/202.3 | 76.3/10.9 |
| 2 | 29 | F | 31.1 | T2D, HT, OB | 109.4 | 96.55 | 8 | 12.85 (11.75) | 1.61 (1.47) | 6259/782.3 | 373/46.5 |
| 3 | 48 | F | 35.3 | T2D, HT, OB, AKI | 120.3 | 107.4 | 9 | 12.9 (10.72) | 1.43 (1.19) | 8076/897.3 | 516/57.3 |
| 4 | 31 | M | 29.1 | AKI | 167.8 | 142.1 | 11 | 25.7 (15.32) | 2.14 (1.28) | 3549.1/322.6 | 218.74/19.9 |
| 5 | 28 | F | 40.2 | OB | 166 | 152.8 | 11 | 13.2 (7.95) | 1.1 (0.66) | 3850/350 | 81.4/7.4 |
| 6 | 49 | F | 34.2 | HT, OB | 87.26 | 65.83 | 12 | 21.43 (24.5) | 1.79 (2.05) | 5692.5/ 474.3 | 269.6/22.4 |
| 7 | 43 | M | 28.8 | OB, AKI | 181.5 | 136.3 | 12 | 45.2 (24.9) | 3.77 (2.8) | 4177/348.8 | 251.5/20.9 |
| 8 | 60 | M | 23.6 | None | 123.2 | 108.3 | 14 | 14.9 (12.1) | 1.06 (0.86) | 9584/684.5 | 356/25.4 |
| 9 | 53 | F | 41 | T2D, OB, fibromyalgia | 82.05 | 70.79 | 15 | 11.26 (13.72) | 0.75 (0.91) | 6022.8/401.5 | 405/27 |
| 10 | 40 | M | 25.8 | HT, hypothyroidism | 165.3 | 145.6 | 17 | 19.7 (11.92) | 1.04 (0.63) | 2449/144.6 | 103.5/6.1 |
| 11 | 25 | M | 28.2 | Dyslipidemia | 160.8 | 127.2 | 20 | 33.6 (20.9) | 1.34 (0.84) | 22156.3/1107.8 | 705.7/35.8 |
| 12 | 62 | F | 25.3 | OB | 110.3 | 70.79 | 23 | 39.51 (35.82) | 1.72 (1.56) | 6480/281.7 | 236/10.3 |
| 13 | 33 | M | 24.8 | T2D | 119.5 | 116.7 | 23 | 2.8 (2.34) | 0.12 (0.1) | 13,871/603.9 | 590/25.65 |
| 14 | 19 | M | 26.9 | None | 185.2 | 145.3 | 28 | 39.9 (21.54) | 1.29 (0.69) | 13123.2/468.6 | 636/22.7 |
F: Female, M: Male, T2D: type 2 diabetes, HT: hypertension, OB: obesity, AKI: acute kidney injury, SMA: skeletal muscle area, CT: computed tomography, BMI: body mass index.
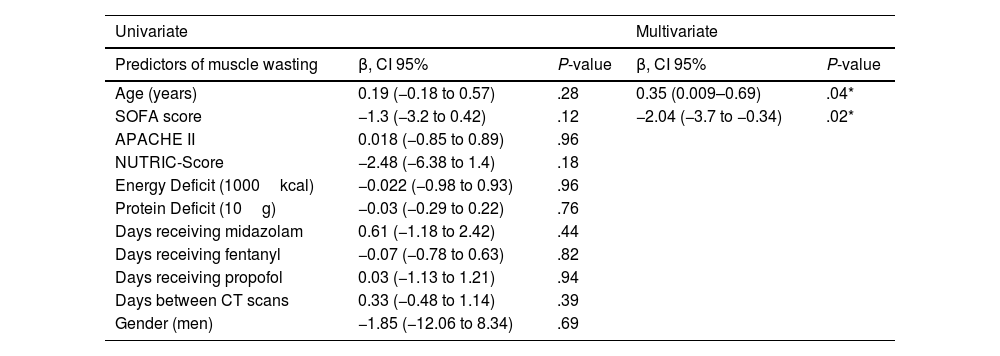
Significant SMA loss was observed in both genders (Supplementary Table 1). An average muscle wasting of 14.5% was observed for the study period (loss of 1.05% per day). Additionally, significant decrease in SMA was observed along the three groups (<10 days, 10–20 days and >20 days), with reported changes of 11.7, 13.7 and 21.2% respectively (Supplemental Table 2). Linear regression analysis was performed to identify predictors of muscle wasting. No statistical predictors were observed in univariate analysis. Using stepwise regression, only age (P=.04) and SOFA score (P=.02) showed association (Table 2).
Predictors of skeletal muscle area wasting measured by computed tomography.
| Univariate | Multivariate | |||
|---|---|---|---|---|
| Predictors of muscle wasting | β, CI 95% | P-value | β, CI 95% | P-value |
| Age (years) | 0.19 (−0.18 to 0.57) | .28 | 0.35 (0.009–0.69) | .04* |
| SOFA score | −1.3 (−3.2 to 0.42) | .12 | −2.04 (−3.7 to −0.34) | .02* |
| APACHE II | 0.018 (−0.85 to 0.89) | .96 | ||
| NUTRIC-Score | −2.48 (−6.38 to 1.4) | .18 | ||
| Energy Deficit (1000kcal) | −0.022 (−0.98 to 0.93) | .96 | ||
| Protein Deficit (10g) | −0.03 (−0.29 to 0.22) | .76 | ||
| Days receiving midazolam | 0.61 (−1.18 to 2.42) | .44 | ||
| Days receiving fentanyl | −0.07 (−0.78 to 0.63) | .82 | ||
| Days receiving propofol | 0.03 (−1.13 to 1.21) | .94 | ||
| Days between CT scans | 0.33 (−0.48 to 1.14) | .39 | ||
| Gender (men) | −1.85 (−12.06 to 8.34) | .69 | ||
SOFA: Sequential Organ Failure Assessment, APACHE II: Acute Physiology And Chronic Health Evaluation II.
Our study provides data about the rate of skeletal muscle area wasting in COVID-19 critically ill patients, we found a decrease of 17.3 (12.85–33.6)cm2 in SMA, which represents a muscle loss of 14.5% in an average time of 15 days. The daily percentage of muscle wasting reported by another study was 1.09% during the first 13 (9–18) days of ICU stay,7 this is close to our results where the included population had a daily muscle loss of 1.05% (0.69%–1.55%) during the first 15 days in ICU. Longer ICU stays correlate with increased muscle mass loss.1 We reported that the muscle wasting varies with time elapsed between measurements (<10 days, 10–20 days, >20 days), with changes of 11.7%, 13.7%, and 21.2% respectively. This progression of muscle loss may be attributed to clinical factors like higher CPD, CED, and extended use of sedatives, neuromuscular blocking agents, and immobilization.8 However, in our study, only age and SOFA score showed association. Age independently correlates with the percentage of SMA wasting, this result aligns with existing evidence indicating a lower anabolic response in the elderly compared to younger adults.9 Contrary to found by Gutiérrez-Zárate et al.,10 our analysis did not confirm a relationship between muscle loss and disease severity assessed by the SOFA score, possibly due to sample size limitations.
This study's strength lies in including patients with CT scans around ICU admission, enabling early muscle mass assessment and monitoring during ICU stay. CPD and CED were considered, nutritional indicators potentially related to greater muscle catabolism. However, limitations include: single-center enrollment, limited sample size, no data about physical rehabilitation interventions or clinical outcomes were recollected.
Muscle mass loss is a common and multifactorial problem in COVID-19 critically ill patients. Future research to assess nutritional therapies need to be tested.
FundingThis research did not receive any specific grant from funding agencies in the public, commercial, or not-for-profit sectors.
Conflict of interestAll authors declare that they have no conflict of interests.
We gratefully acknowledge all the physicians, nurses and dietitians for their dedication to the study.
The following is Supplementary data to this article:

