


To develop a sepsis death classification model based on machine learning techniques for patients admitted to the Intensive Care Unit (ICU).
DesignCross-sectional descriptive study.
SettingThe Intensive Care Units (ICUs) of three Hospitals from Murcia (Spain) and patients from the MIMIC III open-access database.
Patients180 patients diagnosed with sepsis in the ICUs of three hospitals and a total of 4559 patients from the MIMIC III database.
Main variables of interestAge, weight, heart rate, respiratory rate, temperature, lactate levels, partial oxygen saturation, systolic and diastolic blood pressure, pH, urine, and potassium levels.
ResultsA random forest classification model was calculated using the local and MIMIC III databases. The sensitivity of the model of our database, considering all the variables classified as important by the random forest, was 95.45%, the specificity was 100%, the accuracy was 96.77%, and an AUC of 95%. . In the case of the model based on the MIMIC III database, the sensitivity was 97.55%, the specificity was 100%, and the precision was 98.28%, with an AUC of 97.3%.
ConclusionsAccording to random forest classification in both databases, lactate levels, urine output and variables related to acid.base equilibrium were the most important variable in mortality due to sepsis in the ICU. The potassium levels were more critical in the MIMIC III database than the local database.
Desarrollar un modelo de clasificación basado en técnicas de machine-learning de muerte por sepsis para pacientes ingresados en la Unidad de Cuidados Intensivos (UCI).
DiseñoEstudio descriptivo transversal.
ÄmbitoUnidades de Cuidados Intensivos (UCI) de tres hospitales de Murcia (España) y pacientes con sepsis-3 de la base de datos de acceso abierto MIMIC III.
Pacientes180 pacientes diagnosticados de sepsis en las UCI de tres hospitales y un total de 4559 pacientes con la base de datos MIMIC III.
Variables de interés principalesSe evaluaron la edad, el peso, la frecuencia cardiaca, la frecuencia respiratoria, la temperatura, los niveles de lactato, la saturación parcial de oxígeno, la presión arterial sistólica y diastólica, el pH, los niveles de orina y los niveles de potasio.
ResultadosSe calcularon un modelo de clasificación de bosque aleatorio con la base de datos local y la base de datos MIMIC III. La sensibilidad del modelo de nuestra base de datos teniendo en cuenta todas las variables catalogadas como importantes por el random forest fue del 95,45%%, la especificidad del 100% y la exactitud del 96,77% y un AUC del 95%. En el caso del modelo sobre la base de datos MIMIC III la sensibilidad fue del 97,55%, la especificidad del 100% y la exactitud del 98,28% con un AUC del 97,3%.
ConclusionesSegún la clasificación de bosque aleatorio en ambas bases de datos, los niveles de lactato, la diuresis y las variables relacionadas con el equilibrio ácido-base fueron las variables más importantes para determinar las muertes por sepsis en la UCI. Los niveles medios de potasio fueron más críticos en la base de datos MIMIC III que en las locales.
The concept of sepsis began to be defined in 1992, when the first consensus on sepsis, Sepsis-1, was published. The concept gave rise to the Systemic Inflammatory Response (SIRS), defining sepsis as a “systemic inflammatory response associated with a disease.” In this consensus, levels of severity were also added: severe sepsis and septic shock. In 2001, modifications were made: a group of experts met and called this meeting Sepsis-2. Then, some values used for diagnosis were adjusted; however, there were no significant changes in the definition of sepsis. A working group met again in 2016 and published an update on sepsis called Sepsis-3, which determined the most current definition. It was published by The Sepsis Definitions Working Group and defined sepsis as “a life-threatening organ dysfunction caused by a dysregulated host response to infection.” In addition to the definition, it included tools to help diagnose sepsis.1,2
Concerning the loss of human life, sepsis entails a high economic cost for healthcare systems. In the United States, one-third of patients diagnosed with sepsis die at a cost of about $20,3 million a year. In Spain, the incidence is 100 cases per 100,000 people/year, and mortality is also between 20% and 43%. The estimated average cost is about $20,000 for each episode of severe sepsis.3–5 A considerable drawback in managing sepsis is the great difficulty in reaching a diagnosis.There is no specific test to establish the diagnosis, and the symptoms present very heterogeneously, making it more challenging to determine the onset of the disease and, consequently, start treatment as soon as possible. There is evidence that early diagnosis of sepsis and, therefore, Early initiation of treatment significantly reduces morbidity and mortality.
Initially, during the onset of sepsis, it is difficult to find symptoms or parameters that help us diagnose it. When we find easily recognizable signs, the disease is usually in an advanced stage, which entails more complex treatment and a worse prognosis. The efforts of many researchers are focused on developing tools that allow early detection of sepsis and its optimal management. Most hospitals have tools that attempt to detect and predict the onset of sepsis and its complications. The most used currently are the Modified Early Warning Score (MEWS) and its different versions, Systemic Inflammatory Response Syndrome (SIRS), the Sequential Organ Failure Assessment (SOFA), and its faster variant qSOFA.5–7
The introduction of electronic medical records in most hospitals makes it easier to access and use patient data (since) it is collected in a structured way and can be accessed quickly. It favors the development and implementation of prediction and decision-making systems. These tools facilitate processing the large amount of data we face when making decisions when treating patients. These tools aim to improve patient outcomes by facilitating early diagnosis and treatment decision-making.3,7
Traditional methods (MEWS, SOFA, SIRS, among others) are being widely questioned; Numerous studies defend Artificial Intelligence (AI) programs. Implement algorithms that predict sepsis, obtaining results with greater sensitivity and specificity than traditional methods.
Machine learning and Big Data (BD) are techniques expected to displace traditional methods and assist in research that cannot be performed with patients due to ethical limitations or other reasons.8,9
Some algorithms' lack of transparency and the staff's poor knowledge of their operation also generate resistance to their application, creating distrust and rejection of the system.10,11
Our objective was to develop a machine learning model of ICU mortality due to sepsis in a local and in an international population as MIMIC III open database and to evaluate the performance of each one
MethodsDesign: Cross-sectional descriptive study.
Setting: It was carried out in the Intensive Care Units (ICUs) of the Virgen de la Arrixaca University Hospital, Santa Lucía Hospital, and Los Arcos Hospital. The MIMIC III database.
Study population: 180 patients diagnosed with sepsis, 56 of whom died in the ICU. All patients who met the hospital's inclusion and exclusion criteria during 2022−23 were selected. Informed consent was obtained from the patients and/or family members for the anonymous use of the data. This study was carried out by the principles of the Declaration of Helsinki and was registered with the hospital's research committee. IRB Declaration Code 646 Health Area1Arrixaca. Murcian Health Service. Murcia Spain. Authorization date 07/02/2022.
- 1
Database obtained from local hospital
Inclusion criteria:
- -
Over 18 years.
- -
ICD-10 (International Classification of Diseases): sepsis, severe sepsis, or septic shock.
- -
Computerized clinical history.
Exclusion criteria:
- -
Under 18 years
- -
Patients admitted for reasons other than the CDI above.
- -
Patients were readmitted to the ICU within < 24 h.
Variables from the hospital database obtained during the first 24 h:
Qualitative:
Exitus: Death of the patient diagnosed with sepsis in the Intensive Care Unit. Dichotomous qualitative variable Yes (1)/No (0)
Sex: The patient's sex is reflected in the medical history. The qualitative, nominal, discrete, independent variable is male (0) or female (1).
- -
Hypertension: Reflected in the medical history in the medical evaluation upon admission. Independent dichotomous qualitative variable: Yes (0), No (1).
- -
Diabetes: Reflected in the medical history in the medical evaluation upon admission. Independent dichotomous qualitative variable: Yes (0), No (1).
- -
Consumption of vasoactive drugs: Existence of a record of vasoactive drug consumption in the electronic medical record. Variable, qualitative, dichotomous, dependent: Yes (0), No (1).
Quantitative:
Heart rate (heart rate): The number of beats per minute is automatically uploaded to the electronic medical record every hour. It is quantitative, discrete, and dependent.
Respiratory rate (Resprate): The number of breaths per minute is automatically uploaded to the electronic medical record every hour. It is quantitative, discrete, and dependent.
Systolic blood pressure (SBP): Expressed in mmHG, it is captured by the blood pressure monitor automatically or manually with a cuff or arterial line and automatically uploaded to the electronic medical record every hour. It is quantitative, discrete, and dependent.
- -
Diastolic blood pressure (DBP): Expressed in mmHG, captured by the blood pressure monitor automatically or manually with a cuff or arterial line, automatically uploaded to the electronic medical record every hour. Quantitative, discrete, dependent.
Oxygen saturation (SpO2): This is expressed as a percentage of the saturation captured by the monitor with hourly finger pulse oximetry. It is quantitative, discrete, and dependent.
Temperature: Taken manually by a clinical assistant with a tympanic meter at least every hour, expressed with two whole numbers and one decimal. It is quantitative, continuous, and dependent.
Arterial or venous lactate level: The lactate figure obtained after arterial or venous blood gases with variable frequency are analyzed in the units available in the ICU and expressed in millimoles per liter (mmo/l). It is quantitative, continuous, and dependent.
Potassium levels (K): Potassium levels obtained after performing arterial or venous blood gases with variable frequency, analyzed in the units available in the ICU, and expressed in mEq/l. They are quantitative, continuous, and dependent.
- -
arterial or venous pH: The pH level figure obtained after performing arterial or venous blood gases with variable frequency, analyzed in the units available in the ICU. It is quantitative, continuous, and dependent.
Body weight: Obtained from the electronic medical record (EHR), expressed in kilograms (kg). It is quantitative, continuous, and independent.
- -
Age: Figure obtained from the EHR, expressed in years completed. Quantitative, discreet, independent.
The hospital database was automatically extracted by dumping by the research staff of the centers into a cell format of the IntelliSpace Critical Care & Anesthesia (ICCA) healthcare software.
- 2
MIMIC III database
The MIMIC III database was extracted from Physionet: https://physionet.org/content/mimic3wdb/1.0/.1.
The total database initially consisted of 80 variables and 4559 patients. A correlation study was performed, and strongly correlated variables were eliminated. The reduced database contained 31 variables and 4559 patients. The objective was to find a classification model based on exitus (hospital_expire_flag) A total of 31 variables were collected from the MIMIC III database: categorical sex, ethnicity, metastatic_cancer, diabetes, quantitative; age, hospital_elixhauser, vent, couch, sirs, qsofa, aniongap_medium, bocarbonate_medium, creatinine_medium, glucose_medium, hemoglobin_medium, lactate_medium, platelet_means, potassium_means, inr_means, sodium_means, wbc_means, heartrate_means, sysbp_means, diasbp_means, resprate_means, tempc_means, spo2_media s, urine output, sepsis, hospital_expire_flag.
Statistical analysis in both databases was performed using SPSS software for Windows (version 25.0, SPSS, Chicago, Illinois, USA) and R (version 3.5.1). A bivariate analysis was performed, and the normality of the variables was checked using the Kolmogorov-Smirnoff test. The non-parametric Wilcoxon rank sum test (Mann-Whitney test) was used for two samples. Random forest-type classification models were implemented. The ROC curve calculated the AUC (Area Under the Curve), and the confusion matrix (actual vs predicted group) estimated the classification models' accuracy, precision, sensitivity, and specificity.
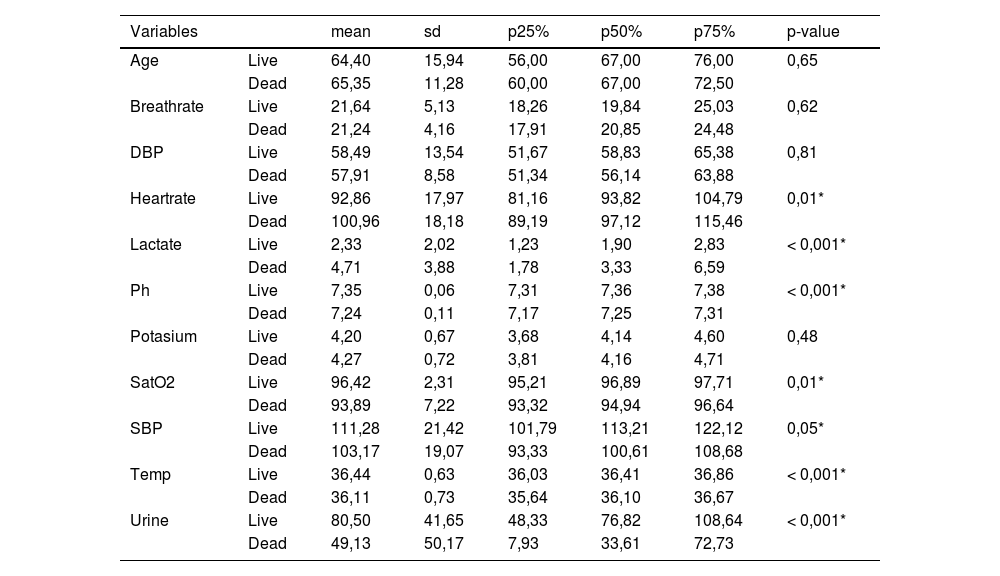
ResultsIn the database collected at the hospital, the study population was 180 patients, of which 42.85% of the 110 male patients and 46.80% of the 70 female patients died from sepsis. There were no statistically significant differences between death and ICU admission days. And the total days of stay in the ICU (until death or discharge to the ward). A summary of the descriptive statistics of our database is shown in Table 1.
Descriptive statistics of quantitative variables according to exitus.
| Variables | mean | sd | p25% | p50% | p75% | p-value | |
|---|---|---|---|---|---|---|---|
| Age | Live | 64,40 | 15,94 | 56,00 | 67,00 | 76,00 | 0,65 |
| Dead | 65,35 | 11,28 | 60,00 | 67,00 | 72,50 | ||
| Breathrate | Live | 21,64 | 5,13 | 18,26 | 19,84 | 25,03 | 0,62 |
| Dead | 21,24 | 4,16 | 17,91 | 20,85 | 24,48 | ||
| DBP | Live | 58,49 | 13,54 | 51,67 | 58,83 | 65,38 | 0,81 |
| Dead | 57,91 | 8,58 | 51,34 | 56,14 | 63,88 | ||
| Heartrate | Live | 92,86 | 17,97 | 81,16 | 93,82 | 104,79 | 0,01* |
| Dead | 100,96 | 18,18 | 89,19 | 97,12 | 115,46 | ||
| Lactate | Live | 2,33 | 2,02 | 1,23 | 1,90 | 2,83 | < 0,001* |
| Dead | 4,71 | 3,88 | 1,78 | 3,33 | 6,59 | ||
| Ph | Live | 7,35 | 0,06 | 7,31 | 7,36 | 7,38 | < 0,001* |
| Dead | 7,24 | 0,11 | 7,17 | 7,25 | 7,31 | ||
| Potasium | Live | 4,20 | 0,67 | 3,68 | 4,14 | 4,60 | 0,48 |
| Dead | 4,27 | 0,72 | 3,81 | 4,16 | 4,71 | ||
| SatO2 | Live | 96,42 | 2,31 | 95,21 | 96,89 | 97,71 | 0,01* |
| Dead | 93,89 | 7,22 | 93,32 | 94,94 | 96,64 | ||
| SBP | Live | 111,28 | 21,42 | 101,79 | 113,21 | 122,12 | 0,05* |
| Dead | 103,17 | 19,07 | 93,33 | 100,61 | 108,68 | ||
| Temp | Live | 36,44 | 0,63 | 36,03 | 36,41 | 36,86 | < 0,001* |
| Dead | 36,11 | 0,73 | 35,64 | 36,10 | 36,67 | ||
| Urine | Live | 80,50 | 41,65 | 48,33 | 76,82 | 108,64 | < 0,001* |
| Dead | 49,13 | 50,17 | 7,93 | 33,61 | 72,73 |
Regarding the qualitative variables from the local database, no statistically significant relationship was found between sex and exitus, hypertension and exitus (p-value = 0,098), and diabetes and exitus (p-value = 0,138).
In the case of the qualitative variables collected in the MIMIC database the following variables were statistically significant: mechanic ventilation-exitus (p-value < -2,2e-16), renal Replacement therapy-exitus (p-value = 0,00075), metastatic cancer (p-value = 3.02e-10) and blood culture positive (p-value = 7.528e-06).Diabetes-exitus variable was non-statistically significant (p-value = 0,7735)
The model was validated by dividing the local database into a training database containing 80% of the data on which a random forest was computed and a test database containing the remaining 20% of the data on which this model was applied. Fig. 1 shows the random forest with the variables that have been important in determining death in patients with sepsis.

The most critical variables in our database have been the average lactate level, diuresis(urine output), pH, and systolic pressure.
The model has an accuracy of 98% (0.89−0.99), a sensitivity of 97% and a specificity of 100%. The ROC curve and the AUC (0,97(0,91–1)) are shown in the Fig. 2.

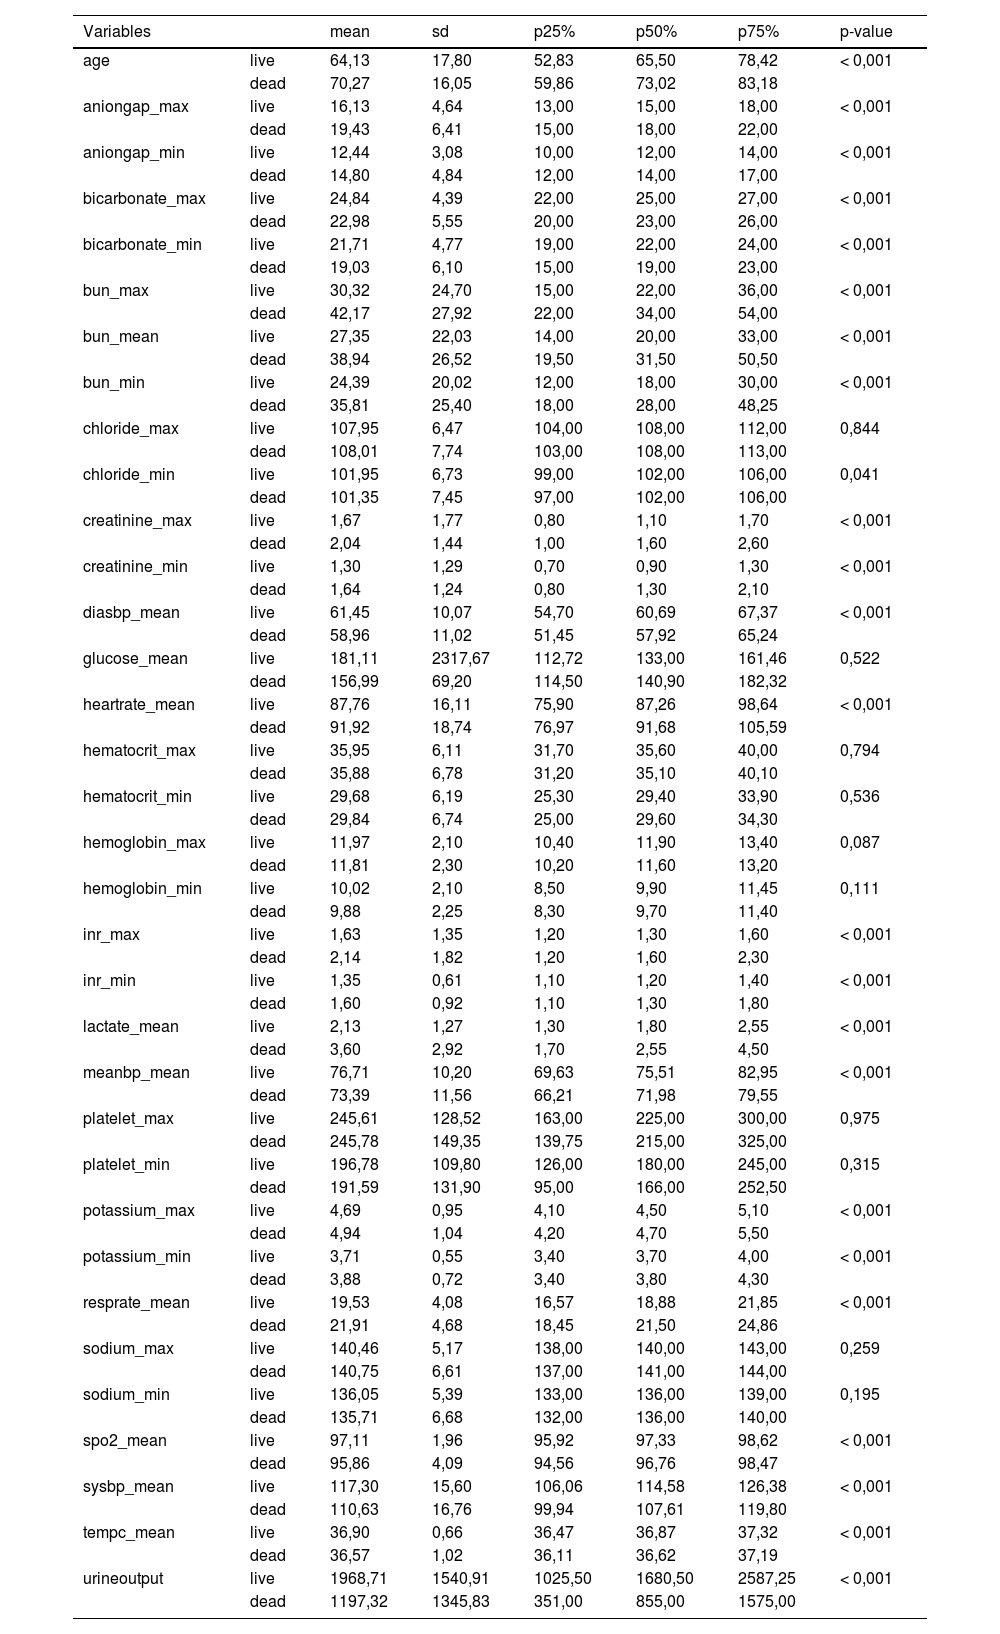
The study's second objective was calculating the random forest obtained from the public database MIMIC III. The study population was 4559 patients, of which 741 patients died from sepsis. There were no significant differences between the sexes. Table 2 shows the descriptive statistics from the MIMIC III database. The variables (mean): Age, anion gap, bicarbonate, creatinine, glucose, lactate, potassium,inr, sodium, bun,wbc, heart rate, sysbp, diasbp, bp, respiration rate,tempc, spo2, and urine output were statistically significant differences A Random Forest based on exitus (hospital_expire_flag) is carried out in the SEPSIS_GROUP database that shows the variables of importance (Fig. 3). The sensitivity of the classification model was 97.55%, the specificity was 100%, and the accuracy was 98.28% with an AUC of 97.3% (0.968−0.981) (Fig. 4).
Descriptive Statistics MIMIC III database.
| Variables | mean | sd | p25% | p50% | p75% | p-value | |
|---|---|---|---|---|---|---|---|
| age | live | 64,13 | 17,80 | 52,83 | 65,50 | 78,42 | < 0,001 |
| dead | 70,27 | 16,05 | 59,86 | 73,02 | 83,18 | ||
| aniongap_max | live | 16,13 | 4,64 | 13,00 | 15,00 | 18,00 | < 0,001 |
| dead | 19,43 | 6,41 | 15,00 | 18,00 | 22,00 | ||
| aniongap_min | live | 12,44 | 3,08 | 10,00 | 12,00 | 14,00 | < 0,001 |
| dead | 14,80 | 4,84 | 12,00 | 14,00 | 17,00 | ||
| bicarbonate_max | live | 24,84 | 4,39 | 22,00 | 25,00 | 27,00 | < 0,001 |
| dead | 22,98 | 5,55 | 20,00 | 23,00 | 26,00 | ||
| bicarbonate_min | live | 21,71 | 4,77 | 19,00 | 22,00 | 24,00 | < 0,001 |
| dead | 19,03 | 6,10 | 15,00 | 19,00 | 23,00 | ||
| bun_max | live | 30,32 | 24,70 | 15,00 | 22,00 | 36,00 | < 0,001 |
| dead | 42,17 | 27,92 | 22,00 | 34,00 | 54,00 | ||
| bun_mean | live | 27,35 | 22,03 | 14,00 | 20,00 | 33,00 | < 0,001 |
| dead | 38,94 | 26,52 | 19,50 | 31,50 | 50,50 | ||
| bun_min | live | 24,39 | 20,02 | 12,00 | 18,00 | 30,00 | < 0,001 |
| dead | 35,81 | 25,40 | 18,00 | 28,00 | 48,25 | ||
| chloride_max | live | 107,95 | 6,47 | 104,00 | 108,00 | 112,00 | 0,844 |
| dead | 108,01 | 7,74 | 103,00 | 108,00 | 113,00 | ||
| chloride_min | live | 101,95 | 6,73 | 99,00 | 102,00 | 106,00 | 0,041 |
| dead | 101,35 | 7,45 | 97,00 | 102,00 | 106,00 | ||
| creatinine_max | live | 1,67 | 1,77 | 0,80 | 1,10 | 1,70 | < 0,001 |
| dead | 2,04 | 1,44 | 1,00 | 1,60 | 2,60 | ||
| creatinine_min | live | 1,30 | 1,29 | 0,70 | 0,90 | 1,30 | < 0,001 |
| dead | 1,64 | 1,24 | 0,80 | 1,30 | 2,10 | ||
| diasbp_mean | live | 61,45 | 10,07 | 54,70 | 60,69 | 67,37 | < 0,001 |
| dead | 58,96 | 11,02 | 51,45 | 57,92 | 65,24 | ||
| glucose_mean | live | 181,11 | 2317,67 | 112,72 | 133,00 | 161,46 | 0,522 |
| dead | 156,99 | 69,20 | 114,50 | 140,90 | 182,32 | ||
| heartrate_mean | live | 87,76 | 16,11 | 75,90 | 87,26 | 98,64 | < 0,001 |
| dead | 91,92 | 18,74 | 76,97 | 91,68 | 105,59 | ||
| hematocrit_max | live | 35,95 | 6,11 | 31,70 | 35,60 | 40,00 | 0,794 |
| dead | 35,88 | 6,78 | 31,20 | 35,10 | 40,10 | ||
| hematocrit_min | live | 29,68 | 6,19 | 25,30 | 29,40 | 33,90 | 0,536 |
| dead | 29,84 | 6,74 | 25,00 | 29,60 | 34,30 | ||
| hemoglobin_max | live | 11,97 | 2,10 | 10,40 | 11,90 | 13,40 | 0,087 |
| dead | 11,81 | 2,30 | 10,20 | 11,60 | 13,20 | ||
| hemoglobin_min | live | 10,02 | 2,10 | 8,50 | 9,90 | 11,45 | 0,111 |
| dead | 9,88 | 2,25 | 8,30 | 9,70 | 11,40 | ||
| inr_max | live | 1,63 | 1,35 | 1,20 | 1,30 | 1,60 | < 0,001 |
| dead | 2,14 | 1,82 | 1,20 | 1,60 | 2,30 | ||
| inr_min | live | 1,35 | 0,61 | 1,10 | 1,20 | 1,40 | < 0,001 |
| dead | 1,60 | 0,92 | 1,10 | 1,30 | 1,80 | ||
| lactate_mean | live | 2,13 | 1,27 | 1,30 | 1,80 | 2,55 | < 0,001 |
| dead | 3,60 | 2,92 | 1,70 | 2,55 | 4,50 | ||
| meanbp_mean | live | 76,71 | 10,20 | 69,63 | 75,51 | 82,95 | < 0,001 |
| dead | 73,39 | 11,56 | 66,21 | 71,98 | 79,55 | ||
| platelet_max | live | 245,61 | 128,52 | 163,00 | 225,00 | 300,00 | 0,975 |
| dead | 245,78 | 149,35 | 139,75 | 215,00 | 325,00 | ||
| platelet_min | live | 196,78 | 109,80 | 126,00 | 180,00 | 245,00 | 0,315 |
| dead | 191,59 | 131,90 | 95,00 | 166,00 | 252,50 | ||
| potassium_max | live | 4,69 | 0,95 | 4,10 | 4,50 | 5,10 | < 0,001 |
| dead | 4,94 | 1,04 | 4,20 | 4,70 | 5,50 | ||
| potassium_min | live | 3,71 | 0,55 | 3,40 | 3,70 | 4,00 | < 0,001 |
| dead | 3,88 | 0,72 | 3,40 | 3,80 | 4,30 | ||
| resprate_mean | live | 19,53 | 4,08 | 16,57 | 18,88 | 21,85 | < 0,001 |
| dead | 21,91 | 4,68 | 18,45 | 21,50 | 24,86 | ||
| sodium_max | live | 140,46 | 5,17 | 138,00 | 140,00 | 143,00 | 0,259 |
| dead | 140,75 | 6,61 | 137,00 | 141,00 | 144,00 | ||
| sodium_min | live | 136,05 | 5,39 | 133,00 | 136,00 | 139,00 | 0,195 |
| dead | 135,71 | 6,68 | 132,00 | 136,00 | 140,00 | ||
| spo2_mean | live | 97,11 | 1,96 | 95,92 | 97,33 | 98,62 | < 0,001 |
| dead | 95,86 | 4,09 | 94,56 | 96,76 | 98,47 | ||
| sysbp_mean | live | 117,30 | 15,60 | 106,06 | 114,58 | 126,38 | < 0,001 |
| dead | 110,63 | 16,76 | 99,94 | 107,61 | 119,80 | ||
| tempc_mean | live | 36,90 | 0,66 | 36,47 | 36,87 | 37,32 | < 0,001 |
| dead | 36,57 | 1,02 | 36,11 | 36,62 | 37,19 | ||
| urineoutput | live | 1968,71 | 1540,91 | 1025,50 | 1680,50 | 2587,25 | < 0,001 |
| dead | 1197,32 | 1345,83 | 351,00 | 855,00 | 1575,00 |
*p < 0.05, Age: years, SpO2:%, SBP-DBP: mmHg, Lactate: mmol/l, Potassium: mEq/l. All variables correspond to averages during ICU stay.
.")

The most significant variables are the average urinary output, lactate mean, anion gap, spO2, age, potassium mean, respiration rate, and systolic blood pressure mean.
The standard variables in both databases that have shown the most significant importance have been the average lactate and the average urine production, adding the average oxygen saturation, the average temperature, and, in our case, the pH measurement that could correspond. In the case of the MIMIC III, with the bicarbonate mean and Annion gap. Other fundamental constants in the MIMIC III, such as the average respiratory rate and potassium mean that the hospital's database appears, but not with relevance. Systolic pressure is quite important in both databases.
Finally, we proposed to evaluate the model calculated from the local database as an external validation of the MIMIC III database. For this purpose, we use the common variables between the local and MIMIC III databases. We included the common 12 variables: Age, exitus, uci_days, Heartrate_mean, Resprate_mean, Sysbp_mean, Diasbp_mean, Spo2_mean, Tempc_mean, Urine_mean, Lactate_mean and Potassium_mean. The accuracy was 0,78 (0,49–0,95) from the local database and an AUC of 0,70 (0,40–1). The explanation for this low accuracy was that the variable ph mean was essential in the model built with our local database. From the MIMIC database, the accuracy was only 0,56 (0,55–0,58) and an AUC of 0,58 (0,56–0,60). The accuracy in this case could have been lower due to the reduction of the number of essential variables from 31 to 12 variables.
We concluded that the external validation of our model was not possible due to the different number of variables and the absence in the MIMIC III database of a critical variable such as ph mean
DiscussionSince the 2000s, the publication of articles related to machine learning has increased significantly, becoming one of the study trends at the health research level. Open access to extensive patient databases allows machine learning techniques to be applied to diagnosing and prognosis different diseases. In this work, we have used the MIMIC III public access database of ICU patients with sepsis to contrast the model calculated with machine learning techniques with the one generated with our database.
Many published articles use the MIMIC III database to evaluate risk variables in patients with sepsis. Vital signs, age, demographic data, and the MIMIC III database helped develop the Insight algorithm, which performed well compared to the various methods used until then.12
Calvert et al. carried out the study with the MIMIC II database, using both vital signs and laboratory values (Procalcitonin and lactic acid); using Insight, they obtained better results than other models.13 Other authors, such as Kam and Kim, extracted vital signs from MIMIC II to perform a deep-learning study. They compared deep learning networks with LSTM (long short-term memory) architectures. They obtained better LSTM results than other sepsis prediction methods.14 Moor et al. performed a sepsis prediction study mixing machine learning techniques with DTW (Dynamic et al.). They used MIMIC III as a database to extract vital signs and laboratory values. They obtained good results compared to other works.15
Nemati et al. carried out a test with two different databases; they used both Emory Healthcare and MIMIC III, the former to develop the algorithm and the latter as a control. They took as values the vital signs, laboratory results, demographic data, surgical history, and statistical data.16
Mao et al. relied on the Insight algorithm and used vital signs from several hospitals to try to predict sepsis, severe sepsis, and septic shock. They used a Gradient tree-boosting algorithm. The database used to train the algorithm was MIMIC III, using transfer learning, with which they obtained better results than other databases.5
Scherph et al. calculated a neural network architecture using the MIMIC III database, from which they obtained vital signs and white blood cell counts. They compared the results with the Insight algorithm. They obtained better results in terms of AUC.2
Van Steenkiste et al. developed a blood culture results prediction study with an LSTM structure. Blood cultures are essential in choosing sepsis treatment. They took laboratory and vital sign data in the hospital emergency environment to carry it out. They concluded that the prediction period of the previous 72 h is ideal and that they obtained better results with deep learning than with other methods.17 Schaomoni et al. experimented with linear and non-linear models, their significant contribution being a new and verified database. They used several parameters, such as respiratory rate and C-reactive protein (CRP). Furthermore, they investigated the individual evolution of each prediction.18
Ribas Ripoll et al. analyzed the mortality prediction in ICU patients with sepsis by developing a new method called the Quotient Basis Kernel (QBK). They simplified the Fisher kernel and used variables such as days of stay or vasoactive agents from the MIMIC II database.19
In our study carried out with the databases of several hospitals and the public database MIMIC III, the essential variables standard to the local databases were mean lactate, mean pH, urine output, and partial O2 saturation in addition to age, and the minimum SBP, achieving an accuracy of 95%–98% of the predictions of death due to sepsis. The variables respiratory rate, amount of urine, and minimum potassium were also added to the classification model calculated on the MIMIC III database. The importance of potassium in the MIMIC III database is relevant, while in our hospital, it is identified in the random forest but with less importance.
Of all the variables in both databases, lactate has particular relevance. According to recent publications, high circulating levels of lactate are associated with the severity and mortality of sepsis. Lactate could promote the release of HMGB1 during sepsis. Some studies have determined that lactate participates in the lactylation and acetylation of HMGB1 in macrophages during polymicrobial sepsis. Macrophages can uptake extracellular lactate via monocarboxylate transporters (MCTs) to promote HMGB1 lactylation through a p300/CBP-dependent mechanism. Lactate has been shown to stimulate HMGB1 acetylation through suppression of the Hippo/YAP-mediated SIRT1 deacetylase and β-arrestin2-mediated recruitment of p300/CBP acetylases to the nucleus via G protein-coupled receptor 81 (GPR81). Lactylated/acetylated HMGB1 is released from macrophages through exosome secretion, increasing endothelial permeability. In vivo, reducing lactate production and/or inhibition of GPR81-mediated signaling decreases circulating levels of exosomal HMGB1 and improves survival outcomes in polymicrobial sepsis.20
The main limitation of this work was that the variables of the local database, obtained from local hospital records, and the MIMIC III database have a very different number of variables (31 MIMIC III and 15 local databases), and some variables are not common to both databases. In our study, the variable pH mean was the most critical variable in the random forest and is not included in the MIMIC III database. We could equipare pH with the bicarbonate and anion gap values of the MIMC II database. These variables are important in the random forest calculated with this database. As these variables are not comparable to pH, it is impossible to validate our model with this database. In any case, the study's main conclusion is the importance of the variables urine output, satO2, Sisbp mean, lactate levels, and variables related to acid-base equilibrium, such as pH and anion gap. Another conclusion is that despite the difference in the number of variables, the machine learning models calculated with the local database and the MIMIC III database have similar accuracies, sensitivities, and specificities.
ConclusionMany authors have developed predictive models for death in sepsis patients admitted to intensive care units. Artificial intelligence techniques and access to standardized and public databases are essential to developing these models. In both databases, lactate levels, average urine production, and variables related to acid-base equilibrium are critical variables in the prognosis of sepsis.
Authors’ contributionsAll authors contributed to the study conception and design. Material preparation, data collection and analysis were performed by Javier Carrillo Pérez-Tomé, Gracia Castro-Luna, Ana Belén Castaño-Fernandez, Bruno José Nievas-Soriano and Tesifón Parrón-Carreño.
The first draft of the manuscript was written by Gracia Castro-Luna and all authors commented on previous versions of the manuscript. All authors read and approved the final manuscript.
Statements and declarations
▪The authors have no relevant financial or non-financial interests to disclose.
▪The authors have no conflicts of interest to declare relevant to this article's content.
▪All authors certify that they have no affiliations with or involvement in any organization or entity with any financial or non-financial interest in the subject matter or materials discussed in this manuscript.
▪The authors have no financial or proprietary interests in any material discussed in this article.

