

In a recent article in Medicina Intensiva,1 Professor Ramos-Vera introduced the clinical use of Bayes factors, also known as likelihood ratios (LR). The author modified the classic Jeffreys scale2 to make LRs more interpretable in the daily clinical practice. With this idea of applicability, it seems apparent the so-called “Weights of Evidence” should also become more widely accepted in intensive care medicine.
The weight of evidence (WoE) is no more than ten times the decimal logarithm of an LR. Its unit of measurement is the deciban. Therefore,
Positive WoE=10 * log10 (positive LR) decibans
Negative WoE=10 * log10 (negative LR) decibans
It was Alan Turing who invented the WoEs as the basic statistical method used to decipher the Nazi's “Enigma” code.3 A deciban is the smallest change in the weight of evidence that can be directly perceived by human intuition.
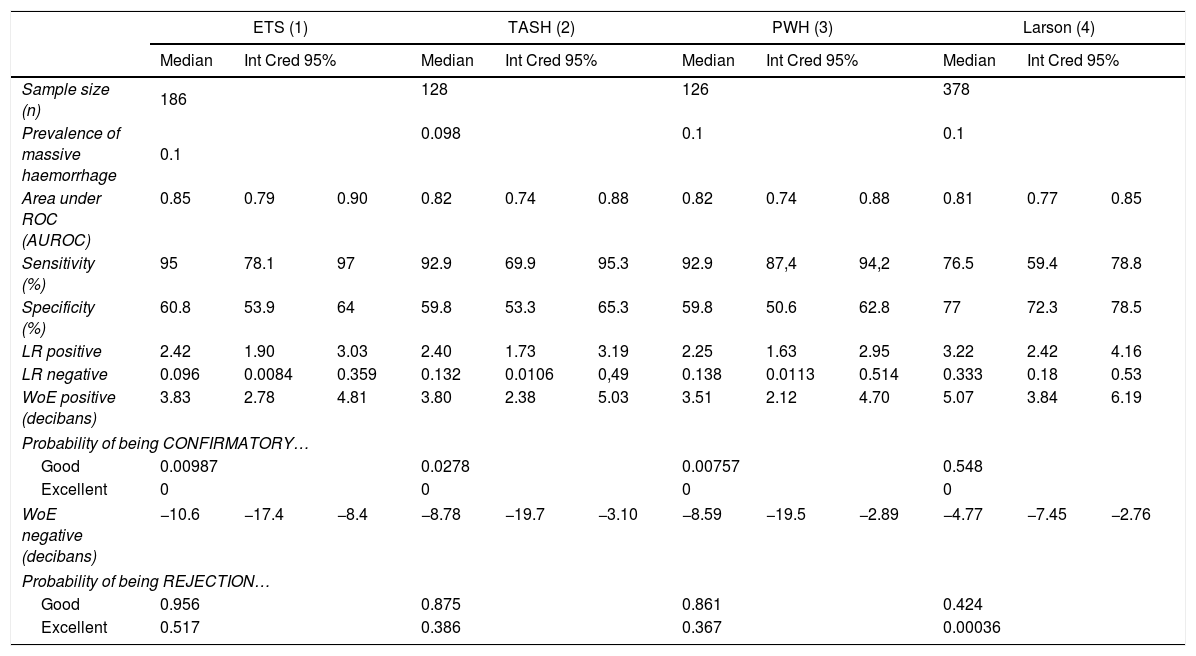
Let's look at a specific example comparing the use of LVs and WoEs in a clinical case. In a recent Medicina Intensiva publication,4 the diagnostic accuracy of 6 massive haemorrhage (MH) prediction scales in polytraumatised patients was evaluated. With the data from 4 of these scales, we have prepared Table 1.
Comparison between the performances or LRs and WoEs in evaluating the diagnostic accuracy of four clinical scales for prediction of massive bleeding in trauma patients:.
| ETS (1) | TASH (2) | PWH (3) | Larson (4) | |||||||||
|---|---|---|---|---|---|---|---|---|---|---|---|---|
| Median | Int Cred 95% | Median | Int Cred 95% | Median | Int Cred 95% | Median | Int Cred 95% | |||||
| Sample size (n) | 186 | 128 | 126 | 378 | ||||||||
| Prevalence of massive haemorrhage | 0.1 | 0.098 | 0.1 | 0.1 | ||||||||
| Area under ROC (AUROC) | 0.85 | 0.79 | 0.90 | 0.82 | 0.74 | 0.88 | 0.82 | 0.74 | 0.88 | 0.81 | 0.77 | 0.85 |
| Sensitivity (%) | 95 | 78.1 | 97 | 92.9 | 69.9 | 95.3 | 92.9 | 87,4 | 94,2 | 76.5 | 59.4 | 78.8 |
| Specificity (%) | 60.8 | 53.9 | 64 | 59.8 | 53.3 | 65.3 | 59.8 | 50.6 | 62.8 | 77 | 72.3 | 78.5 |
| LR positive | 2.42 | 1.90 | 3.03 | 2.40 | 1.73 | 3.19 | 2.25 | 1.63 | 2.95 | 3.22 | 2.42 | 4.16 |
| LR negative | 0.096 | 0.0084 | 0.359 | 0.132 | 0.0106 | 0,49 | 0.138 | 0.0113 | 0.514 | 0.333 | 0.18 | 0.53 |
| WoE positive (decibans) | 3.83 | 2.78 | 4.81 | 3.80 | 2.38 | 5.03 | 3.51 | 2.12 | 4.70 | 5.07 | 3.84 | 6.19 |
| Probability of being CONFIRMATORY… | ||||||||||||
| Good | 0.00987 | 0.0278 | 0.00757 | 0.548 | ||||||||
| Excellent | 0 | 0 | 0 | 0 | ||||||||
| WoE negative (decibans) | −10.6 | −17.4 | −8.4 | −8.78 | −19.7 | −3.10 | −8.59 | −19.5 | −2.89 | −4.77 | −7.45 | −2.76 |
| Probability of being REJECTION… | ||||||||||||
| Good | 0.956 | 0.875 | 0.861 | 0.424 | ||||||||
| Excellent | 0.517 | 0.386 | 0.367 | 0.00036 | ||||||||
(1) ETS scale: Emergency Transfusion Score; (2) TASH scale: Trauma Associated Severe Haemorrhage; (3) PWH scale: Prince of Wales Hospital/Rainer; (4) Larson scale; LR positive: Likelihood Ratio of a positive result; LR negative: Likelihood Ratio of a negative result; WoE positive: weight of the evidence of a positive result; WoE negative: weight of the evidence of a negative result; good as a confirmatory test: WoE positive>+ 5 decibans; excellent as a confirmatory test: WoE positive>+10 decibans; good as a rejection test: WoE positive<−5 decibans; excellent as a rejection test: WoE positive<−10 decibans.
We can see by looking at it that the meaning of LRs, especially LR for negatives, is a little difficult to interpret. The fact that the measurement scale is different for the positives (from 1 to infinity) and for the negatives (from 0 to 1) greatly contributes to this. The authors in using the inverse of negative LR might have caused even more confusion.
On the contrary, the use of decibans here could be very illustrative. The logarithmic transformation of the LRs means that both WoEs are expressed in a single measurement scale. A positive deciban could be used to confirm a disease and a negative one to rule it out. And in magnitude, decibans are interpreted similarly to the marks obtained in secondary school. All pupils know that an eight is not the same as obtaining a three. A weighting of +7.5 decibans means passing an exam of “confirmatory test” with a good grade, whereas a weighting of −3.5 decibans is not passing an exam of “rejection test”. Like in school, the thresholds are +5 decibans for confirmation and -5 decibans for rejection of a disease.
In Table 1, we can see that three scales (ETS, TASH and PWH) are good ways of ruling out MH: the average weight of their negative is less than −8 decibans, and the probability that the three could be good rejection tests (weight<−5 decibans) is close to 1. And we have a 0.517 probability that ETS is an excellent (weight<−10 decibans) scale to reject MH. The authors did not realise the importance of this result. There is another clinical result that also went unnoticed. A positive on the Larson scale weights +5.07 decibans. Although the confirmation capacity is not excellent, the probability that this could be a good confirmatory test (weight>+5 decibans) is 0.548, well above the other three scales (Fig. 1). This can be important in a clinical setting when accurately trying to confirm the appearance of an MH, for example to carry out adequate triage in an accident with multiple victims. In this scenario, none of the other three scales are adequate. With the use of decibans we can see the importance. Alan Turing would agree.


