


To compare the effect of hypocaloric versus standard enteral feeding on clinical outcomes in critically ill adults, and to investigate the influence of protein intake upon the outcome effects of hypocaloric feeding.
DesignA meta-analysis of randomized controlled trials (RCTs) and trial sequential analysis (TSA) were carried out.
SettingIntensive Care Unit (ICU).
PatientsOr participants Critically ill adults.
InterventionsHypocaloric enteral feeding versus standard enteral feeding.
Main variables of interestThe primary outcomes were all-cause short-term mortality and the incidence of nosocomial infection.
ResultsEleven RCTs met the inclusion criteria; of these trials, two were judged as having low risk of bias. Compared with standard enteral feeding, hypocaloric enteral feeding had no benefits in terms of reducing short-term mortality, the incidence of nosocomial infection, or long-term mortality, though it had a positive impact upon the incidence of gastrointestinal intolerance. The TSA further confirmed these results. In turn, hypocaloric enteral feeding had no effects upon the incidence of bloodstream infection, pneumonia, hypoglycemia or the duration of mechanical ventilation, ICU stay, or in-hospital stay. The above results remained unchanged in the sub-analysis of trials with a low risk of bias, trials administering a similar dose of protein, or trials administering different doses of protein.
ConclusionsCompared with standard enteral feeding, hypocaloric enteral feeding was not associated with better clinical outcomes in critically ill adults, except for a lower risk of gastrointestinal intolerance. The difference in protein intake between groups might have no influence on the outcome effects of hypocaloric enteral feeding. High quality randomized controlled trials are needed to confirm this, however.
Comparar el efecto de la nutrición enteral hipocalórica frente a la nutrición enteral estándar en adultos críticamente enfermos, así como investigar la influencia de la ingesta de proteínas sobre los efectos de la nutrición enteral hipocalórica.
DiseñoMetanálisis de ensayos controlados y aleatorizados y análisis secuencial de ensayos.
ÁmbitoUnidad de Cuidados Intensivos.
PacientesAdultos críticamente enfermos.
IntervencionesNutrición enteral hipcalórica frente a nutrición enteral estándar.
Variables de interés principalesLos desenlaces principales fueron la mortalidad a corto plazo por cualquier causa y los episodios de infección nosocomial.
ResultadosOnce ensayos controlados y aleatorizados cumplieron los criterios de inclusión y se consideró que dos de ellos presentaban un bajo riesgo de sesgo. En comparación con la nutrición enteral estándar, la nutrición enteral hipocalórica no presentó ningún riesgo en cuanto a la reducción de la mortalidad a corto plazo, los episodios de infección nosocomial ni la mortalidad a largo plazo, pero sí presentó un efecto beneficioso sobre los episodios de intolerancia gastrointestinal. El análisis secuencial de ensayos confirmó estos resultados. Por otra parte, la nutrición enteral hipocalórica no tuvo ningún efecto sobre los episodios de bacteriemia, neumonía o hipoglucemia, así como tampoco sobre la duración de la ventilación mecánica, de la estancia en la Unidad de Cuidados Intensivos ni del ingreso hospitalario. No se observó ningún cambio en estos resultados en el subanálisis de los ensayos con un bajo riesgo de sesgo, en los ensayos en los que se administró una dosis similar de proteínas ni en los ensayos en los que se administró una dosis diferente de proteínas.
ConclusionesEn comparación con la nutrición enteral estándar, la nutrición enteral hipocalórica no se asoció con unos mejores desenlaces en adultos críticamente enfermos, con la excepción de un menor riesgo de intolerancia gastrointestinal. Si bien es posible que la diferencia en la ingesta de proteínas entre ambos grupos no haya tenido ninguna influencia sobre los desenlaces de la nutrición enteral hipocalórica, esto debería confirmarse en ensayos clínicos controlados, aleatorizados y de alta calidad.
During the adaptive stress response to critical illness, the neuroendocrine system and the immuno-inflammatory system are triggered, resulting in an activation of the sympathetic nervous system and the hypothalamic–pituitary axis, and release of various hormones, cytokines and inflammatory mediators.1–3 These pathophysiological changes induces a resistance to anabolic signals and implies the final common pathway of metabolic response in acute phase of critical illness, that is hypercatabolism and hypermetabolism.1,4 In addition, critically ill patients are also at high risk of insufficient oral intake. As a consequence, critically ill patients will, inevitably, develop to a malnutrition, even to multiple organ dysfunction.4 Therefore, it is essential for critically ill patients to receive nutrition therapy.
Enteral nutrition (EN) has been recommended as the first choice of nutrition therapy for critically ill patients,4,5 it is anticipated to attenuate the oxidative stress response, modulate the immune response, and improve the metabolic status by delivering with macro- and micronutrients.5–7 Theoretically, standard enteral feeding that achieved full or near full calories supply can meet the daily demand of energy, and thus results in an improvement in clinical outcomes. However, standard enteral feeding with full or near full calories supply are always accompanied by increased risk of gastrointestinal (GI) intolerance and refeeding syndrome,4 which will, in turn, lead to high risk of infections and prolonged length of intensive care unit (ICU) stay. Accordingly, hypocaloric enteral feeding rather than standard enteral feeding has been advocated by the European Society for Clinical Nutrition and Metabolism (ESPEN) to be applied in the early phase of critical illness,4 where hypocaloric feeding was defined as an energy administration below 70% of the defined target by ESPEN guidelines.4
In fact, a majority of randomized controlled trials (RCTs)8–13 failed to identify an beneficial effect on mortality with use of hypocaloric enteral feeding, several meta-analyses14–17 also revealed a neutral effects on mortality or other outcomes in critically ill patients, the efficacy and safety of hypocaloric feeding in critically ill patients is still controversial to date. Recently, more and more evidence showed that the dose of protein intake is associated with clinical outcomes in critically ill patients,18–20 there are even opinions that protein intake may be more important than caloric intake for improving clinical outcomes,21,22 it seems that protein intake might affect the effectiveness of hypocaloric feeding. Hence, considering that several RCTs23–25 regarding the appropriate caloric dose for critically ill patients were published in recent, we performed a new meta-analysis to detect the effect of hypocaloric enteral feeding, as compared to standard feeding, on clinical outcomes in critically ill patients, and, in particular, to investigate the effect of protein intake on the outcome effects of hypocaloric enteral feeding.
Materials and methodsThis meta-analysis was conducted in accordance with the PRISMA guidance26 and registered at the international prospective register of systematic reviews (PROSPERO registration number: CRD42019129606).
Search strategyTwo independent authors (Zhou X and Fang H) in our team conducted a comprehensive database search for RCTs, where critically ill adults were randomized to receive either hypocaloric enteral feeding (defined as daily provision of <70% of estimated or measured energy requirements4) or standard enteral feeding (defined as daily provision of ≥70% of estimated or measured energy requirements), using medical subject heading terms combined with liberal terms in PubMed, EMBASE, Web of Science and the Cochrane database of clinical trials from database inception through 16 March 2019. We also manually searched the reference lists of previous review articles to further identify the relevant literature. There were no restrictions on language in this meta-analysis. The detailed search strategy is available in the supplementary material.
Study selectionAll records from the database search were filtered to exclude duplicates. Three authors (Zhou X, Xu J, and Wang H) independently screened the title and abstract of the remaining records to determine whether the studies met the inclusion criteria. The full-text of the records deemed eligible during preliminary screening were retrieved and reviewed in accordance with the inclusion and exclusion criteria. The inclusion criteria includes:
- 1)
Study design: prospective RCT;
- 2)
Population: critically ill adults (age≥16 years) admitted to the ICU who received EN as the main nutrition supply (>50% energy delivery) within 48hours after ICU admission;
- 3)
Intervention: hypocaloric enteral feeding with a mean daily caloric intake of <70% of estimated or measured energy requirements4;
- 4)
Control: standard enteral feeding with a mean daily caloric intake of ≥70% of estimated or measured energy requirements.4
There were no restrictions on protein intake, delivery method, energy dense or formulas of enteral nutrition, or measurement method of energy requirement. Those studies that did not directly compare two dose of caloric intake but led to different dose of caloric intake were also considered. The exclusion criteria includes:
- 1)
Not RCT;
- 2)
Not critically ill adults or not admitted to the ICU;
- 3)
Received parenteral nutrition (PN) as the main source of nutrition;
- 4)
Both groups received a mean daily caloric intake of ≥ or <70% of estimated or measured energy requirements;
- 5)
Did not report the proportion of daily caloric intake to goal caloric requirements or the interested outcomes.
We also excluded those abstract without full-text. Any disagreements between the three authors were resolved through discussion until a consensus was reached.
Data extractionTwo authors (Pan J and Sha Y) independently extracted the associated data from each included trials using a standardized data extraction form, including characteristics of the included studies, details of the population enrolled, duration of intervention, and detailed information on EN, including the nutrition regimen, caloric intake, and protein intake. We contacted the authors for the complete data set via email if some interested data were not reported. Discrepancies between the reviewers were resolved through discussion with a third reviewer and by consensus.
Clinical outcomesThe primary outcomes include all-cause short-term mortality (defined as death within 30 days of randomization, including ICU, in-hospital, 28-day, or 30-day mortality) and incident of nosocomial infection. Secondary outcomes include all-cause long-term mortality (defined as death occurring beyond 30 days of randomization, including 60-day, 90-day, or 180-day mortality), incident of bloodstream infection, pneumonia, hypoglycemia and GI intolerance. Tertiary outcomes include duration of ICU stay, in-hospital stay, and duration of mechanical ventilation (MV). Studies that assessed at least one of the above outcomes were included. In studies in which various short-term or long-term mortalities were reported, the longest follow-up mortality was included in analysis. The infection complications (nosocomial infection, bloodstream infection and pneumonia) and hypoglycemia were defined by the authors in the included trials, the GI intolerance was predefined as GI dysfunction with symptoms of vomiting, noninfectious diarrhea, abdominal distension, regurgitation, or large gastric residual volumes, or defined as by the authors in the included trials.
Risk of bias assessmentThe quality of each included trials were independently evaluated by two authors (Hu C and Xu Z) for the primary outcomes according to the Cochrane Collaboration methods.27 Disagreements were resolved via discussion with a third reviewer to reach a consensus on the quality evaluation of included studies. We assigned a value of high, unclear or low to the following seven domains: adequate sequence generation, allocation concealment, blinding of participants and personnel, blinding of outcome assessment, incomplete outcome data, selective reporting, and other bias. Studies that exhibited a low risk of bias in all domains were adjudicated as have low risk of bias, or were adjudicated as have high risk of bias.
Statistical analysisAll statistical analyses were performed using Stata/SE 11.0 (StataCorp, College Station, TX, USA). The pooled relative risk (RR) for dichotomous data and the pooled weight mean difference (WMD) for continuous data, with corresponding 95% confidence interval (CI), were calculated. However, data on duration of MV were pooled using the standardized mean difference (SMD) due to the different time unit. We assessed the statistical heterogeneity among trials by inspecting the forest plots and quantitatively by using the diversity (D2) and inconsistency factor (I2) statistics. Both fixed-effects and random-effects meta-analyses were conducted for all outcomes (Table 1). Given the substantial clinical or statistical heterogeneity (in primary diagnosis, enteral nutrition formulas, energy measure method, etc.) between included trials, we reported the pooled data from random-effects model as the main result, otherwise we reported the results from a fixed-effects model if one or two trials accounts for approximately 80% or more of the total weight in a fixed-effect meta-analysis.28 Funnel plots combined with Begg's and Egger's tests were performed to assess publication bias for the primary outcomes if 10 or more studies were included. Considering the multiple outcomes reported, we assessed the primary outcomes with statistical significance set at p<0.033, secondary outcomes at p<0.017, and tertiary outcomes at p<0.025.28
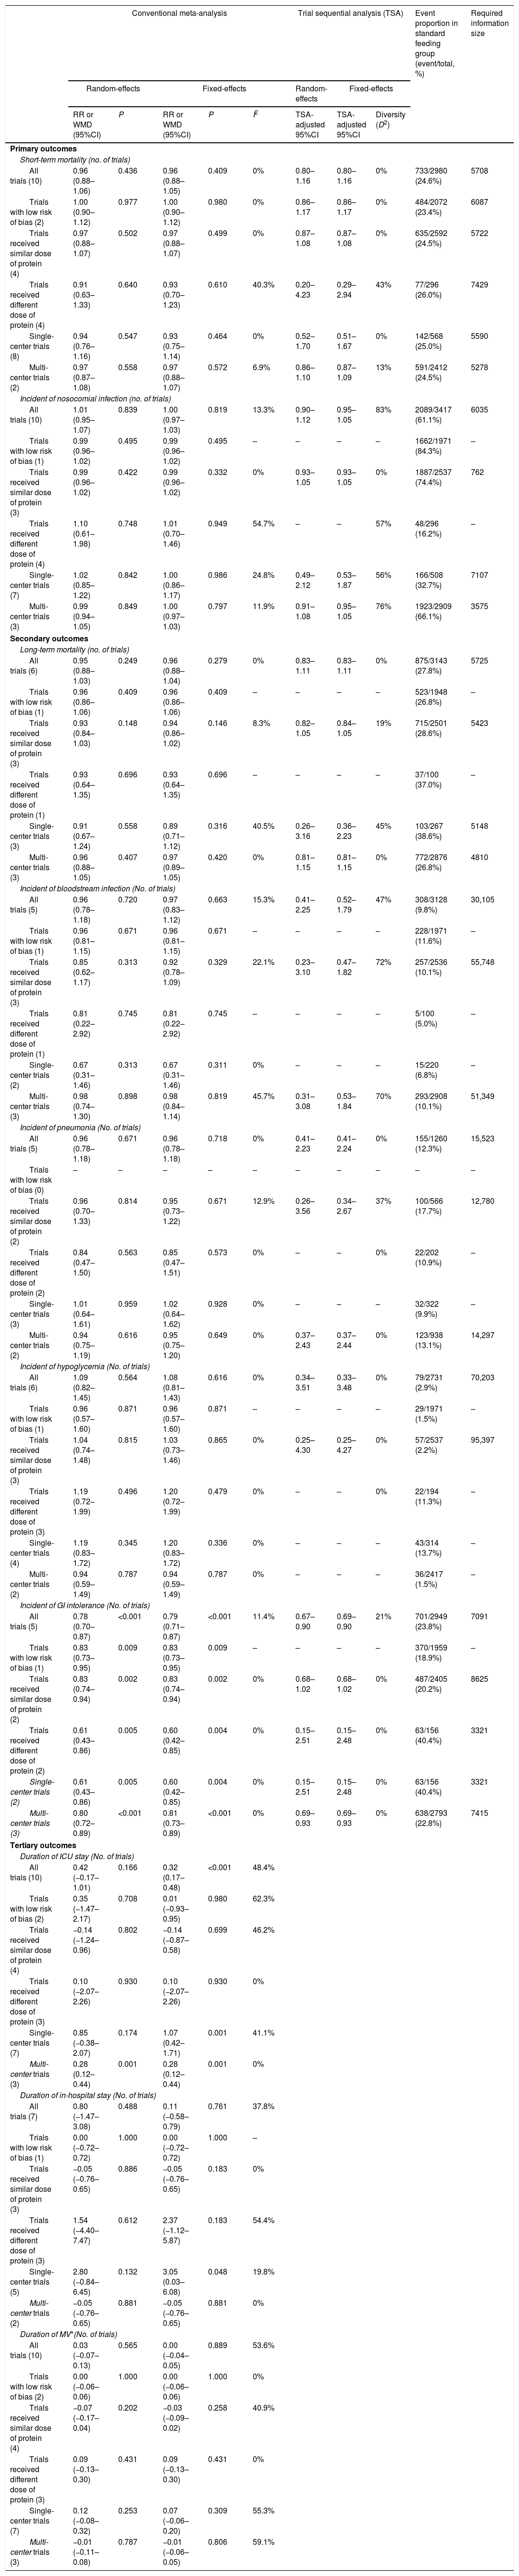
The conventional meta-analysis and trial sequential analysis for clinical outcomes using random-effect and fixed-effect model.
| Conventional meta-analysis | Trial sequential analysis (TSA) | Event proportion in standard feeding group (event/total, %) | Required information size | |||||||
|---|---|---|---|---|---|---|---|---|---|---|
| Random-effects | Fixed-effects | Random-effects | Fixed-effects | |||||||
| RR or WMD (95%CI) | P | RR or WMD (95%CI) | P | I2 | TSA-adjusted 95%CI | TSA-adjusted 95%CI | Diversity (D2) | |||
| Primary outcomes | ||||||||||
| Short-term mortality (no. of trials) | ||||||||||
| All trials (10) | 0.96 (0.88–1.06) | 0.436 | 0.96 (0.88–1.05) | 0.409 | 0% | 0.80–1.16 | 0.80–1.16 | 0% | 733/2980 (24.6%) | 5708 |
| Trials with low risk of bias (2) | 1.00 (0.90–1.12) | 0.977 | 1.00 (0.90–1.12) | 0.980 | 0% | 0.86–1.17 | 0.86–1.17 | 0% | 484/2072 (23.4%) | 6087 |
| Trials received similar dose of protein (4) | 0.97 (0.88–1.07) | 0.502 | 0.97 (0.88–1.07) | 0.499 | 0% | 0.87–1.08 | 0.87–1.08 | 0% | 635/2592 (24.5%) | 5722 |
| Trials received different dose of protein (4) | 0.91 (0.63–1.33) | 0.640 | 0.93 (0.70–1.23) | 0.610 | 40.3% | 0.20–4.23 | 0.29–2.94 | 43% | 77/296 (26.0%) | 7429 |
| Single-center trials (8) | 0.94 (0.76–1.16) | 0.547 | 0.93 (0.75–1.14) | 0.464 | 0% | 0.52–1.70 | 0.51–1.67 | 0% | 142/568 (25.0%) | 5590 |
| Multi-center trials (2) | 0.97 (0.87–1.08) | 0.558 | 0.97 (0.88–1.07) | 0.572 | 6.9% | 0.86–1.10 | 0.87–1.09 | 13% | 591/2412 (24.5%) | 5278 |
| Incident of nosocomial infection (no. of trials) | ||||||||||
| All trials (10) | 1.01 (0.95–1.07) | 0.839 | 1.00 (0.97–1.03) | 0.819 | 13.3% | 0.90–1.12 | 0.95–1.05 | 83% | 2089/3417 (61.1%) | 6035 |
| Trials with low risk of bias (1) | 0.99 (0.96–1.02) | 0.495 | 0.99 (0.96–1.02) | 0.495 | – | – | – | – | 1662/1971 (84.3%) | – |
| Trials received similar dose of protein (3) | 0.99 (0.96–1.02) | 0.422 | 0.99 (0.96–1.02) | 0.332 | 0% | 0.93–1.05 | 0.93–1.05 | 0% | 1887/2537 (74.4%) | 762 |
| Trials received different dose of protein (4) | 1.10 (0.61–1.98) | 0.748 | 1.01 (0.70–1.46) | 0.949 | 54.7% | – | – | 57% | 48/296 (16.2%) | – |
| Single-center trials (7) | 1.02 (0.85–1.22) | 0.842 | 1.00 (0.86–1.17) | 0.986 | 24.8% | 0.49–2.12 | 0.53–1.87 | 56% | 166/508 (32.7%) | 7107 |
| Multi-center trials (3) | 0.99 (0.94–1.05) | 0.849 | 1.00 (0.97–1.03) | 0.797 | 11.9% | 0.91–1.08 | 0.95–1.05 | 76% | 1923/2909 (66.1%) | 3575 |
| Secondary outcomes | ||||||||||
| Long-term mortality (no. of trials) | ||||||||||
| All trials (6) | 0.95 (0.88–1.03) | 0.249 | 0.96 (0.88–1.04) | 0.279 | 0% | 0.83–1.11 | 0.83–1.11 | 0% | 875/3143 (27.8%) | 5725 |
| Trials with low risk of bias (1) | 0.96 (0.86–1.06) | 0.409 | 0.96 (0.86–1.06) | 0.409 | – | – | – | – | 523/1948 (26.8%) | – |
| Trials received similar dose of protein (3) | 0.93 (0.84–1.03) | 0.148 | 0.94 (0.86–1.02) | 0.146 | 8.3% | 0.82–1.05 | 0.84–1.05 | 19% | 715/2501 (28.6%) | 5423 |
| Trials received different dose of protein (1) | 0.93 (0.64–1.35) | 0.696 | 0.93 (0.64–1.35) | 0.696 | – | – | – | – | 37/100 (37.0%) | – |
| Single-center trials (3) | 0.91 (0.67–1.24) | 0.558 | 0.89 (0.71–1.12) | 0.316 | 40.5% | 0.26–3.16 | 0.36–2.23 | 45% | 103/267 (38.6%) | 5148 |
| Multi-center trials (3) | 0.96 (0.88–1.05) | 0.407 | 0.97 (0.89–1.05) | 0.420 | 0% | 0.81–1.15 | 0.81–1.15 | 0% | 772/2876 (26.8%) | 4810 |
| Incident of bloodstream infection (No. of trials) | ||||||||||
| All trials (5) | 0.96 (0.78–1.18) | 0.720 | 0.97 (0.83–1.12) | 0.663 | 15.3% | 0.41–2.25 | 0.52–1.79 | 47% | 308/3128 (9.8%) | 30,105 |
| Trials with low risk of bias (1) | 0.96 (0.81–1.15) | 0.671 | 0.96 (0.81–1.15) | 0.671 | – | – | – | – | 228/1971 (11.6%) | – |
| Trials received similar dose of protein (3) | 0.85 (0.62–1.17) | 0.313 | 0.92 (0.78–1.09) | 0.329 | 22.1% | 0.23–3.10 | 0.47–1.82 | 72% | 257/2536 (10.1%) | 55,748 |
| Trials received different dose of protein (1) | 0.81 (0.22–2.92) | 0.745 | 0.81 (0.22–2.92) | 0.745 | – | – | – | – | 5/100 (5.0%) | – |
| Single-center trials (2) | 0.67 (0.31–1.46) | 0.313 | 0.67 (0.31–1.46) | 0.311 | 0% | – | – | – | 15/220 (6.8%) | – |
| Multi-center trials (3) | 0.98 (0.74–1.30) | 0.898 | 0.98 (0.84–1.14) | 0.819 | 45.7% | 0.31–3.08 | 0.53–1.84 | 70% | 293/2908 (10.1%) | 51,349 |
| Incident of pneumonia (No. of trials) | ||||||||||
| All trials (5) | 0.96 (0.78–1.18) | 0.671 | 0.96 (0.78–1.18) | 0.718 | 0% | 0.41–2.23 | 0.41–2.24 | 0% | 155/1260 (12.3%) | 15,523 |
| Trials with low risk of bias (0) | – | – | – | – | – | – | – | – | – | – |
| Trials received similar dose of protein (2) | 0.96 (0.70–1.33) | 0.814 | 0.95 (0.73–1.22) | 0.671 | 12.9% | 0.26–3.56 | 0.34–2.67 | 37% | 100/566 (17.7%) | 12,780 |
| Trials received different dose of protein (2) | 0.84 (0.47–1.50) | 0.563 | 0.85 (0.47–1.51) | 0.573 | 0% | – | – | 0% | 22/202 (10.9%) | – |
| Single-center trials (3) | 1.01 (0.64–1.61) | 0.959 | 1.02 (0.64–1.62) | 0.928 | 0% | – | – | – | 32/322 (9.9%) | – |
| Multi-center trials (2) | 0.94 (0.75–1.19) | 0.616 | 0.95 (0.75–1.20) | 0.649 | 0% | 0.37–2.43 | 0.37–2.44 | 0% | 123/938 (13.1%) | 14,297 |
| Incident of hypoglycemia (No. of trials) | ||||||||||
| All trials (6) | 1.09 (0.82–1.45) | 0.564 | 1.08 (0.81–1.43) | 0.616 | 0% | 0.34–3.51 | 0.33–3.48 | 0% | 79/2731 (2.9%) | 70,203 |
| Trials with low risk of bias (1) | 0.96 (0.57–1.60) | 0.871 | 0.96 (0.57–1.60) | 0.871 | – | – | – | – | 29/1971 (1.5%) | – |
| Trials received similar dose of protein (3) | 1.04 (0.74–1.48) | 0.815 | 1.03 (0.73–1.46) | 0.865 | 0% | 0.25–4.30 | 0.25–4.27 | 0% | 57/2537 (2.2%) | 95,397 |
| Trials received different dose of protein (3) | 1.19 (0.72–1.99) | 0.496 | 1.20 (0.72–1.99) | 0.479 | 0% | – | – | 0% | 22/194 (11.3%) | – |
| Single-center trials (4) | 1.19 (0.83–1.72) | 0.345 | 1.20 (0.83–1.72) | 0.336 | 0% | – | – | – | 43/314 (13.7%) | – |
| Multi-center trials (2) | 0.94 (0.59–1.49) | 0.787 | 0.94 (0.59–1.49) | 0.787 | 0% | – | – | – | 36/2417 (1.5%) | – |
| Incident of GI intolerance (No. of trials) | ||||||||||
| All trials (5) | 0.78 (0.70–0.87) | <0.001 | 0.79 (0.71–0.87) | <0.001 | 11.4% | 0.67–0.90 | 0.69–0.90 | 21% | 701/2949 (23.8%) | 7091 |
| Trials with low risk of bias (1) | 0.83 (0.73–0.95) | 0.009 | 0.83 (0.73–0.95) | 0.009 | – | – | – | – | 370/1959 (18.9%) | – |
| Trials received similar dose of protein (2) | 0.83 (0.74–0.94) | 0.002 | 0.83 (0.74–0.94) | 0.002 | 0% | 0.68–1.02 | 0.68–1.02 | 0% | 487/2405 (20.2%) | 8625 |
| Trials received different dose of protein (2) | 0.61 (0.43–0.86) | 0.005 | 0.60 (0.42–0.85) | 0.004 | 0% | 0.15–2.51 | 0.15–2.48 | 0% | 63/156 (40.4%) | 3321 |
| Single-center trials (2) | 0.61 (0.43–0.86) | 0.005 | 0.60 (0.42–0.85) | 0.004 | 0% | 0.15–2.51 | 0.15–2.48 | 0% | 63/156 (40.4%) | 3321 |
| Multi-center trials (3) | 0.80 (0.72–0.89) | <0.001 | 0.81 (0.73–0.89) | <0.001 | 0% | 0.69–0.93 | 0.69–0.93 | 0% | 638/2793 (22.8%) | 7415 |
| Tertiary outcomes | ||||||||||
| Duration of ICU stay (No. of trials) | ||||||||||
| All trials (10) | 0.42 (−0.17–1.01) | 0.166 | 0.32 (0.17–0.48) | <0.001 | 48.4% | |||||
| Trials with low risk of bias (2) | 0.35 (−1.47–2.17) | 0.708 | 0.01 (−0.93–0.95) | 0.980 | 62.3% | |||||
| Trials received similar dose of protein (4) | −0.14 (−1.24–0.96) | 0.802 | −0.14 (−0.87–0.58) | 0.699 | 46.2% | |||||
| Trials received different dose of protein (3) | 0.10 (−2.07–2.26) | 0.930 | 0.10 (−2.07–2.26) | 0.930 | 0% | |||||
| Single-center trials (7) | 0.85 (−0.38–2.07) | 0.174 | 1.07 (0.42–1.71) | 0.001 | 41.1% | |||||
| Multi-center trials (3) | 0.28 (0.12–0.44) | 0.001 | 0.28 (0.12–0.44) | 0.001 | 0% | |||||
| Duration of in-hospital stay (No. of trials) | ||||||||||
| All trials (7) | 0.80 (−1.47–3.08) | 0.488 | 0.11 (−0.58–0.79) | 0.761 | 37.8% | |||||
| Trials with low risk of bias (1) | 0.00 (−0.72–0.72) | 1.000 | 0.00 (−0.72–0.72) | 1.000 | – | |||||
| Trials received similar dose of protein (3) | −0.05 (−0.76–0.65) | 0.886 | −0.05 (−0.76–0.65) | 0.183 | 0% | |||||
| Trials received different dose of protein (3) | 1.54 (−4.40–7.47) | 0.612 | 2.37 (−1.12–5.87) | 0.183 | 54.4% | |||||
| Single-center trials (5) | 2.80 (−0.84–6.45) | 0.132 | 3.05 (0.03–6.08) | 0.048 | 19.8% | |||||
| Multi-center trials (2) | −0.05 (−0.76–0.65) | 0.881 | −0.05 (−0.76–0.65) | 0.881 | 0% | |||||
| Duration of MV*(No. of trials) | ||||||||||
| All trials (10) | 0.03 (−0.07–0.13) | 0.565 | 0.00 (−0.04–0.05) | 0.889 | 53.6% | |||||
| Trials with low risk of bias (2) | 0.00 (−0.06–0.06) | 1.000 | 0.00 (−0.06–0.06) | 1.000 | 0% | |||||
| Trials received similar dose of protein (4) | −0.07 (−0.17–0.04) | 0.202 | −0.03 (−0.09–0.02) | 0.258 | 40.9% | |||||
| Trials received different dose of protein (3) | 0.09 (−0.13–0.30) | 0.431 | 0.09 (−0.13–0.30) | 0.431 | 0% | |||||
| Single-center trials (7) | 0.12 (−0.08–0.32) | 0.253 | 0.07 (−0.06–0.20) | 0.309 | 55.3% | |||||
| Multi-center trials (3) | −0.01 (−0.11–0.08) | 0.787 | −0.01 (−0.06–0.05) | 0.806 | 59.1% | |||||
ICU, intensive care unit; MV, mechanical ventilation; GI, gastrointestinal; BMI, body mass index; APACHE, acute physiology and chronic health evaluation; TSA, trial sequential analysis; WMD, weighted mean difference; SMD, standardized mean difference; RR, relative risk; CI, confidence interval.
The pooled data of duration of MV is presented as mean SMD and 95% CI because the unit of the data is different between included trials.
“–” means unavailable data due to too little information used.
TSA was conducted with an adjusted type I error of 3.3% for the primary outcomes and 1.7% for the secondary outcomes, power of 80%, D2 suggested by the included trials, relative risk reduction of 15%, two-tailed. If the actual measured D2 was zero, a D2 of 20% was used, because in this case heterogeneity would most likely increase when further studies are included.
Subgroup analyses were also conducted for all outcomes based on the following factors: (1) the overall risk of bias of included studies (low or high risk of bias); (2) whether the dose of protein intake between the two groups was similar or different (statistically significant or if the difference was ≥10%); (3) the design type of study (single-center or multi-center).
Trial sequential analysisWe conducted trial sequential analysis (TSA) using TSA program version 0.9.5.10 beta (available from www.ctu.dk/tsa) for the primary and secondary outcomes (Table 1) to assess the increased risk of random errors due to sparsity data and repeated significance testing in cumulative meta-analyses.29 Both random-effects and fixed-effects models were used to calculate the TSA-adjusted 95% CI for heterogeneity [Diversity (D2) adjustment], the random-effects result was reported as the main result.
Because the overall risk of falsely rejecting the null hypothesis (the family-wise error rate) will increase when performing multiple hypothesis tests,28 we calculated the TSA-adjusted 95% CI with a family-wise error rate of 5% with a statistical significance level of 3.3% for the anticipated two co-primary outcomes and 1.7% for each of the five co-secondary outcomes, a beta (power) of 80%, and a D230 suggested by the included trials. If the actual measured D2 was zero, a D2 of 20% was used because the heterogeneity may be expected to increase when further studies are included.31 The required information size was calculated based on a relative risk reduction of 15% in the event proportion of control group calculated from the conventional meta-analysis.
Grading the quality of evidenceAccording to the Grading of Recommendations Assessment, Development, and Evaluation (GRADE) approach,32 we assessed the overall quality of evidence for each outcome measure using GRADE profiler version 3.6 and presented the summary of findings in Table 2. The quality of evidence and our confidence in the effect-estimates were evaluated on the following six elements: study design, risk of bias, inconsistency, indirectness, inprecision, and risk of publication bias. Accordingly, we assigned a value of “high”, “moderate”, “low” or “very low” to each outcome to classify the quality of evidence.
ResultsStudy selection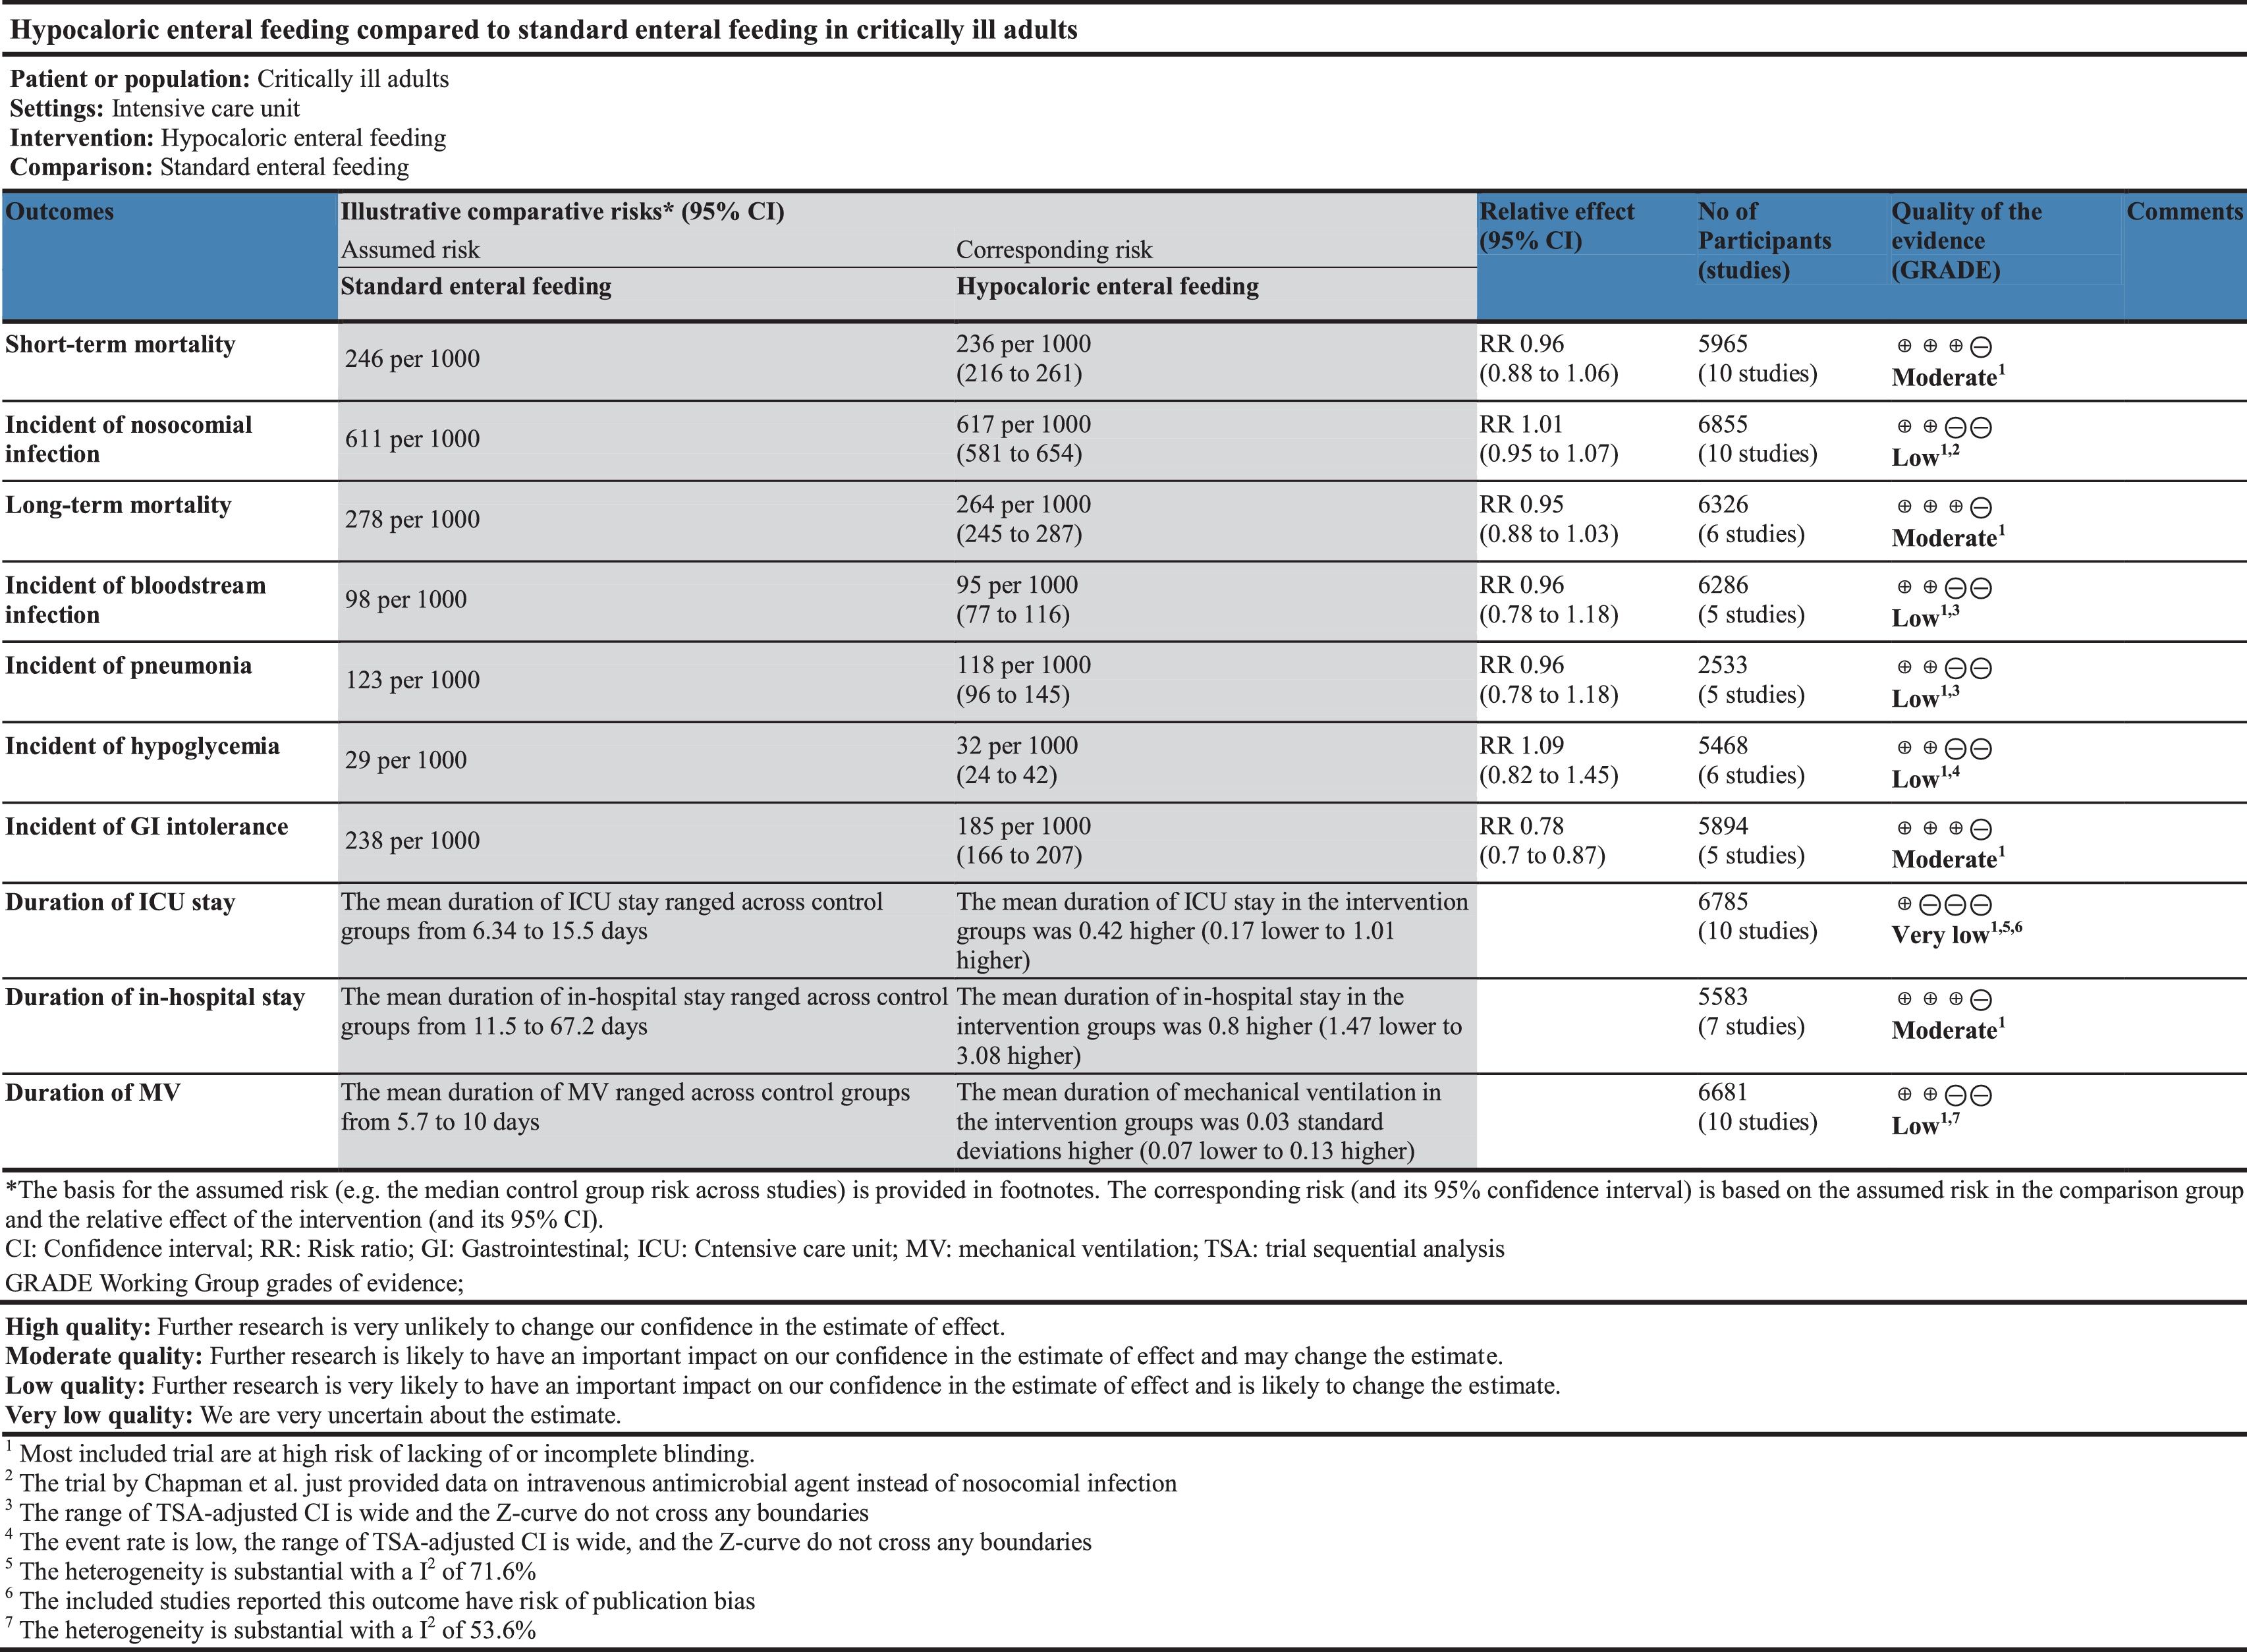
The database search was completed on March 16, 2019. We searched a total of 5918 records from the abovementioned database, of which 1256 duplicate were filtered, and 4425 records deemed ineligible were also excluded after screening the title and abstract according to our inclusion and exclusion criteria. The remaining 237 records and additional 32 records retrieved from other review articles were included in the review of the full text. Finally, a total of 11 RCTs8–13,23–25,33,34 enrolled 6986 subjects met the eligibility criteria and were included in analysis. The flowchart of study selection is shown in Fig. 1 and the reasons for exclusion of studies are presented in the supplementary material (Table S1).
Characteristics of included studies
Among the included RCTs,8–13,23–25,33,34 all were published from 2011 to 2018, two9,25 were published in Chinese and the remainder were in English, three8,12,24 were multi-center and the others were single-center.9–11,13,23,25,33,34 The number of subjects enrolled were largely different between included trials and varied from 78 to 3957. The subjects in all trials were critically ill patients admitted to medical ICU, surgical ICU, or both, however, the primary diagnosis led to ICU admission were diverse. The subjects in all trials received EN as the main nutrition supply, other nutrition regimen, including PN, were also indicated if need. Among the included trials, eight studies8–13,25,33 directly compared two different dose of caloric intake, yet the remaining three trials23,24,34 did not. The aim of the trial by Allingstrup et al.23 was to assess the effectiveness of early goal-directed nutrition as compared to standard nutrition care, the trial by Braunschweig et al.34 was to assess the effectiveness of intensive medical nutrition therapy as compared to standard nutrition therapy, and the trial by Chapman et al.24 was to assess the effectiveness of two different energy-dense enteral nutrition in critically ill patients. Although, the interventions in the three studies resulted in a dose difference in daily caloric intake which met our criteria, hence we also included the three trials in this meta-analysis. The proportion of daily caloric intake to goal caloric requirements in hypocaloric feeding group ranged from 15% to 69%, and in standard feeding group were from 71% to 103%. The dose of protein intake was largely diverse between trials and between groups, four trials8,13,24,33 received a similar dose of protein intake and four trials10,11,23,34 received a significantly different dose of protein intake between the two groups, the others9,12,25 did not reported data on protein intake. The detailed characteristics and clinical outcomes of the individual studies are described in the supplementary material (Tables S2 and S3).
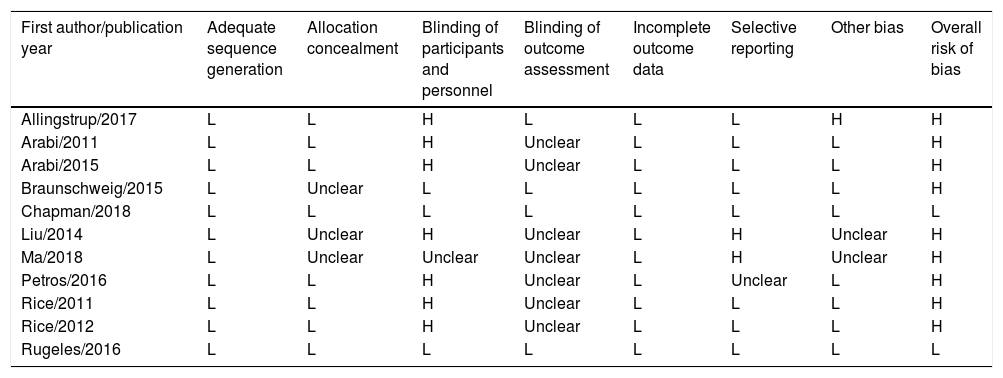
Risk of bias assessmentThe details of the overall risk of bias of individual trials are summarized in Table 3. Summarily, two studies13,24 had a low risk of bias in all domains and are adjudicated as an overall low risk of bias, and the remaining studies8–12,23,25,33,34 were deemed as an overall high risk of bias due to at least one domain with an unclear or high risk of bias.
Assessment of the overall risk of bias of each included trials.
| First author/publication year | Adequate sequence generation | Allocation concealment | Blinding of participants and personnel | Blinding of outcome assessment | Incomplete outcome data | Selective reporting | Other bias | Overall risk of bias |
|---|---|---|---|---|---|---|---|---|
| Allingstrup/2017 | L | L | H | L | L | L | H | H |
| Arabi/2011 | L | L | H | Unclear | L | L | L | H |
| Arabi/2015 | L | L | H | Unclear | L | L | L | H |
| Braunschweig/2015 | L | Unclear | L | L | L | L | L | H |
| Chapman/2018 | L | L | L | L | L | L | L | L |
| Liu/2014 | L | Unclear | H | Unclear | L | H | Unclear | H |
| Ma/2018 | L | Unclear | Unclear | Unclear | L | H | Unclear | H |
| Petros/2016 | L | L | H | Unclear | L | Unclear | L | H |
| Rice/2011 | L | L | H | Unclear | L | L | L | H |
| Rice/2012 | L | L | H | Unclear | L | L | L | H |
| Rugeles/2016 | L | L | L | L | L | L | L | L |
L, low; H, high.
There are 10 studies8–11,13,23–25,33,34 including 5965 participants provided data on short-term mortality. The pooled results demonstrated that hypocaloric enteral feeding have no effects on the short-term mortality (RR=0.96, 95% CI: 0.88–1.06; TSA-adjusted 95% CI: 0.80–1.16) as compared to standard feeding (Fig. 2), and the Z-curve crossed the boundary for futility and reached the required information size of 5708 patients (Fig. 3A), which indicated that future studies are unlikely to detect a 15% relative risk reduction in short-term mortality, this results were unchanged in sub-analysis of trials with low risk of bias13,24 (Figs. 2A and 3B), trials received similar dose of protein8,13,24,33 (Figs. 2B and 4A) and multi-center trials8,24 (Figs. S1 and S2B in the supplementary material). Sub-analysis of trials received different dose of protein10,11,23,34 and single-center trials9–11,13,23,25,33,34 also revealed no benefits on the short-term mortality (Fig. 2B and S1), while the Z-curve crossed no boundaries (Fig. 4B and S2A), it still needs more evidence to confirm.
 Sub-analysis of trials with low or high risk of bias; (panel B) Sub-analysis of trials received similar or different dose of protein. RR, relative risk.")
 In all included trials, control event proportion of 24.6%, D2 of 20% (the actual measured D2 was 0%). The cumulative Z-curve cross the futility area and reach the required information size of 5708 participants. The TSA-adjusted 95% CI for an RR of 0.96 is 0.80–1.16. (Panel B) In trials with low risk of bias, control event proportion of 23.4%, D2 of 20% (the actual measured D2 was 0%), the cumulative Z-curve cross the futility area, but do not reach the required information size of 6087 participants. The TSA-adjusted 95% CI for an RR of 1.00 is 0.86–1.17. RR, relative risk; TSA, trial sequential analysis.")
Trial sequential analysis for the short-term mortality. Trial sequential analysis using random-effects model with an adjusted family-wise error rate of 3.3%, power of 80%, for a relative risk reduction of 15% in control event proportion. (Panel A) In all included trials, control event proportion of 24.6%, D2 of 20% (the actual measured D2 was 0%). The cumulative Z-curve cross the futility area and reach the required information size of 5708 participants. The TSA-adjusted 95% CI for an RR of 0.96 is 0.80–1.16. (Panel B) In trials with low risk of bias, control event proportion of 23.4%, D2 of 20% (the actual measured D2 was 0%), the cumulative Z-curve cross the futility area, but do not reach the required information size of 6087 participants. The TSA-adjusted 95% CI for an RR of 1.00 is 0.86–1.17. RR, relative risk; TSA, trial sequential analysis.
 In trials received similar dose of protein, control event proportion of 24.5%, D2 of 20% (the actual measured D2 was 0%). The cumulative Z-curve cross the futility area, but do not reach the required information size of 5722 participants. The TSA-adjusted 95% CI for an RR of 0.97 is 0.87–1.08. (Panel B) In trials received different dose of protein, control event proportion of 26.0%, D2 of 43%, the cumulative Z-curve cross no boundaries. The TSA-adjusted 95% CI for an RR of 0.91 is 0.20–4.23. RR, relative risk; TSA, trial sequential analysis.")
Trial sequential analysis for the short-term mortality in trials received similar or different dose of protein. Trial sequential analysis using random-effects model with an adjusted family-wise error rate of 3.3%, power of 80%, for a relative risk reduction of 15% in control event proportion. (Panel A) In trials received similar dose of protein, control event proportion of 24.5%, D2 of 20% (the actual measured D2 was 0%). The cumulative Z-curve cross the futility area, but do not reach the required information size of 5722 participants. The TSA-adjusted 95% CI for an RR of 0.97 is 0.87–1.08. (Panel B) In trials received different dose of protein, control event proportion of 26.0%, D2 of 43%, the cumulative Z-curve cross no boundaries. The TSA-adjusted 95% CI for an RR of 0.91 is 0.20–4.23. RR, relative risk; TSA, trial sequential analysis.
There are 10 trials8–12,23–25,33,34 consisting of 6855 participants presented data on incident of nosocomial infection, all but one24 were judged as have high risk of bias. Overall, we found no difference in the incident of nosocomial infection between the hypocaloric feeding and standard feeding group, with an RR of 1.01 (95% CI: 0.95–1.07, I2=13.3%) (Fig. 5) and TSA-adjusted 95% CI of 0.90–1.12 (D2=83%), meanwhile, the Z-curve reached the required information size (Fig. 6A), indicating sufficient evidence to reject a relative risk reduction of 15% in nosocomial infection. A similar results was found in sub-analysis of trials received similar dose of protein8,24,33 (Figs. 5 and 6B), trials received different dose of protein10,11,23,34 (Fig. 5), single-center trials9–11,23,25,33,34 and multi-center trials8,12,24 (Figs. S3 and S4).

 In all included trials, control event proportion of 61.1%, D2 of 83%. The cumulative Z-curve cross the futility area and reach the required information size of 6035 participants. The TSA-adjusted 95% CI for an RR of 1.01 is 0.90–1.12. (Panel B) In trials received similar dose of protein, control event proportion of 74.4%, D2 of 20% (the actual measured D2 was 0%), the cumulative Z-curve cross the futility area and reach the required information size of 762 participants. The TSA-adjusted 95% CI for an RR of 0.99 is 0.93–1.05. RR, relative risk; TSA, trial sequential analysis.")
Trial sequential analysis for the incident of nosocomial infection. Trial sequential analysis using random-effects model with an adjusted family-wise error rate of 3.3%, power of 80%, for a relative risk reduction of 15% in control event proportion. (Panel A) In all included trials, control event proportion of 61.1%, D2 of 83%. The cumulative Z-curve cross the futility area and reach the required information size of 6035 participants. The TSA-adjusted 95% CI for an RR of 1.01 is 0.90–1.12. (Panel B) In trials received similar dose of protein, control event proportion of 74.4%, D2 of 20% (the actual measured D2 was 0%), the cumulative Z-curve cross the futility area and reach the required information size of 762 participants. The TSA-adjusted 95% CI for an RR of 0.99 is 0.93–1.05. RR, relative risk; TSA, trial sequential analysis.
We evaluated the publication bias for the primary outcomes. All the funnel plots were visually symmetrical (Fig. S5). The Begg's and Egger's tests for the short-term mortality (P=0.474 and P=0.510, respectively) and the incident of nosocomial infection (P=0.474 and P=0.298, respectively) indicated no evidence of publication bias.
Analysis of the secondary outcomesLong-term mortalityRegarding the outcome measure of long-term mortality, six studies8,9,12,23,24,33 were included in meta-analysis, of which one24 was considered as high quality. We found no benefits in reducing the long-term mortality with use of hypocaloric feeding (RR=0.95, 95% CI: 0.88–1.03, I2=0%; TSA-adjusted 95% CI: 0.83–1.11) (Fig. S6), TSA suggested that the required information size of 5725 was exceed, regardless of whether the dose of protein intake between groups was similar8,24,33 or different23 and whether the study was single-center9,23,33 or multi-center8,12,24 (Fig. S7).
Incident of bloodstream infection, pneumonia, and hypoglycemiaThe incident of bloodstream infection was reported in five studies,8,12,23,24,33 the incident of pneumonia was in five studies,8,11,12,23,33 and the incident of hypoglycemia was in six.8,13,23,24,33,34 The cumulative meta-analyses demonstrated that hypocaloric feeding, when compared with standard feeding, had no effects on the incident of bloodstream infection (Figs. S8 and S9), pneumonia (Figs. S10 and S11), or hypoglycemia (Figs. S12 and S13), regardless of the trials quality, the design type of trials and whether the dose of protein intake between groups was similar or different. However, these results were not robust because no boundaries were crossed in the TSA for the three outcomes, indicated that these results could be changed when future trials were included.
Incident of GI intoleranceWe identified five studies8,10–12,24 reported data on the incident of GI intolerance, one24 trial had a low risk of bias. Hypocaloric feeding could result in a lower incident of GI intolerance compared to standard feeding (RR=0.78, 95% CI: 0.70–0.87, p<0.001, I2=11.4%) (Fig. S14), which was confirmed by TSA (TSA-adjusted 95% CI: 0.67–0.90, D2=21%) and the trial sequential monitoring boundary for benefit was crossed (Fig. S15), a similar results were found in the sub-analysis of multi-center trials.8,12,14 In the sub-analysis of trials received similar dose of protein8,24 and trials received different dose of protein10,11 and single-center trials,10,11 we also found a lower incident of GI intolerance in hypocaloric feeding group, however this benefits disappeared after adjustment with TSA (Fig. S15).
Analysis of the tertiary outcomesIn the meta-analyses of 10 trials8,9,11–13,23–25,33,34 involving the duration of ICU stay, 7 trials8,9,11,23,24,33,34 involving in-hospital stay, and 10 trials8–13,24,25,33,34 involving duration of MV, hypocaloric feeding was not superior to standard feeding in reducing the duration of MV (Fig. S16), ICU stay (Fig. S17), or in-hospital stay (Fig. S18). Furthermore, these results were not changed in sub-analysis of trials stratified based on the trials quality, the design type of trials and the dose of protein intake, however, hypocaloric feeding was associated with a longer ICU stay in sub-analysis of multi-center trials8,12,24 (Fig. S17C).
The quality of evidenceThe overall quality of evidence was evaluated for all outcomes, we presented the summary of findings and the reasons for downgrading the quality in Table 2.
DiscussionThis meta-analysis of RCTs with trial sequential analysis suggested a firm conclusion that hypocaloric enteral feeding compared with standard feeding could not reduce the short-term mortality, long-term mortality, or incident of nosocomial infection in critically ill patients, future studies aimed to detect a 15% relative risk reduction in the above indicators are futile. Additionally, hypocaloric enteral feeding had also no effects on the bloodstream infection, pneumonia, hypoglycemia, and the duration of MV, ICU stay, or in-hospital stay. However, hypocaloric enteral feeding was associated with a significantly lower incident of GI intolerance. The above results were unchanged in sub-analysis of trials received similar dose of protein or trials received different dose of protein, thus we can speculate that the difference of protein intake between groups might have no influence on the outcome effects of hypocaloric enteral feeding
Regarding the potential mechanisms for outcome benefits, EN can modulate the immune response and reduce the oxidative stress and infections by delivering with nutrients and limiting the bacterial translocation through maintenance of gut integrity,5–7,35,36 hence EN is encouraged to commence early within 24–48h of ICU admission.4,5,35,37 However, early EN is faced with a dilemma that delay in gastric emptying and incomplete nutrients absorption always occur in the acute phase of critical illness,38,39 which will happen more frequently when early EN is supplied with full calories. Furthermore, early full caloric feeding might blunt the autophagy, resulting in an inadequate clearance of damaged cells, reduced myofibre quality, and increased muscle weakness.35 Thus, provision of full caloric enteral nutrition in the early phase of critical illness might not result in anabolism, and its potential harms could counterbalance the desired benefits. Summarily, standard full caloric EN may be not physiological for patients in the early phase of critical illness. Over the past decades, numerous studies were conducted to investigate the optimal caloric dose required for critically ill patients, a consistent results were obtained from several meta-analyses of RCTs14–17,40,41 and indicated that hypocaloric feeding have no effects on the clinical outcomes in critically ill patients, our meta-analysis revealed a similar results, and we also found that hypocaloric feeding have benefits in reducing the incident of GI intolerance compared with standard feeding, which was similar with the results from the review by Tian et al.16 Additionally, our study revealed no benefits on bloodstream infection, pneumonia, or hypoglycemia. However, the systematic review by Al-Dorzi et al.40 suggested that lower caloric intake was associated with lower incident of blood stream infection, this study had a relatively less stringent inclusion criteria that included RCTs compared two different doses of EN without restrictions on the percentage of daily caloric dose to caloric requirement, it might contribute to these disparate results.
When compared with previous meta-analyses,14–17,40,41 some major differences regarding the methodology should be mentioned. With respect to the inclusion criteria, the study by Ridley et al.14 included RCTs that compared delivery of daily caloric intake of≥80% to<80% of predicted energy requirements. However, the ESPEN guidelines4 defined hypocaloric feeding as daily delivery of caloric intake<70% of energy expenditure. In addition, a retrospective cohort study found a significantly non-linear (U-shaped) relationship between the proportion of daily mean caloric dose to resting energy expenditure and 60-day mortality, the lowest mortality was located at the minimum point of the U-shaped curve, represented 70% of resting energy expenditure.42 Hence, we set 70% as the critical value to make a distinction between hypocaloric feeding and standard feeding. Regarding the subgroup analysis, the influence of protein intake on the estimated effects of hypocaloric feeding was explored. In recent, the interdependence between energy and protein has been highlighted,43,44 there are several studies demonstrated that delivery of higher protein are more effective than higher calorie in reducing mortality in critically ill patients,21,45 we hypothesize that the dose of protein intake could affect the effectiveness of hypocaloric feeding on clinical outcomes. However, our study did not find any association between the dose of protein intake and the outcome effects of hypocaloric feeding, suggesting no influence of protein dose on the effects of caloric intake on clinical outcomes, the systematic review by Davies et al.46 also demonstrated that delivery of varying amounts of protein was not associated with any effect on mortality. This negative findings mighty attribute to the different nutritional risk of enrolled patients in included RTCs. A observational study47 also found that greater protein and energy intake are associated with a lower mortality in nutritionally high-risk patients but not in nutritionally low-risk patients. However, most RCTs included in this meta-analysis did not report data on the nutritional risk, thus the relationship of protein intake and caloric intake in term of improvement of outcomes still needs high quality randomized trials to confirm.
This meta-analysis has several strengths. Firstly, more participants were included in this meta-analysis. Our study identified a total of 11 RCTs and included nearly 7000 subjects, the number of participants are twice as much as that of previous meta-analyses.14–17,40,41 Therefore, this meta-analysis with a larger sample size would decrease, at least in part, the sampling errors and selective bias, and reveal the effects of daily caloric dose on prognosis more objectively. Secondly, different from the previous reviews,14–17,40,41 trial sequential analysis was conducted in this study to prevent the increased risk of random errors resulted from repeated significance testing and sparsity data in cumulative meta-analyses and calculate the required information size. Meanwhile, the thresholds of significance were adjusted based on the number of outcomes because of the increased family-wise error rate derived from multiple hypothesis tests, this is another methodological strength in our study. Finally, we assessed and rated the overall quality of evidence for all outcomes according to the GRADE approach, this approach could provide a compelling guidance for the clinician to determine the credibility of our evidence.
Nevertheless, there are also several limitations in this study. First, the potential clinical heterogeneity is a challenge for making the firm conclusion about the effect of hypocaloric feeding on outcomes. We noticed that the potential clinical heterogeneity might be substantial in consideration of the different enteral nutrition formulas, different energy measure method, or different route of enteral nutrition delivery between included trials. However, it is hard to conduct a subgroup analysis based on the abovementioned factors due to the limited information on these factors in included trials. Second, we did not conduct TSA for the tertiary outcomes, and a significant heterogeneity in the analysis of tertiary outcomes was observed, hence, the pooled results of conventional meta-analyses for the tertiary outcomes should be interpreted carefully. Additionally, there is a big difference in the number of subjects between included trials, the possible overestimation of effect size in studies with a small sample size should be considered when interpreting the results. Lastly, a potential overlaps of daily caloric dose exists between the hypocaloric and standard feeding group. It is noteworthy that the methods used to measure the goal caloric requirements, including indirect calorimetry,9,10,23 fixed prescription (e.g. 25–30kcal/kg/day),11–13,24,34 Schofield equoration,24 and Harris–Benedict equation,8,33 were largely different between the included trials, it is likely that the predictive equations will underestimated or overestimated the actual caloric requirements measured by the indirect calorimetry.48 Given the small gap in the proportion of daily caloric intake to goal caloric requirements between the hypocaloric and standard feeding group (15–69% in the hypocaloric group, 71–103% in the standard group), the different measure method might result in a potential overlaps of daily caloric dose between groups, which should also be considered in interpretation of the results.
ConclusionHypocaloric enteral feeding was not superior to standard enteral feeding in improving clinical outcomes in critically ill patients. Considering its beneficial effects on GI intolerance without increased risk of hypoglycemia, hypocaloric enteral feeding may be more suitable for critically ill patients in the early phase of critical illness. In addition, we can speculate that the difference of protein intake between hypocaloric feeding group and standard feeding group might have no influence on the outcome effects of hypocaloric enteral feeding, but it still needs more high quality trials to confirm.
Authors’ contributionsXiaoyang Zhou designed the study, performed the literature search and data analysis, and drafted the manuscript. Zhaojun Xu and Caibao Hu participated in the conception and design of the study, performed the quality assessment and helped to revise the manuscript. Hanyuan Fang performed the literature search and drafted the manuscript. Jianfei Xu and Hua Wang performed the study selection and statistical analysis and helped to draft the manuscript. Jianneng Pan and Yuyi Sha performed the data extraction and analysis, modified the language. All the authors have read and approved the final manuscript.
Funding statementThis work was supported by the grants from Zhejiang Medicine and Health Sciences Research Fund (No. 2019KY184). The funders had no role in the study design, data collection, and analysis, decision to publish, or preparation of the manuscript.
Conflicts of interestNone.
The following are the supplementary data to this article:

