


The relationship between fluid overload and clinical outcomes was investigated.
DesignThis study is an observational and analytic study of a retrospective cohort.
SettingsPediatric intensive care units.
Patients or participantsBetween 2019 and 2021 children who needed intensive care were included in the study.
InterventionsNo intervention.
Main variable of interestEarly, peak and cumulative fluid overload were evaluated.
ResultsThe mortality rate was 11.7% (68/513). When fluid overloads were examined in terms of mortality, the percentage of early fluid overload was 1.86 and 3.35, the percent of peak fluid overload was 2.87 and 5.54, and the percent of cumulative fluid overload was 3.40 and 8.16, respectively, in the survivor and the non-survivor groups. After adjustment for age, severity of illness, and other potential confounders, peak (aOR = 1.15; 95%CI 1.05−1.26; p: 0.002) and cumulative (aOR = 1.10; 95%CI 1.04−1.16; p < 0.001) fluid overloads were determined as independent risk factors associated with mortality. When the cumulative fluid overload is 10% or more, a 3.9-fold increase mortality rate was calculated. It is found that the peak and cumulative fluid overload, had significant negative correlation with intensive care unit free days and ventilator free days.
ConclusionsIt is found that peak and cumulative fluid overload in critically ill children were independently associated with intensive care unit mortality and morbidity.
Relación entre la sobrecarga de fluidos y el resultado clínico en niños ingresado en una UCI pediátrica.
DiseñoEstudio observacional y analítico de una cohorte retrospectiva.
ÁmbitoUnidad de cuidados intensivos pediátricos (PICU)
PacientesEntre 2019 y 2021, se incluyeron en el estudio 581 pacientes ingresados en PICU
IntervencionesNinguna.
Variables de interés principalsSe evaluaron la sobrecarga de fluidos precoz, pico y acumulada.
ResultadosLa tasa de mortalidad fue del 11,7% (68/513). Cuando se examinó la sobrecarga de fluidos (litros) en relación con la mortalidad, la sobrecarga precoz fue de 1,86 y 3,35, máxima de 2,87 y 5,54, y acumulada fue de 3,40 y 8,16, en supervivientes y no-supervivientes, respectivamente. Después del ajuste por edad, gravedad de la enfermedad y otros factores de confusión, se calculó el líquido máximo (aOR = 1,15; IC95% 1,05−1,26; p:0,002) y acumulado (aOR = 1,10; IC 95% 1,04−1,16; p < 0,001) como factores de riesgo independientes asociados con la mortalidad. La sobrecarga acumulada de fluidos ≥10%, se asoció con un incremento de 3,9 de la mortalidad. Las sobrecargas de fluidos máxima y acumulada tuvieron una correlación negativa significativa con días libres de permanencia en PICU, días libres de ventilación mecánica.
ConclusionesEn este estudio retrospectivo, las sobrecargas máxima y acumulativa de líquidos en niños críticamente enfermos se asoció de forma independiente con la mortalidad y morbilidad de la unidad de cuidados intensivos.
Intravenous fluid administration is a fundamental therapy in order to restore effective blood volume and maintain organ perfusion during shock state resuscitation in critical care. However, possible negative effects of aggressive intravenous fluid therapy have been studied more in recent years. In particular, the FEAST study which was conducted in low-resource settings in Africa of the management of children with febrile illness and signs of impaired perfusion concluded that fluid boluses were potentially harmful to children with signs of circulatory impairment including shock and reminded us to be more cautious during fluid resuscitation.1 In a meta-analysis, a total of 3200 patients were examined in 11 studies concluded that 6% increase in odds of mortality for every 1% increase in percentage fluid overload.2 Although there are too many studies on the adverse outcomes and fluid accumulation such as in children requiring renal replacement therapy (RRT),3–6 ECMO,7 in children undergoing cardiac surgery,8–10 in children diagnosed with acute lung injury (ALI11–13 and sepsis14 which are common pathologies in critical ill children, the number of studies researching fluid accumulation and negative effects in the general pediatric intensive care unit (PICU) population is limited.15–20
The aim of this study was to evaluate the association of fluid overload (FO) and morbi-mortality in a general PICU population.
Patients and methodsStudy population and data collectionThis study is an observational and analytic study of a retrospective cohort. Patients who were followed up in Akdeniz University (Türkiye) Pediatric Intensive Care Unit between January 2019 and September 2021 were included in the study. All children older than 1 month and younger than 18 years of age, who needed intensive care and survived at the end of the first 24 h for surgical and medical purposes were included in the study. The exclusion criteria were patients whose length of stay in the PICU less than 24 h,20,21 patients with deficiencies in their data in the registry system, chronic kidney failure patients and those who were admitted to the intensive care unit due to kidney transplantation. The informed consent form was obtained from both the children themselves and their parents if adequate communication could be established, and if communication could not be established, it was obtained from the parents of the children. The study was approved by the Akdeniz University clinical studies ethics committee, and was conducted in accordance with the terms specified in the Declaration of Helsinki.
Daily fluid data was obtained for each patient during the study period. Clinical, demographic, diagnosis-related and laboratory data also collected through the first 24 h after ICU admission from electronic medical records. The total follow-up period of the study patients was 28 days or upon discharge from the PICU.
Fluid assesmentTotal of fluid inputs and outputs were measured daily to quantify fluid overload. Total daily input was calculated as the sum of all oral and intravenous fluids administered to the patient including maintenance fluids, blood products, medications and nutritional support. Total daily output was calculated as the sum of all output volumes including urine, stool, drain output, gastrointestinal aspirates and fluid removal by renal replacement therapies. Urine output was calculated by measuring the urine volume if the patient had a urethral catheter and by weighing disposable diapers if the patient did not. For standardisation, net fluid calculations were done based on 8 am every day. Insensible losses were not taken into calculations. Daily fluid accumulation = [net daily input (L)—net daily output (L)]/PICU admission weight (Kg) × 100.22 Bhaskar et al. found that in their cohort, both survivors and non-survivors, fluid accumulation peaked on the second day, therefore we recorded the data of our patients for 3 days.19 The term 'early fluid overload' was defined for the fluid accumulation occuring during the first 24 h of admission to PICU.23 The term 'peak fluid overload' was defined for the highest daily fluid accumulation on any day of the first 3 days.15 The term 'cumulative fluid overload' was defined for the total net fluid accumulation of the first 3 days. Daily maintenance fluid requirement was determined according to the body surface area of the patients. The decision to restrict the amount of daily fluid intake or replace ongoing losses was made by the medical team.
Assesment of illness severityThe illness severity was evaluated by the PRISM IV,24 PELOD II score,25 which were previously defined in the original studies. Physiologic variables were measured only in the first 4 h of PICU care and laboratory variables were measured in the time period from 2 h before PICU admission through the first 4 h.
Definitions and diagnostic criteriasInternational pediatric sepsis consensus conference: definitions for sepsis and organ dysfunction in pediatrics 2005 criteria were used to define shock and organ failure.26 'The Pediatric Acute Lung Injury Consensus Conference Group' criteria were used for the diagnosis and classification of ALI.27 The presence of acute kidney injury (AKI) was defined according to the KDIGO criteria.28 While performing KDIGO staging, we used the AKI score resulting from the cumulative application of creatinine and urine output, which was applied in the study of Sutherland et al.29 PICU admission creatinine values were accepted as basal creatinine. If the patient's hospitalization creatinine value was high, the values in the last 2 weeks were considered as 'basal creatinine'.30 For all patients older than 1 year who had no 'baseline creatinine' value in the system in the last 2 weeks, the normal creatinine level was calculated with an age-dependent equation.31 For children younger than 1 year, the curve of estimated creatinine values was used.32 Information on the use of furosemide during the first three day after PICU admission was recorded, frequencies and the cumulative doses per kilogram of body weight were calculated.33
Clinical outcomesOur primary outcome was PICU mortality. Secondary outcomes were intensive care unit-free days (IFD) and ventilator-free days (VFD) up to 28 days. The term 'VFD' was used for the days when patients did not need a mechanical ventilator in the first 28 days. If the patient remained on mechanical ventilator for more than 28 days or died within 28 days without weaning from the mechanical ventilator, the day without ventilator was recorded as zero. The term 'IFD' was used to evaluate the PICU hospitalization of the patients. For patients who were followed up in the PICU for more than 28 days or died within 28 days, the day without intensive care was recorded as zero.
Statistical analysisStatistical tests were performed using the 'Statistical Package for Social Science' (SPSS) 23 program. Descriptive results were expressed as mean ± standard deviation (SD) for continuous variables. All definitions related with FO were analyzed separately as a continuous and categorical variable. Fluid overload was categorized according to ‘5%’ and ‘10%’ thresholds and analyzed for demographic characteristics, mortality and secondary outcomes. Results were compared simultaneously as early, peak and cumulative fluid overload. These values were determined by reference to previous studies.8,17,19,23,34–37 Depending on the distribution of the data, the student’s t test for unpaired samples and the Mann–Whitney U test were used to determine the differences between two groups. To compare the differences of categorical variables between groups, we used Fisher's exact test or the chi-square test. To examine correlations, we used Spearman's analysis. We performed univariate regression analysis to calculate the 95% confidence interval (CI) and odds ratio (OR) to determine the associations of fluid accumulation with mortality. Predictors of mortality were determined using multivariable logistic regression models. All potential confounders were included in the initial model. Stepwise regression procedures were used to produce the final models. In order to determine whether there was a significant multicollinearity between the variables, collinearity diagnostics were performed using variance inflation factor (VIF) and tolerance values and variables with a VIF value greater than 5 were not included in the model. The area under the curve (AUC) of the receiver operating characteristic (ROC) curve was calculated to assess the predictive ability. The Youden index was calculated to assess the best alignment between sensitivity and specificity. All statistical tests were 2-sided and p values <0.05 were considered statistically significant.
ResultsPatient characteristicsDuring the study period, a total of 1064 children were admitted to the PICU. 28 patients with chronic renal failure and 25 patients whose cardiopulmonary arrest could not be stabilized 2 h after admission to the intensive care unit were excluded from the study. 430 patients with less than 24 h of intensive care stay and missing information in the registry system were excluded from the study. A total of 581 patients were included in the study (Fig. 1). Respiratory diseases were the most frequent reason for PICU admission, accounting for 27.2% of cases. This was followed by postoperative diseases at 26% and neurologic diseases at 12.2% (Suplemental Table 1). The PICU mortality rate of the whole cohort was 11.7%. 42% of patients were admitted to the PICU directly from the emergency service. The overall median age was 53 (1–215) months. 335 (57.7%) of the patients participating in the study were male.
Survivors vs. non-survivors
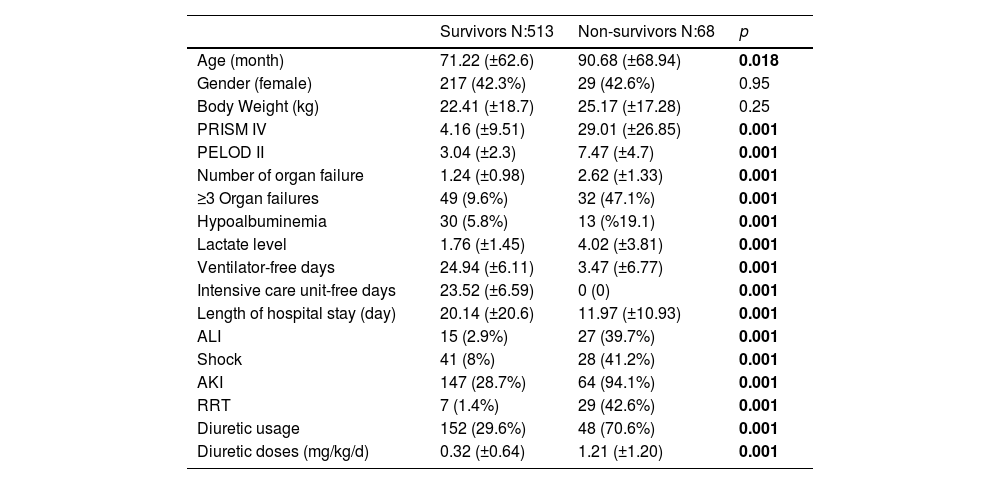
There was no significant difference between these two groups in terms of age, weight and gender. Non-survivors had higher admission lactate levels, PRISM IV and PELOD II scores compared to survivors (p < 0.001). A higher rate of AKI, shock, and ALI observed in non-survivors during PICU stay (p < 0.001). Also compared to survivors, non-survivors had fewer VFD and IFD (p < 0.001). It was observed that renal support treatments such as RRT and diuretic administration were used more frequently in non-survivors (p < 0.001) (Table 1).
Demographic datas of the study population.
| Survivors N:513 | Non-survivors N:68 | p | |
|---|---|---|---|
| Age (month) | 71.22 (±62.6) | 90.68 (±68.94) | 0.018 |
| Gender (female) | 217 (42.3%) | 29 (42.6%) | 0.95 |
| Body Weight (kg) | 22.41 (±18.7) | 25.17 (±17.28) | 0.25 |
| PRISM IV | 4.16 (±9.51) | 29.01 (±26.85) | 0.001 |
| PELOD II | 3.04 (±2.3) | 7.47 (±4.7) | 0.001 |
| Number of organ failure | 1.24 (±0.98) | 2.62 (±1.33) | 0.001 |
| ≥3 Organ failures | 49 (9.6%) | 32 (47.1%) | 0.001 |
| Hypoalbuminemia | 30 (5.8%) | 13 (%19.1) | 0.001 |
| Lactate level | 1.76 (±1.45) | 4.02 (±3.81) | 0.001 |
| Ventilator-free days | 24.94 (±6.11) | 3.47 (±6.77) | 0.001 |
| Intensive care unit-free days | 23.52 (±6.59) | 0 (0) | 0.001 |
| Length of hospital stay (day) | 20.14 (±20.6) | 11.97 (±10.93) | 0.001 |
| ALI | 15 (2.9%) | 27 (39.7%) | 0.001 |
| Shock | 41 (8%) | 28 (41.2%) | 0.001 |
| AKI | 147 (28.7%) | 64 (94.1%) | 0.001 |
| RRT | 7 (1.4%) | 29 (42.6%) | 0.001 |
| Diuretic usage | 152 (29.6%) | 48 (70.6%) | 0.001 |
| Diuretic doses (mg/kg/d) | 0.32 (±0.64) | 1.21 (±1.20) | 0.001 |
All p<0.05 values are indicated in bold characters. ALI: Acute lung injury, AKI: Acute kidney injury, CPR: Cardiopulmonary resuscitation, PELOD: Pediatric logistic organ dysfunction, PRISM: Pediatric risk of mortality, RRT: Renal replacement therapy.
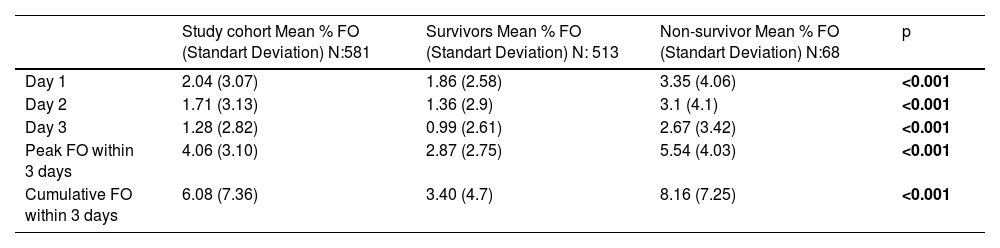
When fluid accumulation was analyzed in terms of mortality, the percentage of fluid overload was 1.86 ± 2.58 and 3.35 ± 4.06 on the first day, peak fluid overload was 2.87 ± 2.75 and 5.54 ± 4.03, cumulative fluid overload was 3.40 ± 4.7 and 8.16 ± 7.26, in survivors and non-survivors respectively (Table 2, Fig. 2). During the initial 3 days in the ICU, the mean early, peak and cumulative fluid accumulation was higher for non-survivors than for survivors. ≥5% early fluid overload occurred in 63 patients, ≥5% peak fluid overload occurred in 111 patients and ≥10% cumulative fluid overload occurred in 55 patients.
Comparison of fluid accumulation.
| Study cohort Mean % FO (Standart Deviation) N:581 | Survivors Mean % FO (Standart Deviation) N: 513 | Non-survivor Mean % FO (Standart Deviation) N:68 | p | |
|---|---|---|---|---|
| Day 1 | 2.04 (3.07) | 1.86 (2.58) | 3.35 (4.06) | <0.001 |
| Day 2 | 1.71 (3.13) | 1.36 (2.9) | 3.1 (4.1) | <0.001 |
| Day 3 | 1.28 (2.82) | 0.99 (2.61) | 2.67 (3.42) | <0.001 |
| Peak FO within 3 days | 4.06 (3.10) | 2.87 (2.75) | 5.54 (4.03) | <0.001 |
| Cumulative FO within 3 days | 6.08 (7.36) | 3.40 (4.7) | 8.16 (7.25) | <0.001 |
All p<0.05 values are indicated in bold characters. FO: fluid overload.

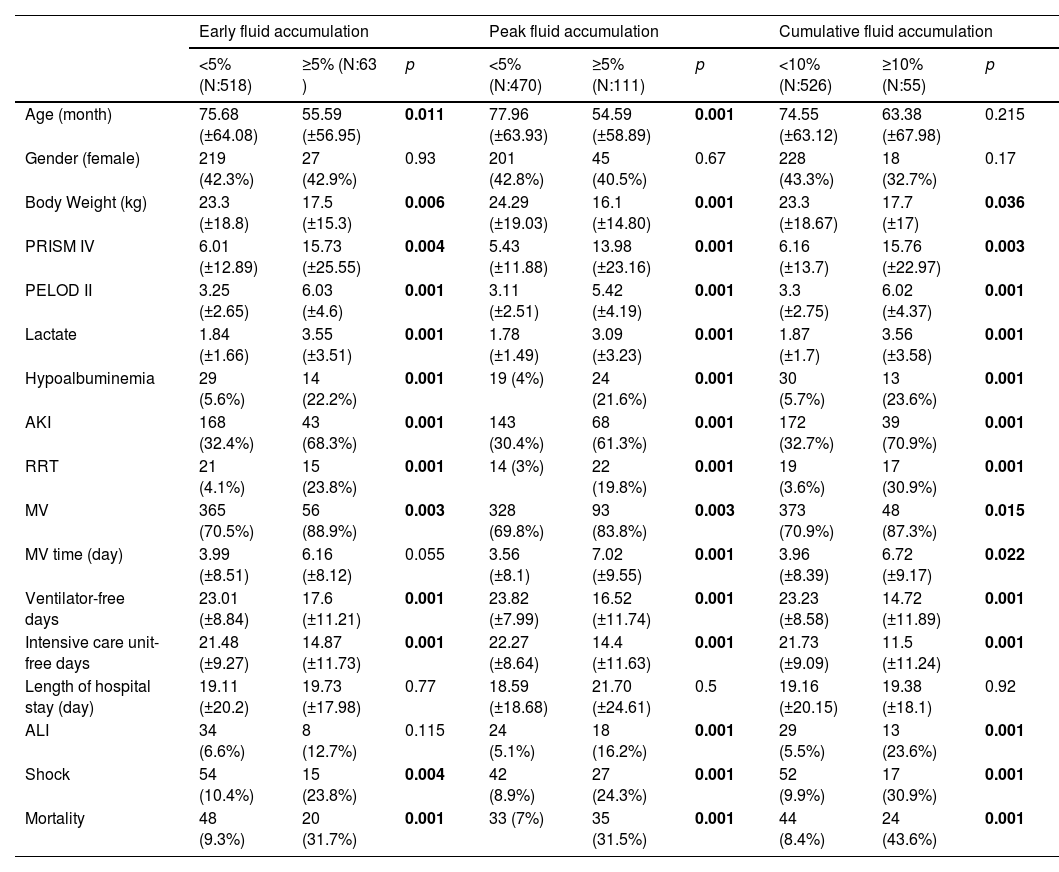
The threshold value was determined as ‘5%’ for early and peak fluid overload and ‘10%’ for cumulative fluid overload. Patients with ≥5% early fluid overload had fewer VFD and IFD, higher rates of mortality, need for RRT, AKI and shock development were observed compared to <5% fluid overload. Similarly patients with ≥5% peak fluid overload had fewer VFD and IFD, higher rates of mortality, need for RRT, AKI, shock and ALI development were observed compared to <5% fluid overload. Also patients with ≥10% cumulative fluid overload had fewer VFD and IFD, higher rates of mortality, need for RRT, AKI, shock and ALI development were observed compared to <10% fluid overload (Table 3).
Comparison of demographic characteristics, morbidity and mortality by % fluid overload group.
| Early fluid accumulation | Peak fluid accumulation | Cumulative fluid accumulation | |||||||
|---|---|---|---|---|---|---|---|---|---|
| <5% (N:518) | ≥5% (N:63 ) | p | <5% (N:470) | ≥5% (N:111) | p | <10% (N:526) | ≥10% (N:55) | p | |
| Age (month) | 75.68 (±64.08) | 55.59 (±56.95) | 0.011 | 77.96 (±63.93) | 54.59 (±58.89) | 0.001 | 74.55 (±63.12) | 63.38 (±67.98) | 0.215 |
| Gender (female) | 219 (42.3%) | 27 (42.9%) | 0.93 | 201 (42.8%) | 45 (40.5%) | 0.67 | 228 (43.3%) | 18 (32.7%) | 0.17 |
| Body Weight (kg) | 23.3 (±18.8) | 17.5 (±15.3) | 0.006 | 24.29 (±19.03) | 16.1 (±14.80) | 0.001 | 23.3 (±18.67) | 17.7 (±17) | 0.036 |
| PRISM IV | 6.01 (±12.89) | 15.73 (±25.55) | 0.004 | 5.43 (±11.88) | 13.98 (±23.16) | 0.001 | 6.16 (±13.7) | 15.76 (±22.97) | 0.003 |
| PELOD II | 3.25 (±2.65) | 6.03 (±4.6) | 0.001 | 3.11 (±2.51) | 5.42 (±4.19) | 0.001 | 3.3 (±2.75) | 6.02 (±4.37) | 0.001 |
| Lactate | 1.84 (±1.66) | 3.55 (±3.51) | 0.001 | 1.78 (±1.49) | 3.09 (±3.23) | 0.001 | 1.87 (±1.7) | 3.56 (±3.58) | 0.001 |
| Hypoalbuminemia | 29 (5.6%) | 14 (22.2%) | 0.001 | 19 (4%) | 24 (21.6%) | 0.001 | 30 (5.7%) | 13 (23.6%) | 0.001 |
| AKI | 168 (32.4%) | 43 (68.3%) | 0.001 | 143 (30.4%) | 68 (61.3%) | 0.001 | 172 (32.7%) | 39 (70.9%) | 0.001 |
| RRT | 21 (4.1%) | 15 (23.8%) | 0.001 | 14 (3%) | 22 (19.8%) | 0.001 | 19 (3.6%) | 17 (30.9%) | 0.001 |
| MV | 365 (70.5%) | 56 (88.9%) | 0.003 | 328 (69.8%) | 93 (83.8%) | 0.003 | 373 (70.9%) | 48 (87.3%) | 0.015 |
| MV time (day) | 3.99 (±8.51) | 6.16 (±8.12) | 0.055 | 3.56 (±8.1) | 7.02 (±9.55) | 0.001 | 3.96 (±8.39) | 6.72 (±9.17) | 0.022 |
| Ventilator-free days | 23.01 (±8.84) | 17.6 (±11.21) | 0.001 | 23.82 (±7.99) | 16.52 (±11.74) | 0.001 | 23.23 (±8.58) | 14.72 (±11.89) | 0.001 |
| Intensive care unit-free days | 21.48 (±9.27) | 14.87 (±11.73) | 0.001 | 22.27 (±8.64) | 14.4 (±11.63) | 0.001 | 21.73 (±9.09) | 11.5 (±11.24) | 0.001 |
| Length of hospital stay (day) | 19.11 (±20.2) | 19.73 (±17.98) | 0.77 | 18.59 (±18.68) | 21.70 (±24.61) | 0.5 | 19.16 (±20.15) | 19.38 (±18.1) | 0.92 |
| ALI | 34 (6.6%) | 8 (12.7%) | 0.115 | 24 (5.1%) | 18 (16.2%) | 0.001 | 29 (5.5%) | 13 (23.6%) | 0.001 |
| Shock | 54 (10.4%) | 15 (23.8%) | 0.004 | 42 (8.9%) | 27 (24.3%) | 0.001 | 52 (9.9%) | 17 (30.9%) | 0.001 |
| Mortality | 48 (9.3%) | 20 (31.7%) | 0.001 | 33 (7%) | 35 (31.5%) | 0.001 | 44 (8.4%) | 24 (43.6%) | 0.001 |
All p<0.05 values are indicated in bold characters. ALI: Acute lung injury, AKI: Acute kidney injury, MV: Mechanical ventilation, PELOD: Pediatric logistic organ dysfunction, PRISM: Pediatric risk of mortality, RRT: Renal replacement therapy.
To determine whether fluid overload was independently associated with mortality in the general PICU population, multiple regression models were constructed using variables with p < 0.05 in univariate statistics. Variables with high correlations and high VIF values were not included in the same model. Finally, two different models were generated.
In the first model for fluid overload as a continuous variable analysis, the final model retained ALI (aOR 5.74; 95% CI 2.4–13.7; p < 0.001), shock (aOR 2.37; 95% CI 1.05–5.33; p = 0.036), PRISM IV (aOR 1.04; 95% CI 1.02–1.1; p < 0.001), AKI (aOR 14.4; 95% CI 4.67–44.3; p < 0.001), mechanical ventilator (aOR 13.45; 95% CI 1.42–126.7; p = 0.023) and peak fluid overload (aOR 1.15; 95% CI 1.05–1.26; p = 0.002) associated with mortality (Table 4).
Multivariate log regression analysis for peak and early fluid accumulation as continuous variable.
| aOR | 95%CI min-max | p | |
|---|---|---|---|
| ALI (+) | 5.74 | 2.40−13.70 | 0.001 |
| Shock (+) | 2.37 | 1.05−5.33 | 0.036 |
| PRISM IV | 1.04 | 1.02−1.06 | 0.001 |
| AKI (+) | 14.40 | 4.67−44.39 | 0.001 |
| MV (+) | 13.45 | 1.42−126.74 | 0.023 |
| Peak fluid overload (continuous) | 1.15 | 1.05−1.26 | 0.002 |
| Early fluid overload (continuous) | 0.93 | 0.81−1.07 | 0.33 |
Model Chi-square: 38.182; −2LL = 203.339; p < 0.001; Success rate = % 93.6, Cox & Snell R Square = 0.311, Nagelkerke R Square = 0.604. All p<0.05 values are indicated in bold characters.
ALI: Acute lung injury, AKI: Acute kidney injury, MV: Mechanical ventilation, PRISM: Pediatric risk of mortality.
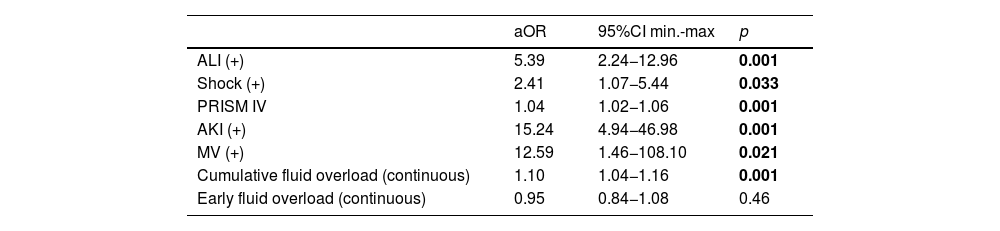
In second model for fluid overload as a continuous variable analysis, the final model retained ALI (aOR 5.39; 95% CI 2.2–13; p < 0.001), shock (aOR 2.41; 95% CI 1.1–5.4; p = 0.033), PRISM IV (aOR 1.04; 95% CI 1.02–1.1; p < 0.001), AKI (aOR 15.2; 95% CI 4.9–46.9; p < 0.001), mechanical ventilator (aOR 12.59; 95% CI 1.5–108.1; p = 0.021) and cumulative fluid overload (aOR 1.10; 95% CI 1.04–1.2; p < 0.001) associated with mortality (Table 5).
Multivariate log regression analysis for cumulative and early fluid accumulation as continuous variable.
| aOR | 95%CI min.-max | p | |
|---|---|---|---|
| ALI (+) | 5.39 | 2.24−12.96 | 0.001 |
| Shock (+) | 2.41 | 1.07−5.44 | 0.033 |
| PRISM IV | 1.04 | 1.02−1.06 | 0.001 |
| AKI (+) | 15.24 | 4.94−46.98 | 0.001 |
| MV (+) | 12.59 | 1.46−108.10 | 0.021 |
| Cumulative fluid overload (continuous) | 1.10 | 1.04−1.16 | 0.001 |
| Early fluid overload (continuous) | 0.95 | 0.84−1.08 | 0.46 |
Model Chi-square: 34.888; −2LL = 200.646; p < 0.001; Success rate= % 94.5, Cox & Snell R Square = 0.314, Nagelkerke R Square = 0.610. All p<0.05 values are indicated in bold characters.
Although early fluid overload associated with mortality in univariate analysis, the association did not remain significant after controlling for ALI, shock, PRISM IV, AKI, MV, peak FO and cumulative FO.
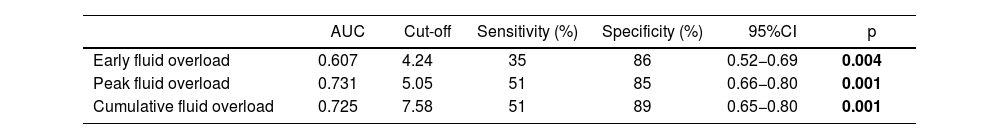
Ability of fluid overload to predict PICU mortalityThe predictive ability of fluid overloads for PICU mortality was showed in Fig. 3. The peak fluid overload achieved AUC of 0.731 (95% CI, 0.66−0.80; p < 0.001) for predicting mortality. For the 5.05% cut-off value, detected sensitivity was 51% and the specificity was 85%. The cumulative fluid overload achieved AUC of 0.725 (95% CI, 0.65−0.80; p < 0.001) for predicting mortality. For the 7.58 % cut-off value, detected sensitivity was 51% and the specificity was 89% (Table 6).

Predictive performance of fluid overload for PICU mortality.
| AUC | Cut-off | Sensitivity (%) | Specificity (%) | 95%CI | p | |
|---|---|---|---|---|---|---|
| Early fluid overload | 0.607 | 4.24 | 35 | 86 | 0.52−0.69 | 0.004 |
| Peak fluid overload | 0.731 | 5.05 | 51 | 85 | 0.66−0.80 | 0.001 |
| Cumulative fluid overload | 0.725 | 7.58 | 51 | 89 | 0.65−0.80 | 0.001 |
All p<0.05 values are indicated in bold characters.
Spearman correlation analysis was used to show the relationship between fluid accumulation and IFD-VFD. There was a significant negative weak correlation between the peak fluid overload and IFD (ρ, −0.359; p < 0.001). Furthermore, there was a negative weak correlation between the peak fluid overload and the VFD (ρ, −0.288; p < 0.001). The cumulative fluid overload had significant negative weak correlation with IFD (ρ, −0.315; p < 0.001) and VFD (ρ, −0.228; p < 0.001).
DiscussionOur study presents data on fluid accumulation in a general PICU population with critical illness. The results suggest that both peak and cumulative fluid overload were independently associated with PICU mortality. These findings are consistent with previous clinical studies conducted in similar multisystemic pediatric populations.19,20
Our data imply that cumulative fluid overload as continuous variable to be independently associated with worsening clinical outcomes. The association with mortality was significant at 10% when we examined cumulative fluid overload at different thresholds. Our results were consistent with previous studies; in patients with >10% fluid accumulation, the risk of mortality was reported by Bhaskar34 et al. 9.97 times, Sutawan19 et al. 11.5 times, Soler21 et al. 2.43 times increased. Additionally for every 1% increase in cumulative fluid overload, Bhaskar et al. 11%, Wong38 et al. 8%, Lex37 et al. 8% increase in PICU mortality was detected. Contrary to our study Kong et al.16 found that cumulative FO and FO > 10% were not associated with hospital mortality, FO > 20% was positively correlated with mortality. Poor clinical outcomes of FO > 5%,8,17 FO > 10%19,37 and FO > 20%16 have been reported in different pediatric studies. In a European survey about current practice of fluid maintenance and replacement therapy in mechanically ventilated critically ill children shows that, FO > 5% is considered to be an indication to reduce fluid intake and start diuretic treatment and there seems to be not clear agreement on the use of RRT in the early phase of fluid overload in most respondents.39 In conclusion among the PICU specialists there is great heterogenecity in the current clinical practice to interfere with fluid accumulation. Although American College of Critical Care Medicine Guidelines40 suggest that %FO > 10% can be considered as an threshold for diuretic or RRT and other interventions, there is no international consensus regarding fluid overload and removal strategies to our knowledge. It may be because of relatively few randomized trials evaluating the impact of fluid accumulation have investigated in children despite adult studies.41,42 Considering our current knowledge, there isn't any study proving that there is a definitive threshold value for all pediatric intensive care patients, so each clinic should determine its own threshold value according to its own population and facilities.
It was observed that diuretic administration were used more frequently in non-survivors compared to survivors in our study similar to another study conducted in the sepsis patient group.23 Chen et al.23 also found that FO > 5% patients applied similar doses of diuretic treatment compared to FO < 5%, similarly in our study we emphasized that the patients whose cumulative FO > 10%, had higher doses of diuretic administration compared to FO < 10%. The fact that we could not prevent fluid overload despite high-dose diuretic treatment raises the question of whether we should have started RRT earlier. In a randomized clinical trial involving post cardiac surgery infants, the furosemide usage group was 3 times more likely to have 10% fluid overload, compared to the prophylactic peritoneal dialysis group.43 In a study, conservative group which was given restricted fluid and higher dose diuretics had similar cumulative fluid balance on day 3 compared to the liberal group due to they were capable of higher cumulative diuresis.44 Moreover once significant FO is established removal of fluid was not related with improved outcomes,45 in this context clinical trials are needed to define whether preventing significant fluid overload may lead to better outcomes.
Diaz et al. found that peak fluid overload is not an independent risk factor for mortality.15 In our study peak fluid overload was independently associated with mortality. Unlike peak and cumulative FO, early FO was not related with mortality in our study.
This study has some limitations. It is a single-centered study. Fluid output was calculated by including urine, faeces, blood loss, nasogastric tube, surgical drains, and dialysis outputs. We did not take into account other probable immeasurable insensible losses above the presumed values during FO calculation due to the study's design.10,14,18,23,46 Some of the patients may have received diuretic treatment before PICU admission. No further evaluation has been made regarding this.
ConclusionIn conclusion, studies on the prevalence, origin and consequences of fluid overload in PICUs are limited. Our research indicates a significant association between peak fluid overload in the first three days and the three-day cumulative fluid overload with mortality, as well as a weak association with morbidity in critically ill children. Starting RRT together with diuretic treatments in the early stages of fluid overload may have a positive effect on mortality when intervening acute kidney injury. Multicentered and randomised controlled trials are needed to determine whether fluid overload is an appropriate treatment target to reduce mortality.
Author contrubitionsDr. Dursun and Dr. Ulgen Tekerek had full access to all of the data in the study and take responsibility for the integrity of the data and the accuracy of the data analysis. Dr. Ulgen Tekerek, Dr. Dursun, Dr. Koker, Dr Bayirli contributed to concept and design. Dr. Koker, Dr. Bayirili, contributed to acquisition, analysis, or interpretation of data. Dr. Dursun, Dr. Ulgen Tekerek, Dr. Bayirli contributed to drafting of the article. All authors contributed to critical revision of the article for important intellectual content. Dr. Ulgen Tekerek and Dr. Dursun contributed to statistical analysis.
EthicData collection and analysis were conducted under the approval of Akdeniz University Clinical Research Ethics Review Board (Title: Relationship between Fluid Overload and Clinical Outcomes in PICU; Date: 01.12.2021No: KAEK-850). Procedures were followed in accordance with the ethical standards of the responsible committee on human experimentation (institutional or regional) and with the Helsinki Declaration of 1975.
FundingThe authors declare that this research did not receive any specific grant from funding agencies in the public, commercial or not-for-profit sectors.
Conflict of interestThe authors declare no conflict of interests.
Data availabilityData available on request from the authors.
We acknowledge the contribution of the medical and nursing staff of Pediatric Intensive Care Unit of Akdeniz University Hospital. We would like to Deniz Ozel for her support in statistical analysis.
The following are Supplementary data to this article:
This study was previously presented as an oral presentation at the ESPNIC 2023 congress.

