

Analyze the effects of frailty and prefrailty in patients admitted to the ICU without age limits and to determine the factors associated with mortality.
DesignProspective cohort.
SettingIntensive Care Unit, Spain.
Patients1462 critically ill patients without age limits.
InterventionNone.
Main variables of interestHospital mortality and health outcomes.
ResultsPatients’ ages ranged from 15 to 93 years, median of 66 years. Predisposing factors independently associated with frailty and prefrailty were age older than 65 years, female sex, respiratory and renal comorbidities, longer pre-ICU stays, and weekend admission. There is a greater use of noninvasive mechanical ventilation, greater colonization by multidrug-resistant bacteria, and the development of delirium. The risk of hospital mortality was RR 4.04 (2.11–7.74; P<.001) for prefail and 5.88 (2.45–14.10; P<.001) for frail. Factors associated with in-hospital mortality in prefrail and frail were pre-ICU hospital length of stay (cutpoint 4.5 days [1.6–7.4]), greater severity on admission (SAPS3) (cutpoint 64.5 [63.6–65.4]), Glasgow Coma Scale deterioration (OR 4.14 [1.23–13.98]; P .022) and thrombocytopenia (OR 11.46 [2.21–59.42]; P .004).
ConclusionsLower levels of frailty are most common in ICU patients and are associated with worse health outcomes. Our data suggest that frailty and pre frailty should be determined in all patients admitted to the ICU, regardless of their age.
Analisis del impacto de la fragilidad y prefragilidad en pacientes críticos sin límite de edad y factores de mortalidad hospitalaria.
DiseñoCohorte prospectivo.
ÁmbitoUnidad de Cuidados Intensivos, España.
PacientesPacientes críticos sin límite de edad.
IntervenciónNinguna.
Variables de interés principalesMortalidad hospitalaria y resultados de salud.
ResultadosEl rango de edad fue 15 a 93 años, mediana 66. Los factores asociados con la fragilidad y prefragilidad fueron ser mayor de 65 años, mujer, comorbilidades respiratorias y renales, estancia previa a UCI, ingreso en fin de semana. Existe un mayor riesgo de ventilación mecánica no invasiva, colonización por bacterias multirresistentes, delirium y mortalidad hospitalaria RR 4.04 (2.11–7.74; P<.001) prefrágiles y 5.88 (2.45–14.10; P<.001) en frágiles. Los factores asociados con la mortalidad hospitalaria (prefrágiles y frágiles) fueron los días de estancia previa a UCI (corte 4.5 [1.6–7.4]), mayor gravedad al ingreso (SAPS3) (corte 64.5 [63.6–65.4]), deterioro Escala Glasgow (OR 4.14 [1.23–13.98]; P .022) y trombocitopenia (OR 11.46 [2.21–59.42]; P .004).
ConclusionesNiveles más bajos de fragilidad son frecuentes en UCI y se asocian a peores resultados de salud. Estos resultados apoyan la identificación de la fragilidad y pre fragilidad en todos los pacientes ingresados en UCI independientemente de la edad.
Frailty is a multidimensional syndrome characterized by a loss of physiological reserves and increased vulnerability to poor outcomes in the face of stressors such as mortality, dependency, and institutionalization.
Its study could improve the accuracy of mortality prediction tools in critically ill patients. Knowing the degree of frailty could provide information closer to biological age than chronological age,1 allowing the identification of a population susceptible to poorer outcomes. This group at risk could benefit from preventive interventions and planning of end-of-life decisions.
The Clinical Frailty Scale (CFS) is a widely used frailty screening tool due to its ease of use, reliability and predictive validity. This instrument identifies and stratifies the level of frailty by assessing physical and mental capacity. The latest revision (version 2.0)2 changed level 4 from “vulnerable” to “living with very mild frailty” interpreted as equivalent to prefragility. Due to a higher incidence of frailty in older adults, this scale was validated in patients older than 65 years of age3; thus, until recently, data or the impact of frailty in critically ill patients were mostly from older patients.
Frailty also occurs in young people (considered to be younger than 65 years) this group of patients is often excluded from studies, therefore, clarifying the predictive role of frailty and prefrailty in populations without age limits, including young people, remains an area of interest.4,5
Accordingly, the aims of our study are (a) to identify predictors of prefrailty and frailty in critically ill patients without age limits, (b) to analyze the factors that condition a higher risk of in-hospital mortality in the frail and prefrail groups of patients and (c) to perform a comparative analysis according to whether frail patients are considered young or elderly.
MethodsStudy designWe performed a prospective cohort study in a medical-surgical ICU in hospital (level II of care complexity) that included all patients admitted from Oct 1, 2016, to May 1, 2019, regardless of age. Only the first ICU admission was considered, and patients whose follow-up was lost due to transfer to another center or without signed informed consent were excluded.
The registry and data collection were approved by the Research Ethics Committee of Francisco de Vitoria University (N°44).
Definition of frailtyFrailty identified at ICU admission was assessed according to the status before the prompt admission, following the recommendations of the Canadian Health and Aging Clinical Frailty Scale (CFS) 9 points. The CFS was further categorized as nonfrail if the CFS score was ≤3, prefrail if the CFS score was 4, and frail if the CFS score was ≥5.
Data managementBefore the start of the study, a training period on frailty and the CFS tool was conducted through a training session. The CFS was obtained by reviewing the medical records or interviewing the participant or their proxy decision maker.
The data were collected prospectively on a standardized form and entered into an anonymised electronic database.
The demographic factors, comorbid conditions, origin of ICU admission, admission shift, diagnostic category, severity of illness at ICU admission (Simplified Acute Physiologic Score [SAPS] III) severity of organ dysfunction at ICU admission (Sequential Organ Failure Assessment Score (SOFA)),6 and type of organ failure that developed during ICU admission (at least two points according to SOFA score for each organ) were included; the total number of organ failures, intensity of treatment and categorized ICU complications were also included. The following variables related to short-term prognosis were also collected: length of stay (hospital, ICU, and pre-ICU), number of readmissions to the ICU and outcome at hospital discharge (alive/dead).
OutcomesThe primary outcomes were the prevalence of frailty and prefrailty in the ICU and in-hospital mortality. The secondary outcomes were length of stay (hospital, pre-ICU and ICU) and clinical variables related to the patient's clinical course.
Statistical analysisWe used frequencies and percentages for categorical variables and medians and interquartile ranges (IQRs) or means and standard deviations for continuous variables.
Three frailty categories were created according to the instructions of the CFS questionnaire: nonfrail patients (scores 1–3), prefrail patients (score 4), and frail patients (scores 5–9). Differences were analyzed using the chi-square test or Fisher's exact test for categorical variables and Student's t-test or its nonparametric alternative, the Mann‒Whitney test, for numerical variables. We constructed a multinomial logistic regression model (with the nonfrail group serving as a reference) using variables with P values less than .05 in the univariate analysis.
In addition, we investigated the factors associated with a higher risk of in-hospital mortality in prefrail and frail patients. First, we performed univariate logistic regressions with all potential predictors of in-hospital mortality. Factors with P values less than .05 were included in a subsequent multivariable model. We used the best subset selection method and the R2 metric to select the model factors. We accounted for homoscedasticity and multicollinearity in the final model with variance inflation factor values >5. In addition, we calculated the optimal cutoff points associated with a higher risk of in-hospital mortality for SAPS 3 patients and for the days before ICU stay using the nearest method; these cutoff points had perfect sensitivity and specificity on the receiver operating characteristic curve. The estimated cutoff point was determined by bootstrapping (100 replications) to calculate confidence intervals.
Finally, we present the differences between the groups of frail patients younger and older than 65 years according to days of hospitalization, in-hospital mortality, need for readmission, presence of delirium and use of supportive therapies. Differences were analyzed using the chi-square test or Fisher's exact test for categorical variables and Student's t-test or its nonparametric alternative, the Mann‒Whitney test, for numerical variables.
Statistical analyses were performed using R 3.6 (R Project for Statistical Computing) and STATA 15.0 (Stata Corporation, College Station, TX, USA). All P values were two-sided; P<.05 was considered to indicate statistical significance.
ResultsOne thousand five hundred thirty-four patients were admitted during the study period, 1462 (95%) of whom met the inclusion criteria. Five percent of the data were lost due to transfer or the absence of informed consent.
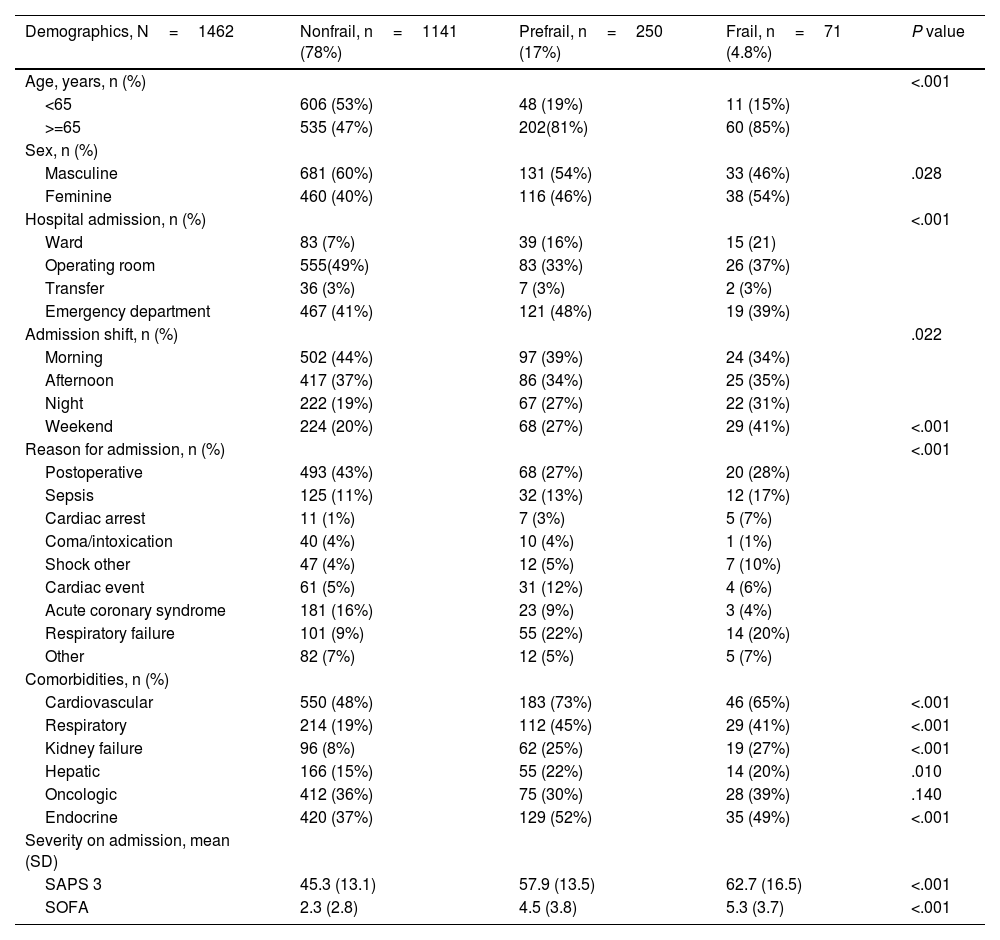
Demographic and clinical characteristics of the study cohortThe total cohort spans an age range from 15 to 93 years, with a median of 66 years (IQR 55–74 years). The CFS score ranged from 1 to 8 points, with a median of 3 (IQR 2–3). Although young frail patients (<65 years) have been reported, frailty is prone to develop with increasing age (Fig. 1). Categorization according to the CFS showed 78% (n=1141) nonfragile, 17% (n=250) prefragile and 4.8% (n=71) fragile patients. Three percent (n=47) of the patients were readmitted, with a median ICU stay of 2 days (IQR 1–4) and a hospital stay of 6 days (IQR 3–12). The mean ICU survival rate was 96.8% (n=1415), and the mean hospital survival rate was 93.8% (n=1371). The remaining data are shown in the bivariate analysis performed after frailty categorization (Tables 1–3).

Bivariate analysis of baseline characteristics according to the three frailty categories.
| Demographics, N=1462 | Nonfrail, n=1141 (78%) | Prefrail, n=250 (17%) | Frail, n=71 (4.8%) | P value |
|---|---|---|---|---|
| Age, years, n (%) | <.001 | |||
| <65 | 606 (53%) | 48 (19%) | 11 (15%) | |
| >=65 | 535 (47%) | 202(81%) | 60 (85%) | |
| Sex, n (%) | ||||
| Masculine | 681 (60%) | 131 (54%) | 33 (46%) | .028 |
| Feminine | 460 (40%) | 116 (46%) | 38 (54%) | |
| Hospital admission, n (%) | <.001 | |||
| Ward | 83 (7%) | 39 (16%) | 15 (21) | |
| Operating room | 555(49%) | 83 (33%) | 26 (37%) | |
| Transfer | 36 (3%) | 7 (3%) | 2 (3%) | |
| Emergency department | 467 (41%) | 121 (48%) | 19 (39%) | |
| Admission shift, n (%) | .022 | |||
| Morning | 502 (44%) | 97 (39%) | 24 (34%) | |
| Afternoon | 417 (37%) | 86 (34%) | 25 (35%) | |
| Night | 222 (19%) | 67 (27%) | 22 (31%) | |
| Weekend | 224 (20%) | 68 (27%) | 29 (41%) | <.001 |
| Reason for admission, n (%) | <.001 | |||
| Postoperative | 493 (43%) | 68 (27%) | 20 (28%) | |
| Sepsis | 125 (11%) | 32 (13%) | 12 (17%) | |
| Cardiac arrest | 11 (1%) | 7 (3%) | 5 (7%) | |
| Coma/intoxication | 40 (4%) | 10 (4%) | 1 (1%) | |
| Shock other | 47 (4%) | 12 (5%) | 7 (10%) | |
| Cardiac event | 61 (5%) | 31 (12%) | 4 (6%) | |
| Acute coronary syndrome | 181 (16%) | 23 (9%) | 3 (4%) | |
| Respiratory failure | 101 (9%) | 55 (22%) | 14 (20%) | |
| Other | 82 (7%) | 12 (5%) | 5 (7%) | |
| Comorbidities, n (%) | ||||
| Cardiovascular | 550 (48%) | 183 (73%) | 46 (65%) | <.001 |
| Respiratory | 214 (19%) | 112 (45%) | 29 (41%) | <.001 |
| Kidney failure | 96 (8%) | 62 (25%) | 19 (27%) | <.001 |
| Hepatic | 166 (15%) | 55 (22%) | 14 (20%) | .010 |
| Oncologic | 412 (36%) | 75 (30%) | 28 (39%) | .140 |
| Endocrine | 420 (37%) | 129 (52%) | 35 (49%) | <.001 |
| Severity on admission, mean (SD) | ||||
| SAPS 3 | 45.3 (13.1) | 57.9 (13.5) | 62.7 (16.5) | <.001 |
| SOFA | 2.3 (2.8) | 4.5 (3.8) | 5.3 (3.7) | <.001 |
Notes: nonfrail is the reference category.
Acronyms: SD: standard deviation; SAPS 3: Simplified Acute Physiology Score 3; SOFA: Sequential Organ Failure Assessment.
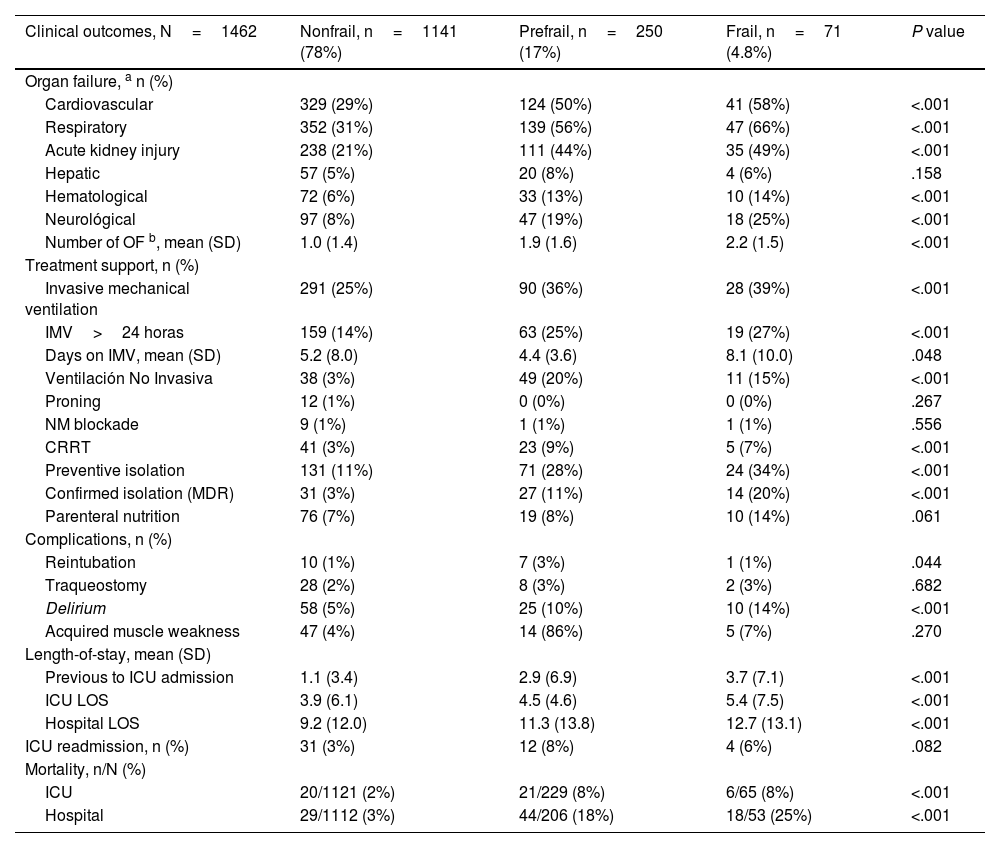
Bivariate analysis of organ development during ICU admission by frailty category.
| Clinical outcomes, N=1462 | Nonfrail, n=1141 (78%) | Prefrail, n=250 (17%) | Frail, n=71 (4.8%) | P value |
|---|---|---|---|---|
| Organ failure, a n (%) | ||||
| Cardiovascular | 329 (29%) | 124 (50%) | 41 (58%) | <.001 |
| Respiratory | 352 (31%) | 139 (56%) | 47 (66%) | <.001 |
| Acute kidney injury | 238 (21%) | 111 (44%) | 35 (49%) | <.001 |
| Hepatic | 57 (5%) | 20 (8%) | 4 (6%) | .158 |
| Hematological | 72 (6%) | 33 (13%) | 10 (14%) | <.001 |
| Neurológical | 97 (8%) | 47 (19%) | 18 (25%) | <.001 |
| Number of OF b, mean (SD) | 1.0 (1.4) | 1.9 (1.6) | 2.2 (1.5) | <.001 |
| Treatment support, n (%) | ||||
| Invasive mechanical ventilation | 291 (25%) | 90 (36%) | 28 (39%) | <.001 |
| IMV>24 horas | 159 (14%) | 63 (25%) | 19 (27%) | <.001 |
| Days on IMV, mean (SD) | 5.2 (8.0) | 4.4 (3.6) | 8.1 (10.0) | .048 |
| Ventilación No Invasiva | 38 (3%) | 49 (20%) | 11 (15%) | <.001 |
| Proning | 12 (1%) | 0 (0%) | 0 (0%) | .267 |
| NM blockade | 9 (1%) | 1 (1%) | 1 (1%) | .556 |
| CRRT | 41 (3%) | 23 (9%) | 5 (7%) | <.001 |
| Preventive isolation | 131 (11%) | 71 (28%) | 24 (34%) | <.001 |
| Confirmed isolation (MDR) | 31 (3%) | 27 (11%) | 14 (20%) | <.001 |
| Parenteral nutrition | 76 (7%) | 19 (8%) | 10 (14%) | .061 |
| Complications, n (%) | ||||
| Reintubation | 10 (1%) | 7 (3%) | 1 (1%) | .044 |
| Traqueostomy | 28 (2%) | 8 (3%) | 2 (3%) | .682 |
| Delirium | 58 (5%) | 25 (10%) | 10 (14%) | <.001 |
| Acquired muscle weakness | 47 (4%) | 14 (86%) | 5 (7%) | .270 |
| Length-of-stay, mean (SD) | ||||
| Previous to ICU admission | 1.1 (3.4) | 2.9 (6.9) | 3.7 (7.1) | <.001 |
| ICU LOS | 3.9 (6.1) | 4.5 (4.6) | 5.4 (7.5) | <.001 |
| Hospital LOS | 9.2 (12.0) | 11.3 (13.8) | 12.7 (13.1) | <.001 |
| ICU readmission, n (%) | 31 (3%) | 12 (8%) | 4 (6%) | .082 |
| Mortality, n/N (%) | ||||
| ICU | 20/1121 (2%) | 21/229 (8%) | 6/65 (8%) | <.001 |
| Hospital | 29/1112 (3%) | 44/206 (18%) | 18/53 (25%) | <.001 |
Notes: Nonfrail CFS 0–3, prefrail CFS=4, Frail CFS>=5.
Acronyms: OF: organ failure; SD: standard deviation; IMV: invasive mechanical ventilation; NM: neuromuscular; CRRT: continuous renal replacement therapy; MDR: multidrug-resistant bacteria; LOS: length-of-stay; ICU: intensive care unit.
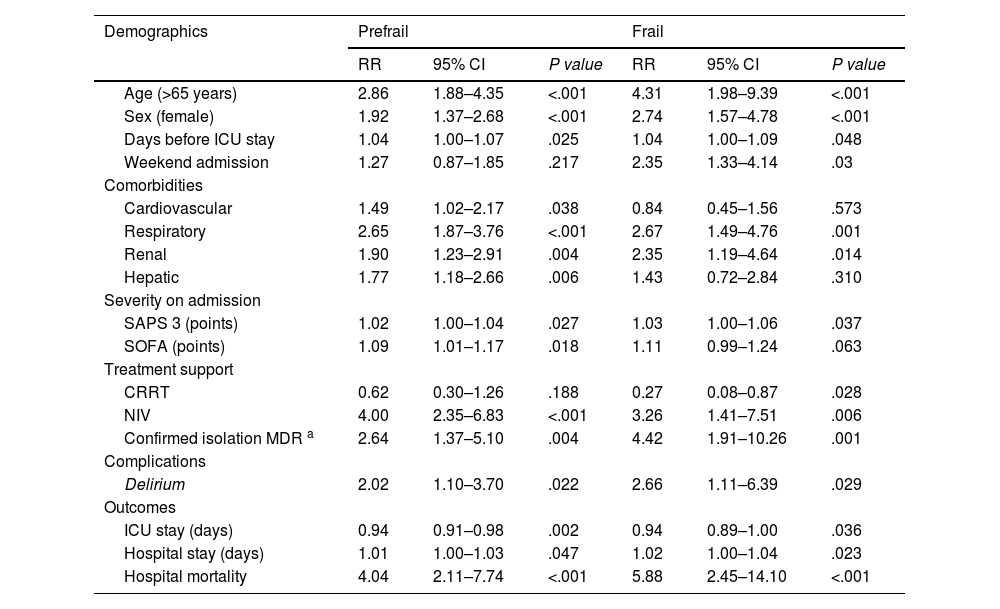
Results of multinomial logistic regression model exploring predictors of frailty and prefrailty.
| Demographics | Prefrail | Frail | ||||
|---|---|---|---|---|---|---|
| RR | 95% CI | P value | RR | 95% CI | P value | |
| Age (>65 years) | 2.86 | 1.88–4.35 | <.001 | 4.31 | 1.98–9.39 | <.001 |
| Sex (female) | 1.92 | 1.37–2.68 | <.001 | 2.74 | 1.57–4.78 | <.001 |
| Days before ICU stay | 1.04 | 1.00–1.07 | .025 | 1.04 | 1.00–1.09 | .048 |
| Weekend admission | 1.27 | 0.87–1.85 | .217 | 2.35 | 1.33–4.14 | .03 |
| Comorbidities | ||||||
| Cardiovascular | 1.49 | 1.02–2.17 | .038 | 0.84 | 0.45–1.56 | .573 |
| Respiratory | 2.65 | 1.87–3.76 | <.001 | 2.67 | 1.49–4.76 | .001 |
| Renal | 1.90 | 1.23–2.91 | .004 | 2.35 | 1.19–4.64 | .014 |
| Hepatic | 1.77 | 1.18–2.66 | .006 | 1.43 | 0.72–2.84 | .310 |
| Severity on admission | ||||||
| SAPS 3 (points) | 1.02 | 1.00–1.04 | .027 | 1.03 | 1.00–1.06 | .037 |
| SOFA (points) | 1.09 | 1.01–1.17 | .018 | 1.11 | 0.99–1.24 | .063 |
| Treatment support | ||||||
| CRRT | 0.62 | 0.30–1.26 | .188 | 0.27 | 0.08–0.87 | .028 |
| NIV | 4.00 | 2.35–6.83 | <.001 | 3.26 | 1.41–7.51 | .006 |
| Confirmed isolation MDR a | 2.64 | 1.37–5.10 | .004 | 4.42 | 1.91–10.26 | .001 |
| Complications | ||||||
| Delirium | 2.02 | 1.10–3.70 | .022 | 2.66 | 1.11–6.39 | .029 |
| Outcomes | ||||||
| ICU stay (days) | 0.94 | 0.91–0.98 | .002 | 0.94 | 0.89–1.00 | .036 |
| Hospital stay (days) | 1.01 | 1.00–1.03 | .047 | 1.02 | 1.00–1.04 | .023 |
| Hospital mortality | 4.04 | 2.11–7.74 | <.001 | 5.88 | 2.45–14.10 | <.001 |
Notes: nonfrail is the reference category.
Acronyms: ICU: intensive care unit; NIV: noninvasive ventilation; MDR: multidrug-resistant bacteria; SAPS 3: Simplified Acute Physiology Score 3; SOFA: Sequential Organ Failure Assessment. CRRT: continuous renal replacement therapy.
The results of the baseline characteristics of the bivariate analysis on categorization into nonfrail, prefrail and frail groups showed a tendency to be admitted on a weekend shift as the category increased (20% vs 27% vs 41%; P<.001), indicating a more significant presence of comorbidities and severity on admission (Table 1).
During ICU admission, frail and prefrail patients developed more organ failure, with respiratory failure being the most frequent (31% vs 56% vs 66%; P<.001). A higher therapeutic intensity was administered to higher categories, with an increased incidence of complications. The length of stay was longer, and mortality was greater, with no readmission differences (Table 2).
Variables with statistical significance were included in the multinomial logistic regression analysis (Table 3). Notably there was a high risk of in-hospital mortality in the prefrail group (RR 4.04, 95% CI 2.11–7.74; P<.001), and in the frail group (RR 5.88, 95% CI 2.45–14.10; P<.001). Other findings have included a higher risk of colonization by multidrug-resistant bacteria in patients older than 65 years and using noninvasive mechanical ventilation.
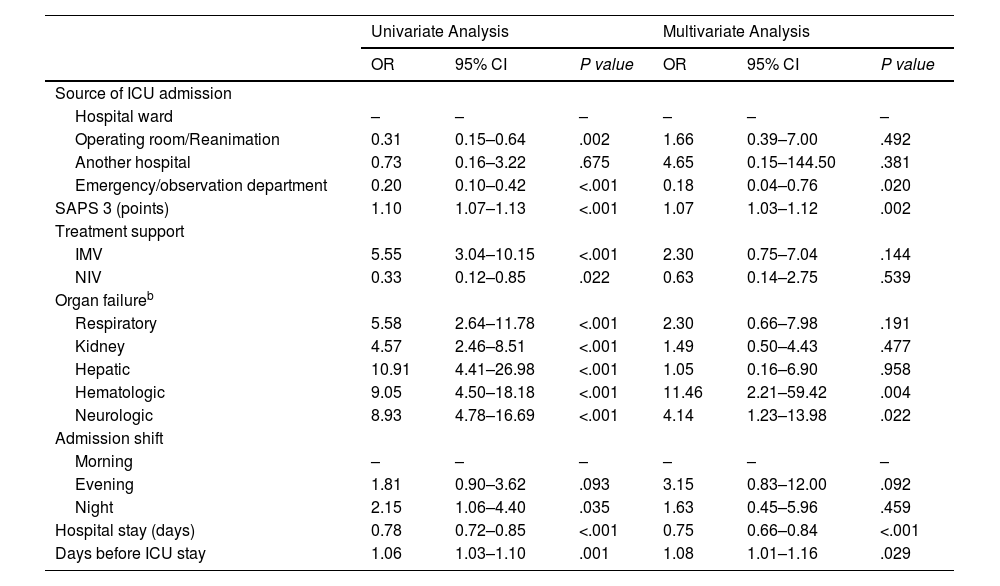
Factors associated with in-hospital mortality in prefragile and frail patientsAfter prefrail and frail patients were grouped into a single group (CFS≥4), a univariate model was performed, followed by a second multivariate analysis of in-hospital mortality. Both models are shown in parallel, and the statistical significance of each variable is shown in Table 4.
Multivariate logistic regression analysis exploring predictors of in-hospital mortality among frail patientsa.
| Univariate Analysis | Multivariate Analysis | |||||
|---|---|---|---|---|---|---|
| OR | 95% CI | P value | OR | 95% CI | P value | |
| Source of ICU admission | ||||||
| Hospital ward | – | – | – | – | – | – |
| Operating room/Reanimation | 0.31 | 0.15–0.64 | .002 | 1.66 | 0.39–7.00 | .492 |
| Another hospital | 0.73 | 0.16–3.22 | .675 | 4.65 | 0.15–144.50 | .381 |
| Emergency/observation department | 0.20 | 0.10–0.42 | <.001 | 0.18 | 0.04–0.76 | .020 |
| SAPS 3 (points) | 1.10 | 1.07–1.13 | <.001 | 1.07 | 1.03–1.12 | .002 |
| Treatment support | ||||||
| IMV | 5.55 | 3.04–10.15 | <.001 | 2.30 | 0.75–7.04 | .144 |
| NIV | 0.33 | 0.12–0.85 | .022 | 0.63 | 0.14–2.75 | .539 |
| Organ failureb | ||||||
| Respiratory | 5.58 | 2.64–11.78 | <.001 | 2.30 | 0.66–7.98 | .191 |
| Kidney | 4.57 | 2.46–8.51 | <.001 | 1.49 | 0.50–4.43 | .477 |
| Hepatic | 10.91 | 4.41–26.98 | <.001 | 1.05 | 0.16–6.90 | .958 |
| Hematologic | 9.05 | 4.50–18.18 | <.001 | 11.46 | 2.21–59.42 | .004 |
| Neurologic | 8.93 | 4.78–16.69 | <.001 | 4.14 | 1.23–13.98 | .022 |
| Admission shift | ||||||
| Morning | – | – | – | – | – | – |
| Evening | 1.81 | 0.90–3.62 | .093 | 3.15 | 0.83–12.00 | .092 |
| Night | 2.15 | 1.06–4.40 | .035 | 1.63 | 0.45–5.96 | .459 |
| Hospital stay (days) | 0.78 | 0.72–0.85 | <.001 | 0.75 | 0.66–0.84 | <.001 |
| Days before ICU stay | 1.06 | 1.03–1.10 | .001 | 1.08 | 1.01–1.16 | .029 |
Notes: Variables with P values <.05 in the univariate analysis were initially considered for the multivariate model. (-): reference category.
Acronyms: CI: confidence interval; IMV: invasive mechanical ventilation; NIV: noninvasive ventilation; ICU: intensive care unit; SAPS 3: Simplified Acute Physiology Score 3 test; OR: odds ratio.
The following factors were identified among the deceased patients: higher SAPS 3 score (RR 1.07, 95% CI 1.03–1.12; P=.002), days before ICU stay (RR 1.08, 95% CI 1.01–1.16; P=.029), hematological status (RR 11.46, 95% CI 2.21–59.42; P=.004) and neurological failure (RR 4.14, 95% CI 1.23–13.98; P=.022).
Following these findings, optimal cutoff points for prefrail and frail mortality were identified for the SAPS 3 score (64.5 points; 95% CI=63.6–65.4) and pre-ICU length of stay (4.5 days; 95% CI=1.6–7.4).
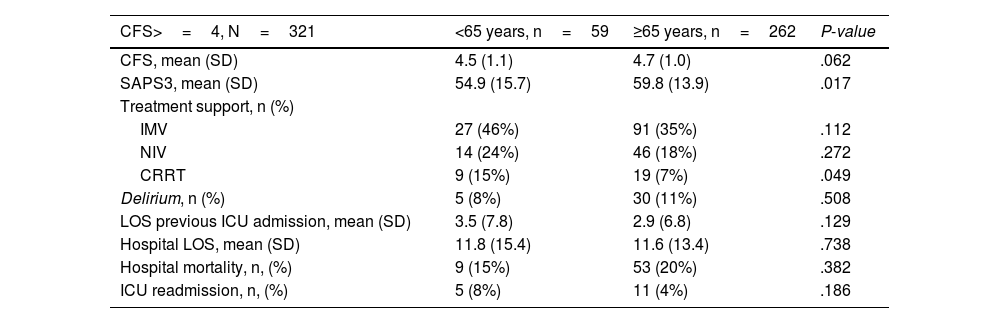
Differences between young and elderly frail patientsThe results of the bivariate analysis, which included prefrail and frail patients (CFS≥4) compared against two age categories, nonelderly (<65 years) vs elderly (≥65 years), are summarized in Table 5. The only difference found was the greater severity level at ICU admission in older adults (SAPS3 59.8±13.9 vs 54.9±15.7; P value=.017).
Comparison of outcomes of CFS>=4 patients according to age.
| CFS>=4, N=321 | <65 years, n=59 | ≥65 years, n=262 | P-value |
|---|---|---|---|
| CFS, mean (SD) | 4.5 (1.1) | 4.7 (1.0) | .062 |
| SAPS3, mean (SD) | 54.9 (15.7) | 59.8 (13.9) | .017 |
| Treatment support, n (%) | |||
| IMV | 27 (46%) | 91 (35%) | .112 |
| NIV | 14 (24%) | 46 (18%) | .272 |
| CRRT | 9 (15%) | 19 (7%) | .049 |
| Delirium, n (%) | 5 (8%) | 30 (11%) | .508 |
| LOS previous ICU admission, mean (SD) | 3.5 (7.8) | 2.9 (6.8) | .129 |
| Hospital LOS, mean (SD) | 11.8 (15.4) | 11.6 (13.4) | .738 |
| Hospital mortality, n, (%) | 9 (15%) | 53 (20%) | .382 |
| ICU readmission, n, (%) | 5 (8%) | 11 (4%) | .186 |
Notes: signification P-value <.05.
Acronyms: CFS: Clinical Frailty Scale; SAPS 3: Simplified Acute Physiology Score 3 test; SD: standard deviation; IMV: invasive mechanical ventilation; NIV: non-invasive ventilation; CRRT: continuous renal replacement therapy; ICU: intensive care unit.
Implementing CFS screening in the ICU and categorizing patients into three groups (nonfrail, prefrail, and frail) allowed us to evaluate prefrailty independently. Its prevalence is three times greater than that of frailty, and its predictive value for mortality and worse outcomes makes it a risk factor for high interest in critically ill patients. Our results suggest that a longer pre-ICU hospital stay, greater severity on admission and greater incidence of organ failure could explain the greater mortality found in prefrail and frail patients, as these conditions could be targets for action.
Cohort characteristicsThe prevalence of prefrailty and frailty in our cohort was 17% and 5%, respectively. This value varies according to the type of population and screening tools; similar data were observed in the study from the ANZICS,7 with a prevalence of 19%. The mean severity of the cohort at admission (SAPS 3, 48.3±14.5) was comparable to that documented in a European multicenter study.8
Role of prefrailty and frailty during ICU admission and mortality analysisWith respect to the demographic variables of prefrail and frail individuals, we obtained results comparable to those expected according to the literature, with strong associations with age, female sex and medical origin. Based on the multivariate analysis, ICU admission seems to be a minor prognostic factor for other conditions, such as organ severity at admission, which was also observed in a subanalysis of the VIP study.9
We evaluated the influence of comorbidities in the three categories, as their presence could influence patient recovery. Our results highlight the close relationship between the two conditions, with an increase in comorbidities but no statistical relationship with mortality, with respiratory comorbidity being the most strongly associated with the two categories, similar to the results obtained in young critically ill patients.10
These patients had an increased risk of being admitted during a weekend shift, having a longer ICU length of stay and having a worse clinical situation at admission. These findings are consistent with the current pathophysiological theory of frailty based on the decline in the multisystemic biological reserve that confers a state of vulnerability to stressors, becoming more evident on weekends when there is less hospital medical care.
Infection with multidrug-resistant bacteria was one of the most strongly associated characteristics, with a greater impact on frail individuals than on nonfrail individuals (RR 4.42, 95% CI 1.91–10.26; P=.001), with no increased mortality risk. This result may be explained by several factors typically described in this population, such as longer hospital length of stay or greater institutionalization and use of healthcare resources, which can lead to a patient profile characterized by a chronically altered inflammatory state.11 However, we have not investigated these factors, so these associations should be confirmed in future studies.
We found differences in the organ support administered between groups according to the multivariate model, with a higher risk of using noninvasive mechanical ventilation in the prefragile RR 4 (95% CI 2.35–6.83 P<.001) and frail RR 3.26 (1.41–7.51 P=.006) groups. Although significant differences were observed in the bivariate analysis, with a greater propensity for invasive mechanical ventilation as the category increased and more time on mechanical ventilation, these differences were not confirmed by multivariate analysis. No significant differences were observed in the other factors (reintubation rate and tracheostomy performance). When comparing the support applied to patients with a CFS≥4 according to the two age segments studied (≥65 years or <65 years), no differences were observed.
The intensity of ICU therapy in this population is inconsistent in the scientific literature. On the one hand, Muscedere et al.12 did not find differences between invasive ventilation and the need for vasoactive support. On the other hand, Darval et al.7 reported less use of invasive mechanical ventilation in more fragile patients than other organic supports. These variations could be due to differences in hospital practices, patient preferences, and cultural factors among the various countries.
The incidence of delirium increased with age in the complete cohort. It was the only complication associated with prefrailty and frailty. It should be noted that age did not affect the incidence of delirium within the CFS≥4 subgroup, so delirium also developed among young, frail and prefrail patients. Our unit applies a protocol for the prevention, diagnosis and early treatment of delirium based on e-CASH (comfort from analgesics, minimal sedatives and maximal human care)13Delirium is identified using the CAM-ICU14 every eight hours. Evidence is beginning to emerge pointing to frailty as a risk factor for the development of delirium in the ICU. In this regard, Darval et al.7 observed a greater incidence of delirium, especially in advanced-stage patients (those with a CFS≥6). This association seems relevant since the presentation of delirium in frail patients could delay recovery, leading to a poorer quality of life.15
In-hospital mortality was the factor with the strongest association with prefrailty and frailty, even in a cohort in which there was no age restriction. Accumulating evidence, mainly from observational studies, supports higher mortality in frail older patients admitted to the ICU. However, this mortality could be influenced by other factors. Darval et al.7 observed that younger frail patients (<50 years) had lower mortality than did those older than 50 years, accompanied by a high use of hospital resources and increased survival. However, this effect was not observed in all young age groups in the De Geer cohort.16 In addition, there is a greater tendency to apply life support limitation measures in frail older patients and severely ill individuals, with large variability in the number of such decisions according to age (13% in frail young patients vs 59% in elderly patients).16 According to our comparative analysis of patients with a CFS≥4, no statistically significant differences were observed in in-hospital mortality according to age, treatment intensity, complications, or mean CFS score. These findings should be interpreted cautiously, as the definition of frailty has been categorized and not graded by the CFS.
To further explore the increased risk of in-hospital mortality, we identified factors associated with in-hospital mortality. Two factors occurred before admission: hospital length of stay before ICU admission (cutpoint: 4.5 days; 95% CI: 1.6–7.4) and greater organ severity measured at admission (SAPS3 cutoff point: 64.5; 95% CI: 63.6–65.4). These results support those suggested in other studies, which recommend early identification of frailty to improve outcomes in older hospitalized patients17 and delayed ICU admission is a known risk factor for mortality. Our center performs critical care outreach seven days a week. Given these findings, we wondered whether this population suffers from delayed ICU admission compared to nonfragile patients, given that they were not previously identified. On the other hand, two factors occur during ICU admission: hematological and neurological deterioration. Frailty is currently considered a risk factor for major bleeding in older patients with ischemic heart disease, and mortality due to bleeding is increased.18 According to different scientific societies, an international consensus on managing the risk of bleeding and thrombosis in these patients is necessary. Concerning the development of neurological deterioration (GCS<=12), various studies have shown pathophysiological alterations that could support the association between frailty and the development of certain central nervous system disorders.19 We do not know whether these alterations are involved in the association between neurological impairment and mortality in frail patients.
Implications for the futureFrailty and prefrailty are common conditions at ICU admission, with lower levels of frailty and prefrailty being more frequent. Although worse outcomes have been associated with higher CFSs, nascent frailty status (CFS=4) is also associated with adverse outcomes, with worsening of symptoms in the ICU and greater in-hospital mortality. It would be beneficial to confirm these results in future studies, looking for answers regarding managing these patients before ICU admission: are we dealing with a population at greater risk of clinical deterioration on the ward?
Once organ deterioration has been established, our main objective should be to provide planned patient-centered care. Early recognition of these patients should then be a priority.
LimitationsThis study has limitations and strengths derived from its single-center observational design. On the one hand, this approach allowed us to control and directly supervise the recollection of our independent variable (CFS). On the other hand, the cohort size prevented us from analyzing the frailty spectrum (9 points), limiting the results. However, we consider it a strength to have included a categorization into three groups instead of two and to be able to identify the effect of prefrailty in patients admitted to the ICU without age limits.
ConclusionsLower levels of frailty are most frequently observed in patients admitted to the ICU. They are associated with worse health outcomes, highlighting an increased risk of in-hospital mortality. No differences were found according to age group. This underlines the importance of quantifying the degree of frailty in all patients admitted to the ICU regardless of age.
CRediT authorship contribution statementStudy design and conception: RML, FGV, and BLV.
Data acquisition: ITP, ISG, ANA, RML, BLV, FGV.
Analysis and interpretation: RML, FGV, and LPL.
Manuscript writing, critical revision, and final approval: all authors.
Ethical approval and consent to participateThe study was approved by the research ethics board of the University of Francisco de Vitoria (N°44) under the National Data Protection Law. All participants provided written informed consent to participate.
This study would have been able to be performed if we had not received complete support from the ICU staff. We would also like to make special mention of the Reasearch Unit of the Universidad Francisco de Vitoria.