


This study evaluates the predictive value of the lactate/albumin ratio (LAR) for all-cause mortality in cirrhosis patients.
DesignRetrospective observational study.
SettingIntensive care unit (ICU).
Patients or participants626 first-time ICU-admitted cirrhosis patients in the USA (MIMIC-IV v2.2).
InterventionsNone.
Main variables of interestLAR index, 28-day, and 90-day all-cause mortality.
ResultsOf 626 patients (60.86% male), 27.80% and 39.14% died within 28 and 90 days, respectively. Multivariate Cox analysis showed a significant association between higher LAR and mortality. Adjusted for confounders, elevated LAR increased the 28-day mortality risk [HR: 1.31 (1.21–1.42), P < 0.001]. A restricted cubic spline analysis revealed non-linear relationships between LAR and mortality. For 28-day mortality, the inflection point was 1.583: below this, HR was 2.29 (95% CI: 1.61–3.27, P < 0.001); above, HR was 1.16 (95% CI: 1.02–1.31, P = 0.021; P = 0.002). For 90-day mortality, the inflection point was 1.423: below, HR was 1.60 (95% CI: 1.04–2.47, P = 0.033); above, HR was 0.94 (95% CI: 0.75–1.16, P = 0.542; P = 0.012).
ConclusionsLAR predicts 28-day and 90-day mortality with a segmented effect. An LAR ≥1.583 signals high 28-day mortality risk, necessitating intensified monitoring and potential ICU admission. For 90-day mortality, LAR near 1.423 serves as an early warning for high-risk patients and guides interventions. Continuous LAR monitoring aids management, but prospective studies are needed to confirm clinical utility.
Evaluar el valor predictivo de la relación lactato/albumina (LAR) para la mortalidad en pacientes con cirrosis.
DiseñoEstudio observacional retrospectivo.
ÁmbitoUnidad de cuidados intensivos.
Pacientes o participantes626 pacientes con cirrosis ingresados por primera vez en la UCI en EE. UU. (MIMIC-IV v2.2).
IntervencionesNinguna.
Variables de interés principalesLAR, mortalidad a 28 y 90 días.
ResultadosDe los 626 pacientes (60.86% hombres), el 27.80% y 39.14% fallecieron en 28 y 90 días, respectivamente. El análisis de Cox mostró que un LAR alto se asocia con mayor mortalidad. Ajustando por factores de confusión, el riesgo a 28 días aumentó [HR: 1.31 (1.21–1.42), P < 0.001]. El análisis con splines cúbicos reveló relaciones no lineales. A los 28 días, el punto de inflexión fue 1.583: por debajo, HR fue 2.29 (IC 95%: 1.61–3.27, P < 0.001); por encima, HR fue 1.16 (IC 95%: 1.02–1.31, P = 0.021). A los 90 días, el punto fue 1.423: por debajo, HR fue 1.60 (IC 95%: 1.04–2.47, P = 0.033); por encima, HR fue 0.94 (IC 95%: 0.75–1.16, P = 0.542).
ConclusionesLAR predice la mortalidad a 28 y 90 días con un efecto segmentado. Un LAR ≥ 1.583 señala alto riesgo a 28 días, requiriendo mayor control y posible ingreso en UCI. A los 90 días, un LAR cercano a 1.423 actúa como advertencia temprana y guía intervenciones. La monitorización continua de LAR apoya la gestión clínica, pero se requieren estudios prospectivos para confirmar su utilidad.
Cirrhosis is a diffuse liver damage process and represents the end stage of most chronic liver diseases. Approximately 1.3 million people die annually from cirrhosis globally, making it the 11th leading cause of death worldwide and the third leading cause among individuals aged 45–64.1,2 Common causes include viral hepatitis, fatty liver, and chronic excessive alcohol consumption. Despite diverse causes, cirrhosis shares histopathological features such as hepatocyte degeneration, necrosis, fibrous tissue regeneration, and the replacement of liver parenchyma by regenerative nodules and fibrotic tissue, resulting in portal hypertension and compromised liver function.3,4
The prognosis of cirrhosis varies significantly, with 1-year mortality rates ranging from 1% to 57%, depending on clinical decompensation events.1 Decompensated cirrhosis patients often face severe complications, including variceal bleeding, ascites, and hepatic encephalopathy, which elevate morbidity and mortality risks.5 Studies indicate a median survival of about 2 years post-complication onset, underscoring the need for early disease severity assessment and intervention.2,5
Assessing cirrhosis severity typically involves liver biopsy and hepatic venous pressure gradient (HVPG) measurement, both invasive, costly procedures.6 Non-invasive systems like the Model for End-Stage Liver Disease (MELD) and Child-Pugh-Turcotte (CPT) scores predict prognosis but have limitations. The CPT score’s subjective nature of assessing ascites and hepatic encephalopathy severity in CPT scoring, where all variables are weighted equally, may not accurately reflect the actual impact of each variable on prognosis.7,8 The MELD score assigns regression coefficients to variables for a precise reflection of patient prognosis, but its complex bedside calculation and focus on end-stage patients may limit its clinical utility.8,9 Recent findings link sarcopenia to cirrhosis prognosis, but the lack of a unified diagnostic standard across regions and ethnicities hampers consistent evaluation.1,10
Lactic acid, indicative of anaerobic metabolism, reflects tissue hypoperfusion severity, with the liver clearing about 70% of it.11,12 Lactic acid levels predict the prognosis of organ failures and are vital for critically ill cirrhosis patients.11,12 Albumin, a liver-secreted protein, indicates systemic inflammation and nutritional status, with long-term supplementation improving survival in decompensated cirrhosis.13,14 Studies show the lactic acid/albumin ratio relates to critical illness prognoses, including sepsis, heart failure, and acute pancreatitis.15,16 The elevated lactate-to-albumin ratio in advanced liver cirrhosis primarily results from impaired liver function, which leads to reduced lactate clearance and diminished albumin synthesis. We conducted a retrospective cohort study using the Medical Information Mart for Intensive Care IV (MIMIC-IV) database to evaluate the LAR index’s role in predicting all-cause mortality in critically ill cirrhosis patients.
MethodsDatabase introductionThe data used in this study is sourced from the MIMIC-IV (v2.2) database, developed and managed by MIT’s Laboratory for Computational Physiology. This widely-used, large-scale database includes high-quality patient records from Beth Israel Deaconess Medical Center, covering the period from 2008 to 2019. It provides comprehensive patient information, including hospital stay duration, vital signs, lab test results, diagnostic details, and medication treatments. All personal information has been de-identified for privacy, so no patient consent or ethical approval is needed. Wensen Ren, an author of the study, has the necessary access and is responsible for data extraction.
Study population selection criteriaThe MIMIC-IV database contains 523,740 hospital admission records, including 73,181 first-time ICU admissions across medical, surgical, and other ICU types. Cirrhosis patients were identified based on the 9th and 10th editions of the International Classification of Diseases (ICD). The exclusion criteria were: (1) patients younger than 18 years at the time of first admission; (2) patients with multiple ICU admissions for cirrhosis, with only the first ICU admission included; (3) cancer patients; (4) patients with ICU stays shorter than 48 h; and (5) patients without blood lactate and serum albumin levels recorded within 24 h of admission. A total of 626 patients met the inclusion criteria (Fig. 1).

This study included all first-time ICU admissions of cirrhosis patients across different ICU types, such as medical, surgical, and trauma ICUs. The design aimed to better represent real-world clinical practice, improving the external validity of the results across various ICU settings. Although the diversity of ICU types may increase sample heterogeneity, it reflects the complexity of cirrhotic patients conditions and enables a more comprehensive evaluation of the relationship between LAR and mortality.
Data extractionData extraction was performed using PostgreSQL (version 16.1.1) and pgAdmin (version 4) through SQL. The lactate albumin ratio (LAR, mmol/L/g/dL) was chosen as the main variable, using initial blood lactate and serum albumin values measured after admission to minimize treatment interference. Extracted variables were categorized into five groups: demographic data (age, gender, race, weight, height, smoking status); vital signs (heart rate, respiratory rate, systolic and diastolic blood pressure, mean arterial pressure); comorbidities (atrial fibrillation, respiratory failure, sepsis, heart failure, diabetes, hypertension, renal disease); laboratory indicators (RBC, WBC, RDW, hemoglobin, platelets, serum sodium, serum potassium, total bilirubin, ALT, AST, serum creatinine, INR, lactate, albumin); and disease severity scores (APSIII, SAPS-II, LODS, SOFA). Follow-up started on the day of admission and continued up to 28 and 90 days post-admission. All laboratory variables and disease severity scores were extracted within 24 h of ICU entry. Variables with more than 5% missing values were excluded to avoid bias.
Endpoint eventsThe primary endpoint of the study was death from any cause within 28 and 90 days after admission. The 28-day and 90-day all-cause mortality rates were calculated as the total number of deaths during hospitalization within these periods divided by the total number of individuals in each group over the same duration.
Statistical analysisThe Kolmogorov–Smirnov test assessed the normality of continuous variables. Normally distributed variables were expressed as mean ± standard deviation (Mean ± SD), while non-normally distributed variables were reported as the median and interquartile range (IQR). Categorical variables were presented as frequency and percentage. For normally distributed variables, t-tests or analysis of variance (ANOVA) were applied. For non-normally distributed variables, the Mann–Whitney U test or Chi-square test was used. LAR was treated as a continuous variable, with patients divided into three groups based on tertiles. Kaplan–Meier survival analysis evaluated event rates across these groups, and the log-rank test assessed differences between them. Cox proportional hazards regression analyzed the independent effect of LAR on outcomes, providing hazard ratios (HR) with 95% confidence intervals (CI). This study adhered to STROBE guidelines, adjusting multiple models to control for confounders. Model 1 provided unadjusted results. Model 2 adjusted for key demographic variables—age, sex, and race—widely recognized in the literature as relevant confounders linked to mortality. These adjustments improved model robustness by reducing their potential influence on the relationship between LAR and mortality. Model 3 was based on Model 2 and incorporated additional potential confounders identified through the change-in-estimate (CIE) method. Confounders causing over a 10% change in the regression coefficient were included to retain only significant factors, minimizing bias.17–19 Restricted cubic spline analysis explored the non-linear relationship between LAR and 28-day/90-day all-cause mortality. Threshold effect methods and likelihood ratio tests identified threshold points. Subgroup analysis used stratified Cox regression, adjusting for the same confounders as Model 3, with subgroup interactions tested via likelihood ratio tests (LRT). A forest plot illustrated subgroup analysis results. All analyses were performed in R (version 4.0.5), with two-sided P-values <0.05 considered statistically significant.
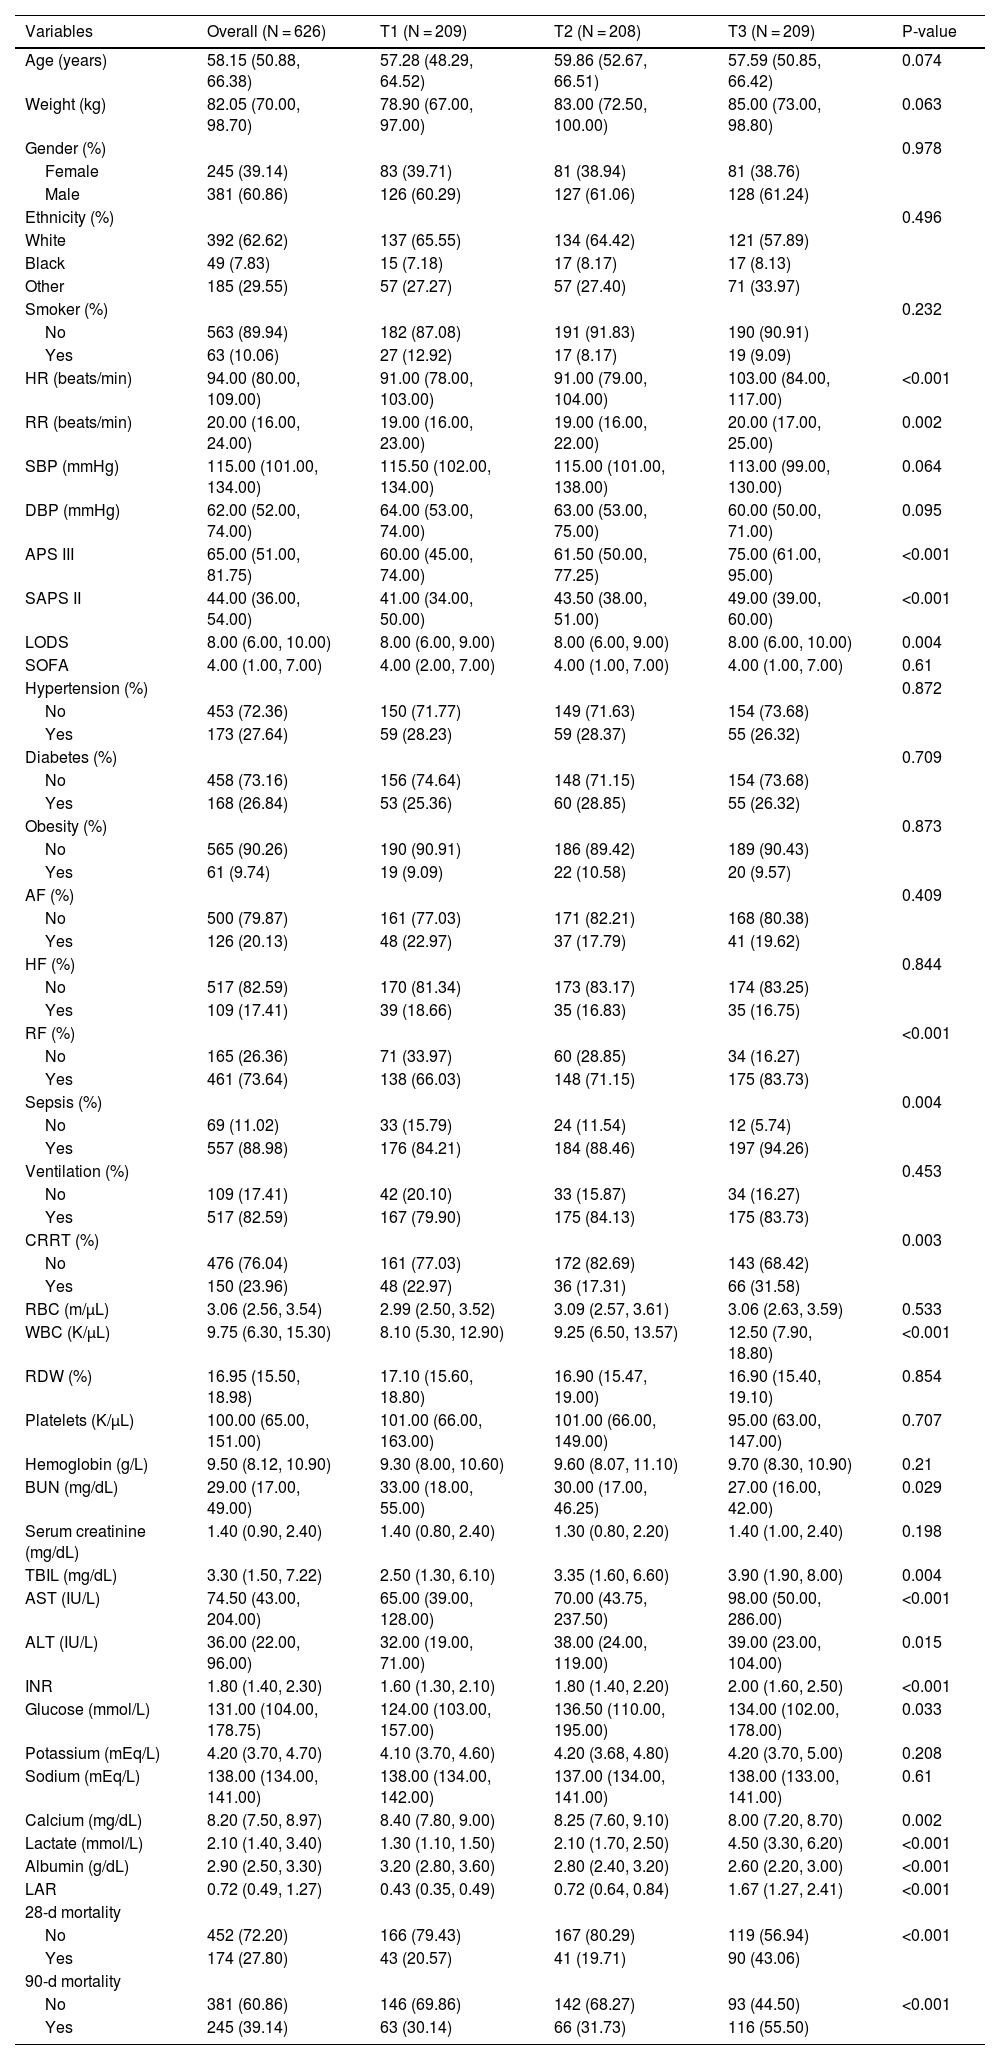
ResultsThis study included 626 critically ill patients with liver cirrhosis, comprising 381 males (60.86%) and 245 females (39.14%). The median age of the patients was 58.15 years (IQR: 50.88–66.38). The median LAR index for all participants was 0.72 (IQR: 0.49–1.27). The mortality rate at 28 days post-admission was 27.80%, while the 90-day mortality rate was 39.14% (Table 1).
Characteristics and outcomes of participants categorized by LAR index.a
| Variables | Overall (N = 626) | T1 (N = 209) | T2 (N = 208) | T3 (N = 209) | P-value |
|---|---|---|---|---|---|
| Age (years) | 58.15 (50.88, 66.38) | 57.28 (48.29, 64.52) | 59.86 (52.67, 66.51) | 57.59 (50.85, 66.42) | 0.074 |
| Weight (kg) | 82.05 (70.00, 98.70) | 78.90 (67.00, 97.00) | 83.00 (72.50, 100.00) | 85.00 (73.00, 98.80) | 0.063 |
| Gender (%) | 0.978 | ||||
| Female | 245 (39.14) | 83 (39.71) | 81 (38.94) | 81 (38.76) | |
| Male | 381 (60.86) | 126 (60.29) | 127 (61.06) | 128 (61.24) | |
| Ethnicity (%) | 0.496 | ||||
| White | 392 (62.62) | 137 (65.55) | 134 (64.42) | 121 (57.89) | |
| Black | 49 (7.83) | 15 (7.18) | 17 (8.17) | 17 (8.13) | |
| Other | 185 (29.55) | 57 (27.27) | 57 (27.40) | 71 (33.97) | |
| Smoker (%) | 0.232 | ||||
| No | 563 (89.94) | 182 (87.08) | 191 (91.83) | 190 (90.91) | |
| Yes | 63 (10.06) | 27 (12.92) | 17 (8.17) | 19 (9.09) | |
| HR (beats/min) | 94.00 (80.00, 109.00) | 91.00 (78.00, 103.00) | 91.00 (79.00, 104.00) | 103.00 (84.00, 117.00) | <0.001 |
| RR (beats/min) | 20.00 (16.00, 24.00) | 19.00 (16.00, 23.00) | 19.00 (16.00, 22.00) | 20.00 (17.00, 25.00) | 0.002 |
| SBP (mmHg) | 115.00 (101.00, 134.00) | 115.50 (102.00, 134.00) | 115.00 (101.00, 138.00) | 113.00 (99.00, 130.00) | 0.064 |
| DBP (mmHg) | 62.00 (52.00, 74.00) | 64.00 (53.00, 74.00) | 63.00 (53.00, 75.00) | 60.00 (50.00, 71.00) | 0.095 |
| APS III | 65.00 (51.00, 81.75) | 60.00 (45.00, 74.00) | 61.50 (50.00, 77.25) | 75.00 (61.00, 95.00) | <0.001 |
| SAPS II | 44.00 (36.00, 54.00) | 41.00 (34.00, 50.00) | 43.50 (38.00, 51.00) | 49.00 (39.00, 60.00) | <0.001 |
| LODS | 8.00 (6.00, 10.00) | 8.00 (6.00, 9.00) | 8.00 (6.00, 9.00) | 8.00 (6.00, 10.00) | 0.004 |
| SOFA | 4.00 (1.00, 7.00) | 4.00 (2.00, 7.00) | 4.00 (1.00, 7.00) | 4.00 (1.00, 7.00) | 0.61 |
| Hypertension (%) | 0.872 | ||||
| No | 453 (72.36) | 150 (71.77) | 149 (71.63) | 154 (73.68) | |
| Yes | 173 (27.64) | 59 (28.23) | 59 (28.37) | 55 (26.32) | |
| Diabetes (%) | 0.709 | ||||
| No | 458 (73.16) | 156 (74.64) | 148 (71.15) | 154 (73.68) | |
| Yes | 168 (26.84) | 53 (25.36) | 60 (28.85) | 55 (26.32) | |
| Obesity (%) | 0.873 | ||||
| No | 565 (90.26) | 190 (90.91) | 186 (89.42) | 189 (90.43) | |
| Yes | 61 (9.74) | 19 (9.09) | 22 (10.58) | 20 (9.57) | |
| AF (%) | 0.409 | ||||
| No | 500 (79.87) | 161 (77.03) | 171 (82.21) | 168 (80.38) | |
| Yes | 126 (20.13) | 48 (22.97) | 37 (17.79) | 41 (19.62) | |
| HF (%) | 0.844 | ||||
| No | 517 (82.59) | 170 (81.34) | 173 (83.17) | 174 (83.25) | |
| Yes | 109 (17.41) | 39 (18.66) | 35 (16.83) | 35 (16.75) | |
| RF (%) | <0.001 | ||||
| No | 165 (26.36) | 71 (33.97) | 60 (28.85) | 34 (16.27) | |
| Yes | 461 (73.64) | 138 (66.03) | 148 (71.15) | 175 (83.73) | |
| Sepsis (%) | 0.004 | ||||
| No | 69 (11.02) | 33 (15.79) | 24 (11.54) | 12 (5.74) | |
| Yes | 557 (88.98) | 176 (84.21) | 184 (88.46) | 197 (94.26) | |
| Ventilation (%) | 0.453 | ||||
| No | 109 (17.41) | 42 (20.10) | 33 (15.87) | 34 (16.27) | |
| Yes | 517 (82.59) | 167 (79.90) | 175 (84.13) | 175 (83.73) | |
| CRRT (%) | 0.003 | ||||
| No | 476 (76.04) | 161 (77.03) | 172 (82.69) | 143 (68.42) | |
| Yes | 150 (23.96) | 48 (22.97) | 36 (17.31) | 66 (31.58) | |
| RBC (m/µL) | 3.06 (2.56, 3.54) | 2.99 (2.50, 3.52) | 3.09 (2.57, 3.61) | 3.06 (2.63, 3.59) | 0.533 |
| WBC (K/µL) | 9.75 (6.30, 15.30) | 8.10 (5.30, 12.90) | 9.25 (6.50, 13.57) | 12.50 (7.90, 18.80) | <0.001 |
| RDW (%) | 16.95 (15.50, 18.98) | 17.10 (15.60, 18.80) | 16.90 (15.47, 19.00) | 16.90 (15.40, 19.10) | 0.854 |
| Platelets (K/µL) | 100.00 (65.00, 151.00) | 101.00 (66.00, 163.00) | 101.00 (66.00, 149.00) | 95.00 (63.00, 147.00) | 0.707 |
| Hemoglobin (g/L) | 9.50 (8.12, 10.90) | 9.30 (8.00, 10.60) | 9.60 (8.07, 11.10) | 9.70 (8.30, 10.90) | 0.21 |
| BUN (mg/dL) | 29.00 (17.00, 49.00) | 33.00 (18.00, 55.00) | 30.00 (17.00, 46.25) | 27.00 (16.00, 42.00) | 0.029 |
| Serum creatinine (mg/dL) | 1.40 (0.90, 2.40) | 1.40 (0.80, 2.40) | 1.30 (0.80, 2.20) | 1.40 (1.00, 2.40) | 0.198 |
| TBIL (mg/dL) | 3.30 (1.50, 7.22) | 2.50 (1.30, 6.10) | 3.35 (1.60, 6.60) | 3.90 (1.90, 8.00) | 0.004 |
| AST (IU/L) | 74.50 (43.00, 204.00) | 65.00 (39.00, 128.00) | 70.00 (43.75, 237.50) | 98.00 (50.00, 286.00) | <0.001 |
| ALT (IU/L) | 36.00 (22.00, 96.00) | 32.00 (19.00, 71.00) | 38.00 (24.00, 119.00) | 39.00 (23.00, 104.00) | 0.015 |
| INR | 1.80 (1.40, 2.30) | 1.60 (1.30, 2.10) | 1.80 (1.40, 2.20) | 2.00 (1.60, 2.50) | <0.001 |
| Glucose (mmol/L) | 131.00 (104.00, 178.75) | 124.00 (103.00, 157.00) | 136.50 (110.00, 195.00) | 134.00 (102.00, 178.00) | 0.033 |
| Potassium (mEq/L) | 4.20 (3.70, 4.70) | 4.10 (3.70, 4.60) | 4.20 (3.68, 4.80) | 4.20 (3.70, 5.00) | 0.208 |
| Sodium (mEq/L) | 138.00 (134.00, 141.00) | 138.00 (134.00, 142.00) | 137.00 (134.00, 141.00) | 138.00 (133.00, 141.00) | 0.61 |
| Calcium (mg/dL) | 8.20 (7.50, 8.97) | 8.40 (7.80, 9.00) | 8.25 (7.60, 9.10) | 8.00 (7.20, 8.70) | 0.002 |
| Lactate (mmol/L) | 2.10 (1.40, 3.40) | 1.30 (1.10, 1.50) | 2.10 (1.70, 2.50) | 4.50 (3.30, 6.20) | <0.001 |
| Albumin (g/dL) | 2.90 (2.50, 3.30) | 3.20 (2.80, 3.60) | 2.80 (2.40, 3.20) | 2.60 (2.20, 3.00) | <0.001 |
| LAR | 0.72 (0.49, 1.27) | 0.43 (0.35, 0.49) | 0.72 (0.64, 0.84) | 1.67 (1.27, 2.41) | <0.001 |
| 28-d mortality | |||||
| No | 452 (72.20) | 166 (79.43) | 167 (80.29) | 119 (56.94) | <0.001 |
| Yes | 174 (27.80) | 43 (20.57) | 41 (19.71) | 90 (43.06) | |
| 90-d mortality | |||||
| No | 381 (60.86) | 146 (69.86) | 142 (68.27) | 93 (44.50) | <0.001 |
| Yes | 245 (39.14) | 63 (30.14) | 66 (31.73) | 116 (55.50) |
Abbreviations: HR, heart rate; RR, respiratory rate; SBP, Systolic Blood Pressure; DBP, diastolic blood pressure; APS III, Acute Physiology Score III; SAPS II, Simplified Acute Physiology Score II; LODS, Logistic Organ Dysfunction System; SOFA, Sequential Organ Failure Assessment; AF, atrial fibrillation; HF, heart failure; RF, respiratory failure; CRRT, Continuous Renal Replacement Therapy; RBC, Red Blood Cell; WBC; White Blood Cell; RDW, Red Blood Cell Distribution Width; BUN, Blood Urea Nitrogen; TBIL, total bilirubin; AST, Aspartate Aminotransferase; ALT, Alanine Aminotransferase; INR, international normalized ratio; LAR, lactate/albumin ratio.
The baseline characteristics of critically ill patients with liver cirrhosis, categorized by tertiles of the LAR index, are presented in Table 1. Patients were divided into three groups based on admission LAR index levels: T1 (0.1538–0.5652), T2 (0.5667–1.0286), and T3 (1.037–10.600). The median LAR index values for each tertile were 0.43 (IQR: 0.35–0.49), 0.72 (IQR: 0.64–0.84), and 1.67 (IQR: 1.27–2.41), respectively.
Patients in the highest LAR index tertile exhibited higher heart and respiratory rates upon admission, higher disease severity scores, and higher incidences of renal failure and sepsis compared to those in the lower tertiles. Additionally, these patients had higher white blood cell counts, AST, and INR values. The highest tertile group had significantly increased 28-day mortality rates (20.57% vs. 19.71% vs. 43.06%, p < 0.001) and significantly higher 90-day mortality rates (30.14% vs. 31.73% vs. 55.50%, p < 0.001) compared to the lower tertile.
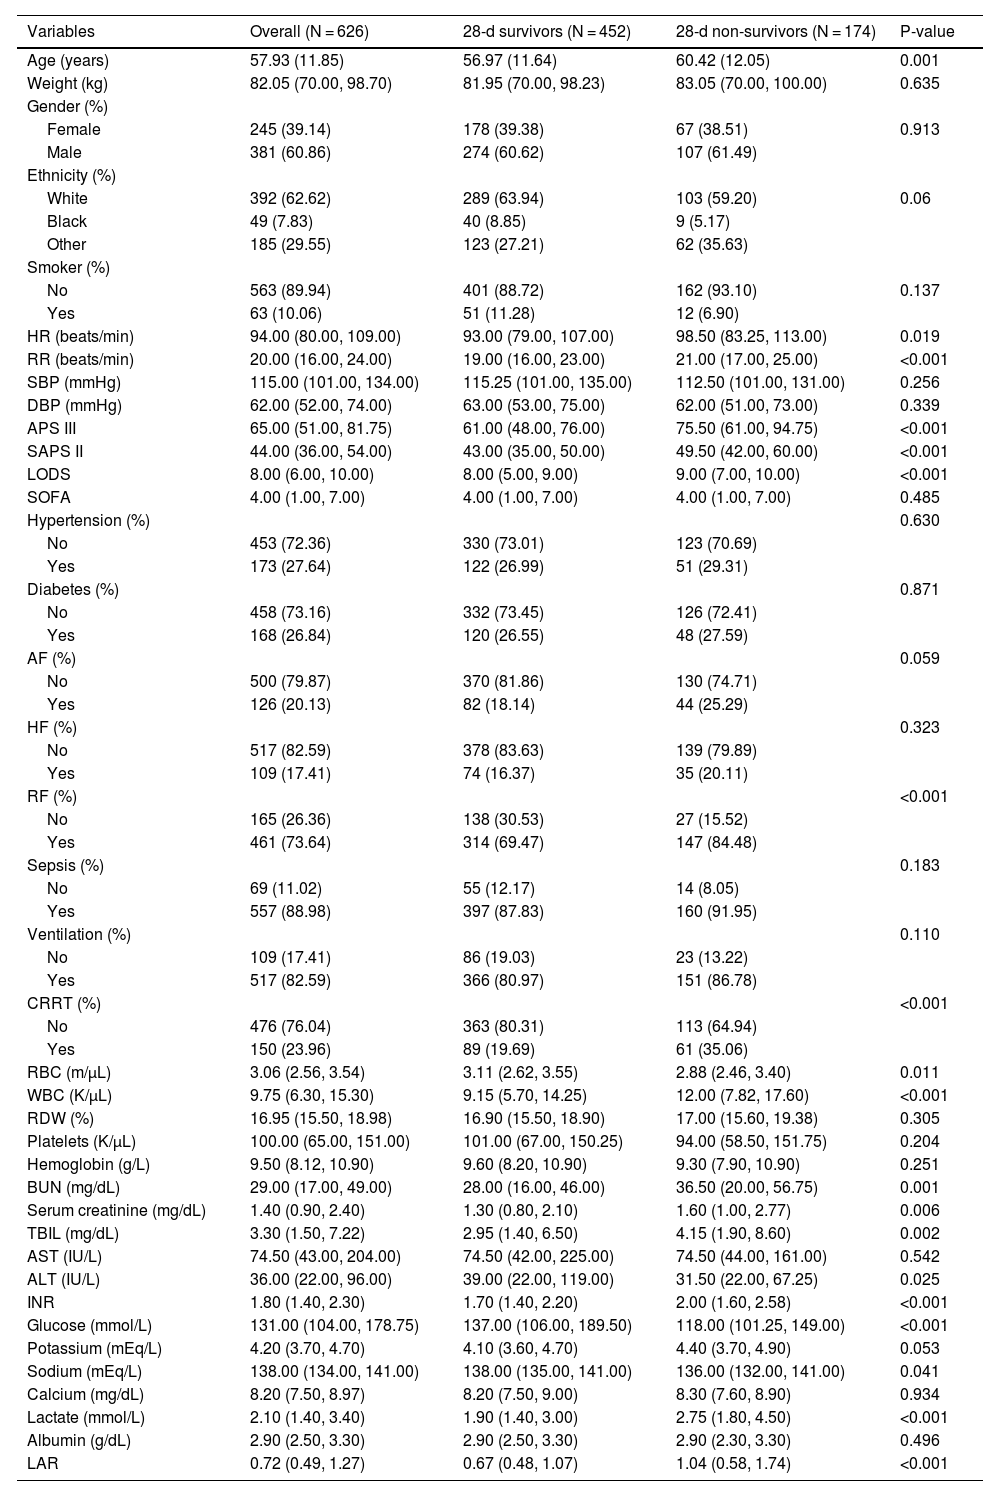
Table 2 presents the baseline characteristics of survivors and non-survivors within 28 days of admission. Non-survivors were older and had higher disease severity scores, higher rates of renal failure, higher white blood cell counts, INA, TIBI, and BUN values, and lower blood glucose and red blood cell counts. The LAR index was significantly higher in the non-survivor group compared to the survivor group (0.67 vs. 1.04, p < 0.001). Supplementary 1 displays the differences in baseline characteristics between survivors and non-survivors within 90 days of admission, showing similar disease characteristics in the non-survivor group within 28 days of admission.
Baseline characteristics of the 28-d survivors and 28-d non-survivors groups.
| Variables | Overall (N = 626) | 28-d survivors (N = 452) | 28-d non-survivors (N = 174) | P-value |
|---|---|---|---|---|
| Age (years) | 57.93 (11.85) | 56.97 (11.64) | 60.42 (12.05) | 0.001 |
| Weight (kg) | 82.05 (70.00, 98.70) | 81.95 (70.00, 98.23) | 83.05 (70.00, 100.00) | 0.635 |
| Gender (%) | ||||
| Female | 245 (39.14) | 178 (39.38) | 67 (38.51) | 0.913 |
| Male | 381 (60.86) | 274 (60.62) | 107 (61.49) | |
| Ethnicity (%) | ||||
| White | 392 (62.62) | 289 (63.94) | 103 (59.20) | 0.06 |
| Black | 49 (7.83) | 40 (8.85) | 9 (5.17) | |
| Other | 185 (29.55) | 123 (27.21) | 62 (35.63) | |
| Smoker (%) | ||||
| No | 563 (89.94) | 401 (88.72) | 162 (93.10) | 0.137 |
| Yes | 63 (10.06) | 51 (11.28) | 12 (6.90) | |
| HR (beats/min) | 94.00 (80.00, 109.00) | 93.00 (79.00, 107.00) | 98.50 (83.25, 113.00) | 0.019 |
| RR (beats/min) | 20.00 (16.00, 24.00) | 19.00 (16.00, 23.00) | 21.00 (17.00, 25.00) | <0.001 |
| SBP (mmHg) | 115.00 (101.00, 134.00) | 115.25 (101.00, 135.00) | 112.50 (101.00, 131.00) | 0.256 |
| DBP (mmHg) | 62.00 (52.00, 74.00) | 63.00 (53.00, 75.00) | 62.00 (51.00, 73.00) | 0.339 |
| APS III | 65.00 (51.00, 81.75) | 61.00 (48.00, 76.00) | 75.50 (61.00, 94.75) | <0.001 |
| SAPS II | 44.00 (36.00, 54.00) | 43.00 (35.00, 50.00) | 49.50 (42.00, 60.00) | <0.001 |
| LODS | 8.00 (6.00, 10.00) | 8.00 (5.00, 9.00) | 9.00 (7.00, 10.00) | <0.001 |
| SOFA | 4.00 (1.00, 7.00) | 4.00 (1.00, 7.00) | 4.00 (1.00, 7.00) | 0.485 |
| Hypertension (%) | 0.630 | |||
| No | 453 (72.36) | 330 (73.01) | 123 (70.69) | |
| Yes | 173 (27.64) | 122 (26.99) | 51 (29.31) | |
| Diabetes (%) | 0.871 | |||
| No | 458 (73.16) | 332 (73.45) | 126 (72.41) | |
| Yes | 168 (26.84) | 120 (26.55) | 48 (27.59) | |
| AF (%) | 0.059 | |||
| No | 500 (79.87) | 370 (81.86) | 130 (74.71) | |
| Yes | 126 (20.13) | 82 (18.14) | 44 (25.29) | |
| HF (%) | 0.323 | |||
| No | 517 (82.59) | 378 (83.63) | 139 (79.89) | |
| Yes | 109 (17.41) | 74 (16.37) | 35 (20.11) | |
| RF (%) | <0.001 | |||
| No | 165 (26.36) | 138 (30.53) | 27 (15.52) | |
| Yes | 461 (73.64) | 314 (69.47) | 147 (84.48) | |
| Sepsis (%) | 0.183 | |||
| No | 69 (11.02) | 55 (12.17) | 14 (8.05) | |
| Yes | 557 (88.98) | 397 (87.83) | 160 (91.95) | |
| Ventilation (%) | 0.110 | |||
| No | 109 (17.41) | 86 (19.03) | 23 (13.22) | |
| Yes | 517 (82.59) | 366 (80.97) | 151 (86.78) | |
| CRRT (%) | <0.001 | |||
| No | 476 (76.04) | 363 (80.31) | 113 (64.94) | |
| Yes | 150 (23.96) | 89 (19.69) | 61 (35.06) | |
| RBC (m/µL) | 3.06 (2.56, 3.54) | 3.11 (2.62, 3.55) | 2.88 (2.46, 3.40) | 0.011 |
| WBC (K/µL) | 9.75 (6.30, 15.30) | 9.15 (5.70, 14.25) | 12.00 (7.82, 17.60) | <0.001 |
| RDW (%) | 16.95 (15.50, 18.98) | 16.90 (15.50, 18.90) | 17.00 (15.60, 19.38) | 0.305 |
| Platelets (K/µL) | 100.00 (65.00, 151.00) | 101.00 (67.00, 150.25) | 94.00 (58.50, 151.75) | 0.204 |
| Hemoglobin (g/L) | 9.50 (8.12, 10.90) | 9.60 (8.20, 10.90) | 9.30 (7.90, 10.90) | 0.251 |
| BUN (mg/dL) | 29.00 (17.00, 49.00) | 28.00 (16.00, 46.00) | 36.50 (20.00, 56.75) | 0.001 |
| Serum creatinine (mg/dL) | 1.40 (0.90, 2.40) | 1.30 (0.80, 2.10) | 1.60 (1.00, 2.77) | 0.006 |
| TBIL (mg/dL) | 3.30 (1.50, 7.22) | 2.95 (1.40, 6.50) | 4.15 (1.90, 8.60) | 0.002 |
| AST (IU/L) | 74.50 (43.00, 204.00) | 74.50 (42.00, 225.00) | 74.50 (44.00, 161.00) | 0.542 |
| ALT (IU/L) | 36.00 (22.00, 96.00) | 39.00 (22.00, 119.00) | 31.50 (22.00, 67.25) | 0.025 |
| INR | 1.80 (1.40, 2.30) | 1.70 (1.40, 2.20) | 2.00 (1.60, 2.58) | <0.001 |
| Glucose (mmol/L) | 131.00 (104.00, 178.75) | 137.00 (106.00, 189.50) | 118.00 (101.25, 149.00) | <0.001 |
| Potassium (mEq/L) | 4.20 (3.70, 4.70) | 4.10 (3.60, 4.70) | 4.40 (3.70, 4.90) | 0.053 |
| Sodium (mEq/L) | 138.00 (134.00, 141.00) | 138.00 (135.00, 141.00) | 136.00 (132.00, 141.00) | 0.041 |
| Calcium (mg/dL) | 8.20 (7.50, 8.97) | 8.20 (7.50, 9.00) | 8.30 (7.60, 8.90) | 0.934 |
| Lactate (mmol/L) | 2.10 (1.40, 3.40) | 1.90 (1.40, 3.00) | 2.75 (1.80, 4.50) | <0.001 |
| Albumin (g/dL) | 2.90 (2.50, 3.30) | 2.90 (2.50, 3.30) | 2.90 (2.30, 3.30) | 0.496 |
| LAR | 0.72 (0.49, 1.27) | 0.67 (0.48, 1.07) | 1.04 (0.58, 1.74) | <0.001 |
Abbreviations: HR, heart rate; RR, respiratory rate; SBP, Systolic Blood Pressure; DBP, diastolic blood pressure; APS III, Acute Physiology Score III; SAPS II, Simplified Acute Physiology Score II; LODS, Logistic Organ Dysfunction System; SOFA, Sequential Organ Failure Assessment; AF, atrial fibrillation; HF, heart failure; RF, respiratory failure; CRRT, Continuous Renal Replacement Therapy; RBC, red blood cell; WBC; white blood cell; RDW, Red Blood Cell Distribution Width; BUN, Blood Urea Nitrogen; TBIL, total bilirubin; AST, Aspartate Aminotransferase; ALT, Alanine Aminotransferase; INR, international normalized ratio; LAR, lactate/albumin ratio.
Kaplan–Meier survival analysis curves were used to analyze the primary outcomes among groups based on tertiles of the LAR index, as shown in Fig. 2. Patients in the highest LAR index group (T3) had a higher risk of death at 28 and 90 days post-admission, with significant differences compared to the T1 and T2 groups (p < 0.001).
. Kaplan–Meier curves showing cumulative probability of all-cause mortality according to groups at 90-days post-admission (B). Footnote LAR index terxile: T1 (0.1538–0.5652), T2 (0.5667–1.0286), and T3 (1.037–10.600).")
Kaplan–Meier curves showing cumulative probability of all-cause mortality according to groups at 28-days post-admission (A). Kaplan–Meier curves showing cumulative probability of all-cause mortality according to groups at 90-days post-admission (B). Footnote LAR index terxile: T1 (0.1538–0.5652), T2 (0.5667–1.0286), and T3 (1.037–10.600).
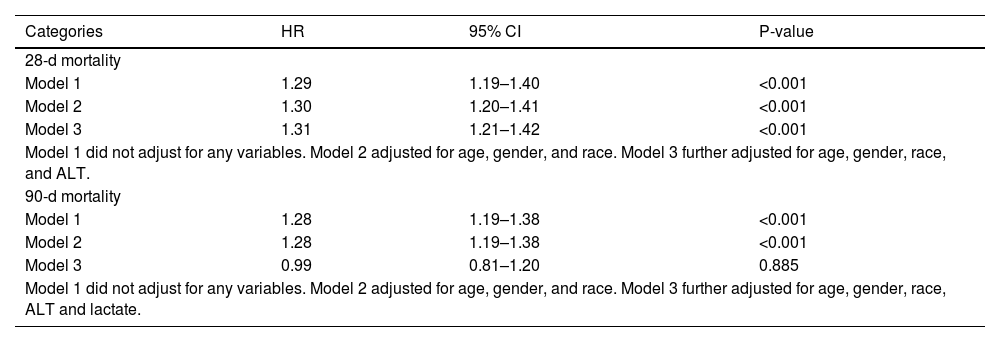
We utilized a multivariate Cox proportional hazards model to develop three distinct models, each examining the relationship between the LAR and all-cause mortality within 28 days of ICU admission (Table 3). Model 1 was unadjusted; Model 2 was partially adjusted for age, gender, and race; and Model 3 was fully adjusted for age, gender, race, and ALT. The results demonstrated that, at the 28-day observation point, the LAR index was a significant risk factor across all models: HR = 1.29 (95% CI: 1.19–1.40, P < 0.001) in the unadjusted model; HR = 1.30 (95% CI: 1.20–1.41, P < 0.001) in the partially adjusted model; and HR = 1.31 (95% CI: 1.21–1.42, P < 0.001) in the fully adjusted model.
Cox proportional hazard ratios (HR) for all-cause mortality.
| Categories | HR | 95% CI | P-value |
|---|---|---|---|
| 28-d mortality | |||
| Model 1 | 1.29 | 1.19–1.40 | <0.001 |
| Model 2 | 1.30 | 1.20–1.41 | <0.001 |
| Model 3 | 1.31 | 1.21–1.42 | <0.001 |
| Model 1 did not adjust for any variables. Model 2 adjusted for age, gender, and race. Model 3 further adjusted for age, gender, race, and ALT. | |||
| 90-d mortality | |||
| Model 1 | 1.28 | 1.19–1.38 | <0.001 |
| Model 2 | 1.28 | 1.19–1.38 | <0.001 |
| Model 3 | 0.99 | 0.81–1.20 | 0.885 |
| Model 1 did not adjust for any variables. Model 2 adjusted for age, gender, and race. Model 3 further adjusted for age, gender, race, ALT and lactate. | |||
Abbreviations: HR: hazard ratio, CI: confidence interval.
To assess the relationship between the LAR index and all-cause mortality within 90 days of admission, we constructed three additional models (Table 3). Model 1 was unadjusted; Model 2 was adjusted for age, gender, and race; and Model 3 was adjusted for age, gender, race, ALT, and lactate. At the 90-day observation point, the LAR index was significantly associated with mortality in Models 1 and 2. However, in Model 3, the LAR index did not significantly impact 90-day all-cause mortality, with HR = 0.99 (95% CI: 0.81–1.20, P = 0.885).
A restricted cubic spline smoothing function was employed to analyze the association between the LAR index and mortality outcomes at 28 and 90 days post-admission. At the 28-day mark, all-cause mortality risk showed a non-linear increase with the LAR index, exhibiting a saturation threshold effect (Fig. 3A). Below an LAR index of 1.583, each unit increase significantly elevated mortality risk among cirrhosis patients by approximately 2.29 times (HR: 2.29, 95% CI: 1.61–3.27, P < 0.001); above this threshold, the increase remained significant but to a lesser extent, approximately 1.16 times (HR: 1.16, 95% CI: 1.02–1.31, P = 0.021). The likelihood ratio test yielded a P-value of 0.002. By the 90-day mark, the identified LAR threshold was 1.423. Below this threshold, each unit increase in the LAR index significantly raised mortality risk by 1.60 times (HR: 1.60, 95% CI: 1.04–2.47, P = 0.033); above it, mortality risk slightly decreased without statistical significance (HR: 0.94, 95% CI: 0.75–1.16, P = 0.542). The likelihood ratio test result was 0.012 (Fig. 3B).
Subgroup analysis. Restricted cubic spline for 90-day post-admission mortality (B).")
Supplementary 2 illustrates the relationship between LAR and 28-day all-cause mortality in cirrhosis patients across various subgroups. Stratified analyses by sex, age, hypertension, diabetes, obesity, atrial fibrillation, heart failure, renal failure, and sepsis revealed no significant interactions (interaction P: 0.179–0.868). Similarly, Supplementary 3 shows LAR’s performance in predicting 90-day all-cause mortality, with no significant interactions identified in the stratified analysis (interaction P: 0.101–0.928). These results suggest that LAR may function as an independent predictor of mortality risk.
However, the limited sample size may have reduced the statistical power to detect subtle interactions, possibly leading to the failure to identify any. Weak interaction effects are inherently difficult to detect in small samples, necessitating larger studies to improve statistical power. Future research could employ multicenter or prospective designs to expand sample sizes and further explore potential interactions between LAR and different subgroups.
DiscussionIn this study, we assessed the association between the lactate/albumin ratio (LAR) and both short-term (28-day) and long-term (90-day) all-cause mortality among critically ill patients with cirrhosis in the United States. Our findings reveal that LAR significantly predicts 28-day all-cause mortality in cirrhotic patients. Notably, a significant threshold effect was identified at an LAR value of 1.583 (likelihood ratio test, P = 0.002). Below this threshold, there was a substantial increase in mortality risk (HR = 2.29, 95% CI: 1.61–3.27, P < 0.001), whereas above it, the risk also increased significantly, albeit to a lesser degree (HR = 1.16, 95% CI: 1.02–1.31, P = 0.021). Regarding the prediction of 90-day all-cause mortality in critically ill cirrhotic patients, LAR demonstrated segmented significance. Mortality risk significantly rose when the LAR value was below 1.423 (HR = 1.60, 95% CI: 1.04–2.47, P = 0.033), whereas above this threshold, there was no notable change in mortality risk (HR = 0.94, 95% CI: 0.75–1.16, P = 0.542; likelihood ratio test, P = 0.012).
Lactic acid is a critical marker for assessing tissue oxygenation, blood perfusion, and metabolic status, particularly sensitive to acute shock and hypoxia, and can rapidly indicate deteriorating conditions.12,20,21 Previous studies have shown that elevated lactic acid levels enhance the predictive value of short-term mortality in critically ill patients with liver cirrhosis.22 This aligns with our findings, where increasing lactic acid levels, along with higher LAR ratios, correlated with higher patient mortality rates. However, serum lactate levels are influenced by various factors such as liver function, glucose metabolism abnormalities, and medication use, limiting its effectiveness as a standalone indicator for disease identification.23–25
Albumin, the primary plasma protein synthesized by the liver, accounts for over 50% of total plasma protein and serves multiple biological functions, including maintaining colloid osmotic pressure, regulating fluid distribution, and providing antioxidant and immunomodulatory effects. In decompensated cirrhosis, both albumin quantity and quality are impaired, and hypoalbuminemia is often considered a marker of advanced liver disease. However, due to albumin’s long half-life (approximately 20 days), its levels are limited in reflecting acute changes in clinical status, particularly in patients with advanced cirrhosis.
In addition to its role as a plasma expander, albumin has demonstrated therapeutic benefits, such as modulating inflammation, improving cardiovascular function, and reducing cirrhosis-related complications. A study by Fernández et al.26 reported that albumin therapy significantly reduces systemic inflammation and improves cardiovascular dysfunction in patients with decompensated cirrhosis. Furthermore, a multicenter, open-label randomized controlled trial in Italy confirmed albumin’s efficacy in managing ascites, showing that its use significantly reduced the need for paracentesis and lowered the incidence of refractory ascites. Albumin therapy has also proven effective in mitigating other complications, including spontaneous bacterial peritonitis, hepatic encephalopathy, and renal dysfunction.27 Research shows that patients receiving albumin therapy experience significant improvements in overall survival within 18 months, with a 38% reduction in mortality risk.28
Since LAR integrates two key physiological indicators—lactate and albumin—it offers a more comprehensive assessment of the condition in patients with cirrhosis. A reduction in LAR following albumin therapy primarily indicates an improvement in albumin levels, which may correlate with better clinical outcomes. Changes in LAR may partially reflect the effectiveness of albumin treatment. Future research should further investigate the impact of albumin therapy on LAR to enhance its clinical application in the management of cirrhosis.
In recent years, the LAR has emerged as a valuable tool for assessing patients’ pathophysiological status and prognosis. LAR has proven effective in predicting outcomes for various conditions, including severe acute pancreatitis, sepsis, and acute myocardial infarction. Liu et al. reported that LAR is an independent predictor of 28-day all-cause mortality in patients with severe acute pancreatitis, offering greater predictive value than either lactate or albumin alone. Ruchita et al. demonstrated that LAR provides superior predictive power for mortality and length of hospital stay in sepsis patients. Similarly, Wang et al. found that LAR is significantly associated with 14-day, 28-day, and 90-day all-cause mortality in critically ill patients with acute myocardial infarction.
This study identified a significant non-linear relationship between the LAR and 28-day and 90-day all-cause mortality in cirrhosis patients. While this finding offers a new tool for clinical assessment, further validation and exploration are needed for its practical application in clinical settings.
For 28-day mortality, the critical LAR threshold is 1.583. When LAR falls below 1.583, mortality risk increases significantly (HR = 2.29, 95% CI: 1.61–3.27, P < 0.001), indicating pronounced metabolic stress and liver dysfunction. Immediate intervention is required, including increased monitoring and timely treatment adjustments to prevent further deterioration. When LAR exceeds 1.583, the mortality risk continues to rise (HR = 1.16, 95% CI: 1.02–1.31, P = 0.021), though at a slower rate, possibly reflecting a more advanced disease stage where risk remains high but stabilizes. These patients remain at extremely high risk, necessitating close monitoring and potential ICU admission to prevent further deterioration and severe complications.
For 90-day mortality, the threshold is 1.423. When LAR is below 1.423, the mortality risk rises significantly (HR = 1.60, 95% CI: 1.04-2.47, P = 0.033, P = 0.033), suggesting a high-risk state, possibly indicating early liver dysfunction or heightened metabolic stress. In these cases, intensified monitoring is essential, including regular LAR evaluations, liver function assessments, and imaging studies, along with comprehensive interventions as needed. When LAR exceeds 1.423, mortality risk shows no significant change (HR = 0.94, 95% CI: 0.75-1.16, P = 0.542). However, elevated LAR may still suggest disease progression, warranting thorough evaluation and appropriate treatment to improve long-term outcomes.
In summary, the non-linear relationship between LAR and mortality offers valuable insights for the prognosis of cirrhosis patients. Clinicians should integrate dynamic LAR monitoring with the patient’s overall condition and other supporting indicators to develop individualized treatment plans. Although this study did not find significant interactions between LAR and various subgroups, further research with larger sample sizes may reveal these potential interactions.
The Child-Pugh (CTP) score and Model for End-Stage Liver Disease (MELD) scoring systems are extensively validated tools for assessing the prognosis of cirrhosis patients, each offering distinct advantages.29 The CTP score evaluates clinical manifestations such as ascites and hepatic encephalopathy, effectively capturing disease severity. Although some components are subjective, the CTP score remains reliable and practical when supplemented with modern diagnostic tools, such as ultrasound, and the clinical judgment of experienced physicians. In contrast, the MELD score relies entirely on objective laboratory parameters, including serum bilirubin, serum creatinine, and the international normalized ratio (INR). This objectivity makes the MELD score particularly suitable for patients in intensive care units (ICUs), where it offers high sensitivity in prognostic evaluation without the influence of subjective factors.
While we did not directly compare the prognostic performance of the MELD score and LAR, we referenced a study from another hospital involving 279 cirrhosis patients. This study compared the correlations of LAR and MELD scores with in-hospital mortality. The findings showed that LAR demonstrated a stronger correlation with in-hospital mortality in cirrhotic patients.30 LAR’s simplicity and ease of measurement make it ideal for rapid bedside assessments, providing quick insights into liver function decompensation and systemic inflammatory responses. Therefore, we propose that LAR can complement the CTP and MELD scores, offering more comprehensive prognostic information during acute deterioration and helping clinicians manage patients more effectively.
This study has several limitations. As a retrospective, single-center study, it cannot establish a causal relationship between LAR and mortality in cirrhosis patients. Although multivariable analysis accounted for some confounders, unmeasured factors may still have influenced the results. The observational design also limits our ability to assess the causal impact of interventions like albumin therapy. The small sample size, especially in subgroup analyses, may affect the robustness of the findings. We assessed only the initial LAR value upon admission, which reflects the acute phase but may have limited utility in predicting long-term outcomes. Future research should explore dynamic or average LAR values to improve predictive accuracy. Data from the MIMIC-IV database, though racially diverse, may limit the generalizability of the results to other countries or ICU settings. Additionally, due to database limitations, we were unable to determine the specific reasons for ICU admission in patients with cirrhosis or categorize the types of ICUs. Future research should address this issue. Lastly, we excluded patients with malignant tumors to reduce confounding, but this limits the applicability of the findings to cancer patients. Future studies should include cancer patients and investigate LAR’s predictive value across various pathological conditions using stratified analysis.
ConclusionOur study results emphasize the significant positive correlation between the LAR and the 28-day and 90-day mortality rates in patients with cirrhosis. This finding is crucial for identifying high-risk groups and enhancing risk prediction in the clinical management of cirrhosis.
CRediT authorship contribution statementStudy conception and design: Yusong Ye and Xiaowei Tang. Drafting of manuscript: Yusong Ye, Shu Huang, Xiaohong Wang, Wensen Ren. Acquisition of data and critical revision: Yusong Ye, Sha Liu, Wei Zhang, Lei Shi. Revision of manuscript, and final approval of manuscript: Muhan Lü and Xiaowei Tang.
Ethical considerationThe study was performed according to the guidelines of the Helsinki Declaration. The use of the MIMIC-III database was approved by the review committee of Massachusetts Institute of Technology and Beth Israel Deaconess Medical Center. The data is publicly available (in the MIMIC-III database), therefore, the ethical approval statement and the requirement for informed consent were waived for this study.
FundingWe acknowledge the following grants for our study: the Natural Science Foundation of Sichuan Province (No. 2022NSFSC1378), a project titled 'A Study on the Mechanism by which Fecal Microbiota Transplantation Treats Inflammatory Bowel Disease through Targeting GPR43 with Acetate to Alter the Host Immune Response' (No. 2023RCM198), and a project titled 'A Study on How Circadian Rhythm Disruption Promotes Colorectal Cancer via hTERT' (No. 2023LZXNYDJ001).
There is no conflict of interest between the authors and the funding sources.
The data associated with our study is not deposited into a publicly available repository, but the data will be made available on request.
The following are Supplementary data to this article:

