


To compare the prognostic validity of the APACHE II-M and O-SOFA scales versus the APACHE II and SOFA to predict mortality in patients with severe maternal morbidity.
DesignA retrospective, longitudinal and analytical cohort study was carried out.
SettingMedical-surgical intensive care unit (ICU) of a tertiary hospital.
PatientsPregnant or puerperal patients of any age admitted to the ICU.
InterventionsCalculation of prognostic scores upon admission.
Variables of interestAPACHE II, SOFA, APACHE II-M and O-SOFA scores and maternal mortality.
ResultsA total of 141 patients were included. The majority (70.2%) were puerperal. The most frequent diagnosis was gestational hypertensive disease (50 cases). The discrimination of each prognostic model was estimated with the area under the ROC curve (AUC-ROC). The calibration was estimated using the mortality ratio and the Hosmer-Lemeshow statistic. The four scales discriminated between survivors and non-survivors with areas under the curve > 0.85. The APACHE II-M model was the predictive model with the highest discrimination and calibration. In the Hosmer-Lemeshow regression analysis, mortality as predicted by the APACHE II and O-SOFA was significantly different from the observed mortality.
ConclusionsThe APACHE II-M exhibited the greatest prognostic validity in predicting maternal mortality. This difference was given by its improvement in calibration.
Comparar la validez pronóstica del APACHE II-M y O-SOFA versus el APACHE II y SOFA para predecir mortalidad en pacientes con morbilidad materna severa.
DiseñoEstudio de cohorte, retrospectivo, longitudinal y analítico.
ÁmbitoUnidad de cuidados intensivos (UCI) médico-quirúrgica de un hospital de tercer nivel.
Pacientespacientes embarazadas o puérperas de cualquier edad ingresadas a la UCI.
Intervencionescálculo de escores pronósticos al ingreso.
Variables de interésAPACHE II, SOFA, APACHE II-M, O-SOFA y mortalidad materna.
ResultadosSe incluyeron 141 pacientes. Noventa y nueve (70.2%) fueron puérperas. El diagnóstico más frecuente fue la enfermedad hipertensiva del embarazo (50 casos). La discriminación de cada modelo pronóstico se estimó con el área bajo la curva ROC (ABC-ROC). La calibración se estimó utilizando la razón de mortalidad y el estadístico de Hosmer-Lemeshow. Las cuatro escalas discriminaron entre supervivientes y no supervivientes con áreas bajo la curva >0.85. El modelo APACHE II-M fue el modelo pronóstico con mayor discriminación y calibración. En la regresión de Hosmer-Lemeshow la predicción de mortalidad de APACHE II y O-SOFA fue significativamente diferente a las muertes observadas.
Conclusionesel APACHE II-M tuvo la mayor validez pronóstica para predecir muerte materna. Esta diferencia está dada por su mejoría en la calibración.
According to the World Health Organization (WHO), the serious complications that can occur during pregnancy, delivery or the puerperium period can be defined as follows: 1) maternal death (MD): a woman’s death due to causes related to her pregnancy or management during pregnancy or within the first 42 days after full term pregnancy;1 2) extreme or near-miss maternal morbidity: a woman who survives life-threatening conditions (for example due to organ dysfunction) following a complication occurred during pregnancy, delivery or the puerperium period;2 and 3) severe maternal outcomes including cases of MD and extreme maternal morbidity.3 The American College of Obstetricians and Gynecologists uses the concept of severe maternal morbidity (SMM) including pregnant women or women in the pregnancy-puerperium period who were admitted to the intensive care unit (UCI) or who received, at least, 4 erythrocitary concentrates.4 Similarly, potentially life-threatening conditions are clinical situations that threaten a woman’s life during her pregnancy, delivery or the puerperium period3 such as: a) direct obstetric morbidity resulting from pregnancy, delivery or puerperium complications due to medical and/or surgical interventions or ommissions or incorrect therapy (eg, obstetric bleeding); or b) indirect obstetric morbidity associated with preexisting conditions before pregnancy or during pregnancy, not due to any obstetric causes, but aggravated by the physiological effects of pregnancy (eg, valvular heart disease).1
A total of 830 women die every day across the world due to pregnancy related causes.5 From 2014 to 2016 the United Kingdom reported a total of 259 MDs (9.8 women for every 100 000 live births (LBs).6 The United States reported a total of 18 MDs/100 000 LBs.7 For every MD there are 118 cases of SMM8 and between 0.5% and 1.3% of pregnancies will be associated with SMM.4 Inappropriate therapies, delayed diagnoses, and referral to a special care level contribute to maternal mortality.4 Between 55% and 70% of the cases of MD received suboptimal medical care.9 That is why the target established by the WHO is to reduce the overall MD rate to < 70/100 000 LBs.10 The United Kingdom will try to cut the number of MD in half by 2025.6
On the other hand, a prognostic model is the combination of multiple predictors to assess the risk of a specific outcome.5 These models are useful to characterize the severity of the disease in clinical trials and assess the performance of ICUs.11 Their validity (capacity to predict a specific result) includes: a) the discrimination or capacity to distinguish different individuals based on their different outcomes, and b) calibration or match between the probabilities observed and the probabilities anticipated of an occurring event.5
Prognostic models in obstetric patients are not accurate because: 1) we are talking about young female patients with few comorbidities; 2) many obstetric complications improve significantly after pregnancy, and 3) due to the normal physiological changes of pregnancy.11 The Acute Physiology and Chronic Health Evaluation II (APACHE II) is the predictive model most commonly used at the ICU setting.12 However, 5 of its variables have different reference values during pregnancy (arterial blood pressure, heart rate, hematocrit, creatinine and leukocyte levels),8,13 and it also overestimates the mortality rate.14 The Sequential Organ Failure Assessment (SOFA) score assesses the degree of organ dysfunction and is less affected by the physiological changes of pregnancy.8 Prognostic models can be improved by altering their equations or changing their variables, a process known as personalization or recalibration5 Blanco et al. propose an obstetric SOFA (O-SOFA) created from 2 modifications of the SOFA model (Appendix B supplementary data 1),15 and Paternina et al. propose a modified APACHE II score (APACHE II-M) by changing the mathematical equation of the original APACHE II to better serve its validity among the obstetric population (Appendix B supplementary data 1).16 The objective of this study was to compare the validity of the APACHE II, the APACHE II-M, the SOFA, and the O-SOFA to predict mortality in a cohort of patients with SMM who were admitted to our ICU.
Patients and methodsRetrospective, cohort study conducted at the ICU of the IMSS High Specialty Medical Unit 25 of Monterrey, Nuevo León, Mexico. It was approved back on November 27, 2018 by the Health Research Local Committee 1901with registry #R-2018-1901-105. It recruited patients from December 2015 through July 2018. According to Peduzzi formula17n = (TDF × EPV/LP)1 a minimum of 131 patients are needed for the analysis to be statistically significant. The study used a convenience sampling method. Only women who met the definition of SMM were included (pregnant women or within the first 42 days since full-term pregnancy admitted to the ICU). Women without enough information on the health records to assess their prognostic scales at the ICU admission were excluded. In case of ICU readmission during the same hospitalization only the data from the first admission were included. Patients were followed during hospitalization until their death or admission. The patients’ demographic data (age, number of pregnancies, deliveries, c-sections, miscarriages, gestational age, and comorbidities), main diagnosis at admission, time elapsed since the beginning of the complication until admission to our unit, and the variables needed to estimate the APACHE II, APACHE II-M, SOFA, and O-SOFA scores were included. Also, clinical data on the patients’ clinical progression such as the use of mechanical ventilation, vasopressors, renal replacement therapy, and days at the ICU were included too.
Demographic data were documented with descriptive statistics using measures of central tendency and dispersion: mean and standard deviation were used to expressed variables with normal distribution; median and interquartile range were used to expressed variables without a normal distribution. The inferential analysis was conducted using the Student t-test for independent samples or the Mann-Whitney U test for quantitative variables based on their normal distribution. The chi-square test or Fisher’s exact test were used for the qualitative variables. The degree of discrimination of every prognostic model was estimated using the area under the curve (AUC) of the receiver operating characteristics (ROC) and their 95% confidence intervals (95%CI). Calibration was estimated using the standard mortality ratio (the ratio between the deaths seen and the deaths estimated) and Hosmer-Lemeshow test for goodness of fit. Sensitivity, specificity, positive predictive value (PPV), and negative predictive value (NPV) of every prognostic score was estimated as well. The SPSS v 20.0 software was used for statistical analysis.
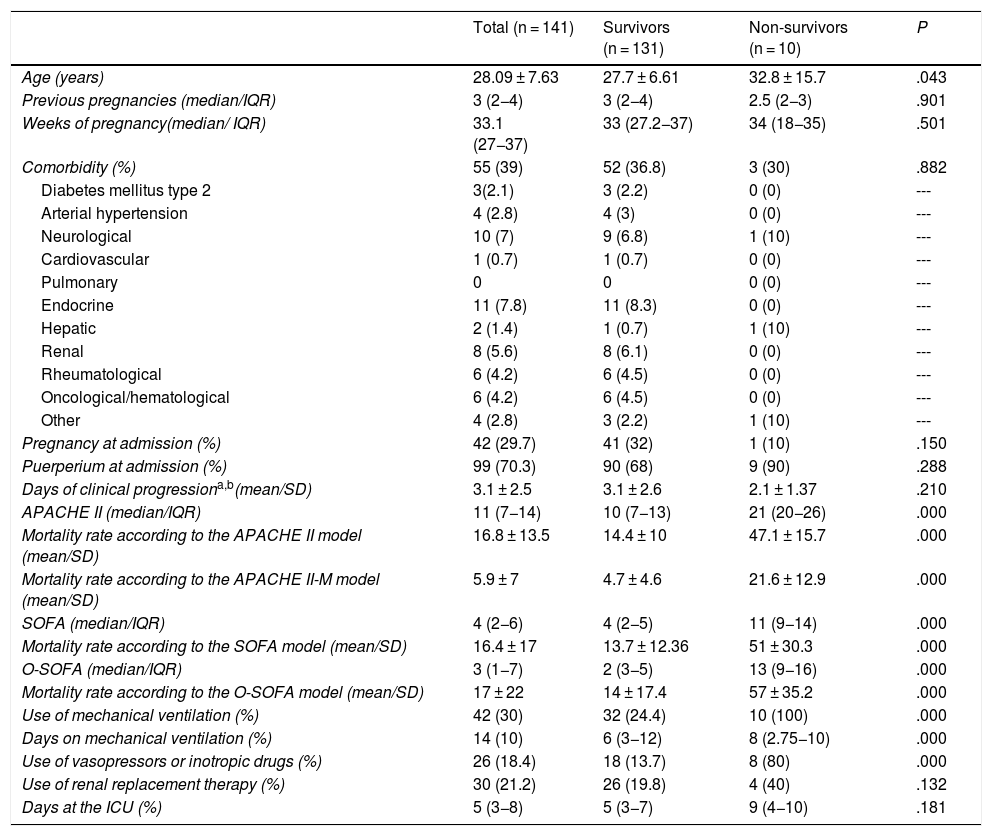
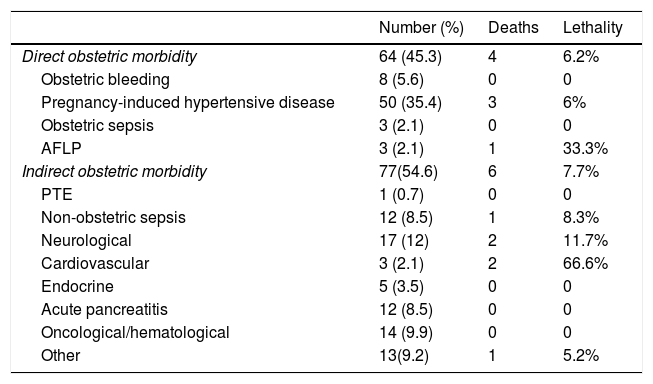
ResultsDuring the 56-month follow-up, 6.7% of ICU admissions were obstetric patients (143 admissions due to SMM) all of them referred from other hospitals. Two patients were excluded due to insufficient information to estimate some of the prognostic scales at admission. The final analysis (141 patients) included 99 women in the pregnancy-puerperium period (70.3%) and 42 pregnant women (29.7%). A total of 62.5% of women in the pregnancy-puerperium period and 45% of pregnant women had their complications in the third trimester. Data on the clinical characteristics, prognostic scores, and disease progression are shown on Table 1. Most admissions (54.6%) were due to indirect obstetric morbidity with an average time of 3.1 ± 2.5 days since the beginning of the complication until ICU admission. The main causes of indirect obstetric morbidity were oncological-hematological (Appendix B supplementary data 2). The most common diagnosis at admission was pregnancy-induced hypertensive disease (50 cases). A total of 23 cases (16.3%) were classified as HELLP syndrome, 19 (13.4%) as severe preeclampsia, and 8 (5.6%) as eclampsia. Diagnoses at admission and lethality are shown on Table 2. There were significant differences in the use of mechanical ventilation, vasopressors, and inotropic drugs between survivors and non-survivors. However, no differences were seen in the use of renal replacement therapy and days on intensive therapy (Table 1).
Clinical characteristics, type of admission, APACHE II-M, O-SOFA, APACHE II, SOFA scores, and findings in 141 patients with severe maternal morbidity in survivors vs non-survivors.
| Total (n = 141) | Survivors (n = 131) | Non-survivors (n = 10) | P | |
|---|---|---|---|---|
| Age (years) | 28.09 ± 7.63 | 27.7 ± 6.61 | 32.8 ± 15.7 | .043 |
| Previous pregnancies (median/IQR) | 3 (2−4) | 3 (2−4) | 2.5 (2−3) | .901 |
| Weeks of pregnancy(median/ IQR) | 33.1 (27−37) | 33 (27.2−37) | 34 (18−35) | .501 |
| Comorbidity (%) | 55 (39) | 52 (36.8) | 3 (30) | .882 |
| Diabetes mellitus type 2 | 3(2.1) | 3 (2.2) | 0 (0) | --- |
| Arterial hypertension | 4 (2.8) | 4 (3) | 0 (0) | --- |
| Neurological | 10 (7) | 9 (6.8) | 1 (10) | --- |
| Cardiovascular | 1 (0.7) | 1 (0.7) | 0 (0) | --- |
| Pulmonary | 0 | 0 | 0 (0) | --- |
| Endocrine | 11 (7.8) | 11 (8.3) | 0 (0) | --- |
| Hepatic | 2 (1.4) | 1 (0.7) | 1 (10) | --- |
| Renal | 8 (5.6) | 8 (6.1) | 0 (0) | --- |
| Rheumatological | 6 (4.2) | 6 (4.5) | 0 (0) | --- |
| Oncological/hematological | 6 (4.2) | 6 (4.5) | 0 (0) | --- |
| Other | 4 (2.8) | 3 (2.2) | 1 (10) | --- |
| Pregnancy at admission (%) | 42 (29.7) | 41 (32) | 1 (10) | .150 |
| Puerperium at admission (%) | 99 (70.3) | 90 (68) | 9 (90) | .288 |
| Days of clinical progressiona,b(mean/SD) | 3.1 ± 2.5 | 3.1 ± 2.6 | 2.1 ± 1.37 | .210 |
| APACHE II (median/IQR) | 11 (7−14) | 10 (7−13) | 21 (20−26) | .000 |
| Mortality rate according to the APACHE II model (mean/SD) | 16.8 ± 13.5 | 14.4 ± 10 | 47.1 ± 15.7 | .000 |
| Mortality rate according to the APACHE II-M model (mean/SD) | 5.9 ± 7 | 4.7 ± 4.6 | 21.6 ± 12.9 | .000 |
| SOFA (median/IQR) | 4 (2−6) | 4 (2−5) | 11 (9−14) | .000 |
| Mortality rate according to the SOFA model (mean/SD) | 16.4 ± 17 | 13.7 ± 12.36 | 51 ± 30.3 | .000 |
| O-SOFA (median/IQR) | 3 (1−7) | 2 (3−5) | 13 (9−16) | .000 |
| Mortality rate according to the O-SOFA model (mean/SD) | 17 ± 22 | 14 ± 17.4 | 57 ± 35.2 | .000 |
| Use of mechanical ventilation (%) | 42 (30) | 32 (24.4) | 10 (100) | .000 |
| Days on mechanical ventilation (%) | 14 (10) | 6 (3−12) | 8 (2.75−10) | .000 |
| Use of vasopressors or inotropic drugs (%) | 26 (18.4) | 18 (13.7) | 8 (80) | .000 |
| Use of renal replacement therapy (%) | 30 (21.2) | 26 (19.8) | 4 (40) | .132 |
| Days at the ICU (%) | 5 (3−8) | 5 (3−7) | 9 (4−10) | .181 |
APACHE II-M, modified version of the Acute Physiology and Chronic Health Evaluation II for obstetric patients; APACHE II, Acute Physiology and Chronic Health Evaluation II; ICU, intensive care unit; IQR, interquartile range; O-SOFA, modified version of the Sequential Organ Failure Assessment Score for obstetric patients; SD, standard deviation; SOFA, Sequential Organ Failure Assessment Score.
Causes of obstetric morbidity at admission, deaths, and lethality by diagnosis in 141 patients with severe maternal morbidity.
| Number (%) | Deaths | Lethality | |
|---|---|---|---|
| Direct obstetric morbidity | 64 (45.3) | 4 | 6.2% |
| Obstetric bleeding | 8 (5.6) | 0 | 0 |
| Pregnancy-induced hypertensive disease | 50 (35.4) | 3 | 6% |
| Obstetric sepsis | 3 (2.1) | 0 | 0 |
| AFLP | 3 (2.1) | 1 | 33.3% |
| Indirect obstetric morbidity | 77(54.6) | 6 | 7.7% |
| PTE | 1 (0.7) | 0 | 0 |
| Non-obstetric sepsis | 12 (8.5) | 1 | 8.3% |
| Neurological | 17 (12) | 2 | 11.7% |
| Cardiovascular | 3 (2.1) | 2 | 66.6% |
| Endocrine | 5 (3.5) | 0 | 0 |
| Acute pancreatitis | 12 (8.5) | 0 | 0 |
| Oncological/hematological | 14 (9.9) | 0 | 0 |
| Other | 13(9.2) | 1 | 5.2% |
AFLP, acute fatty liver of pregnancy; PTE, pulmonary thromboembolism.
The 4 prognostic scales were associated with the use of mechanical ventilation, vasopressors, renal replacement therapy, and days at the ICU (Appendix B supplementary data 2).
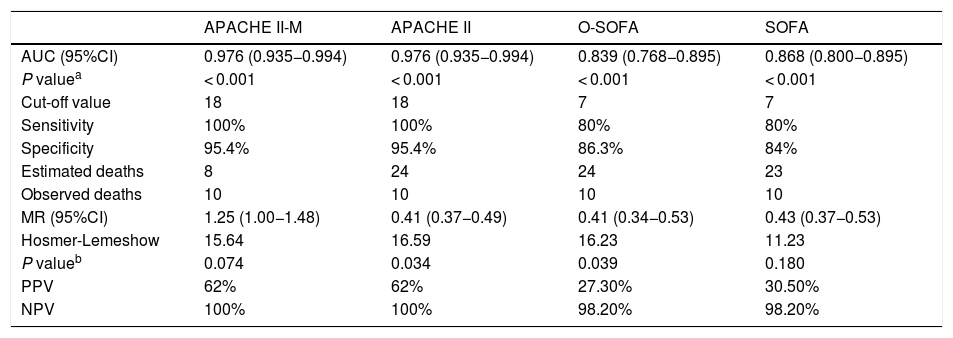
The characteristics of how the scores performed are shown on Table 3. In our cohort, the rate of MD was 7% and the 4 scales discriminated between survivors and non-survivors. The largest ACU-ROC of all was that of the APACHE II and the APACHE II-M models (Fig. 1), although this difference was not statistically significant (P = .105). All prognostic scales had low PPVs and high NPVs. The 4 scales lost their statistical significance when they assessed pregnant patients and septic patients separately (Appendix B supplementary data 2). Based on the mortality ratio, the APACHE II-M model predicted a lower number of deaths than observed. The remaining models overestimated the risk. In the Hosmer-Lemeshow logistic regression model the mortality prediction of both the APACHE II and the O-SOFA model were significantly different compared to the number of deaths reported (Fig. 2).
Characteristics of the APACHE II-M, APACHE II, O-SOFA, and SOFA predictive models in the assessment of 141 patients with severe obstetric morbidity.
| APACHE II-M | APACHE II | O-SOFA | SOFA | |
|---|---|---|---|---|
| AUC (95%CI) | 0.976 (0.935−0.994) | 0.976 (0.935−0.994) | 0.839 (0.768−0.895) | 0.868 (0.800−0.895) |
| P valuea | < 0.001 | < 0.001 | < 0.001 | < 0.001 |
| Cut-off value | 18 | 18 | 7 | 7 |
| Sensitivity | 100% | 100% | 80% | 80% |
| Specificity | 95.4% | 95.4% | 86.3% | 84% |
| Estimated deaths | 8 | 24 | 24 | 23 |
| Observed deaths | 10 | 10 | 10 | 10 |
| MR (95%CI) | 1.25 (1.00−1.48) | 0.41 (0.37−0.49) | 0.41 (0.34−0.53) | 0.43 (0.37−0.53) |
| Hosmer-Lemeshow | 15.64 | 16.59 | 16.23 | 11.23 |
| P valueb | 0.074 | 0.034 | 0.039 | 0.180 |
| PPV | 62% | 62% | 27.30% | 30.50% |
| NPV | 100% | 100% | 98.20% | 98.20% |
ACU, area under the curve; APACHE II-M, modified version of the Acute Physiology and Chronic Health Evaluation II for obstetric patients; 95%CI, 95% confidence intervals; APACHE II, Acute Physiology and Chronic Health Evaluation II; MR, mortality ratio (deaths observed/deaths estimated); NPV, negative predictive value; O-SOFA, modified version of the Sequential Organ Failure Assessment Score for obstetric patients; PPV, positive predictive value; SOFA, Sequential Organ Failure Assessment Score.

ROC curves of the APACHE II-M, O-SOFA, APACHE, and SOFA models in a cohort of 141 patients with severe maternal morbidity. APACHE II-M, modified version of the Acute Physiology and Chronic Health Evaluation II for obstetric patients; AUC, area under the curve; O-SOFA, modified version of the Sequential Organ Failure Assessment Score for obstetric patients. APACHE II, Acute Physiology and Chronic Health Evaluation II; ROC, receiver operating characteristics; SOFA, Sequential Organ Failure Assessment Score.
 vs estimated mortality (axis X). APACHE II, Acute Physiology and Chronic Health Evaluation II; APACHE II-M, modified version of the Acute Physiology and Chronic Health Evaluation II for obstetric patients; O-SOFA, modified version of the Sequential Organ Failure Assessment Score for obstetric patients; SOFA, Sequential Organ Failure Assessment Score.")
Calibration chart of the APACHE II-M, O-SOFA, APACHE, and SOFA predictive models in a cohort of 141 patients with severe maternal morbidity: observed mortality (axis Y) vs estimated mortality (axis X). APACHE II, Acute Physiology and Chronic Health Evaluation II; APACHE II-M, modified version of the Acute Physiology and Chronic Health Evaluation II for obstetric patients; O-SOFA, modified version of the Sequential Organ Failure Assessment Score for obstetric patients; SOFA, Sequential Organ Failure Assessment Score.
The 4 models analyzed showed discrimination capabilities. Regarding calibration, both the APACHE II-M and the SOFA models confirmed their superiority. The patients’ age of the non-survivors group (32.8 ± 15.7 years, P = .043) was older compared to the survivors group. Consistent with the MBRRACE-UK report that described a higher risk of MD with age (7/100 000 in the group of 20-to-24 year-old patients), this risk duplicated to 14/100 000 in women between 35 and 39 years-old, and tripled to 22/100 000 in women > 40.6 In this cohort, indirect obstetric morbidity was more common (54.6%) including neurological, oncological, septic processes, and acute pancreatitis in order of frequency. Regarding direct obstetric morbidity, pregnancy-induced hypertensive complications (35%) and obstetric bleeding (5.6%) were the main diagnoses. On the contrary in the cohort of the study conducted by Rojas et al., admissions due to pregnancy-induced hypertensive disease and obstetric bleeding were predominant. Also, these were the 2 main causes of death.18 This difference can be explained by the fact that the ICU of the study conducted by Rojas is obstetric unlike our ICU (polyvalent). In our cohort, the main cause of MD was pregnancy-induced hypertensive disease (30%) followed by cardiovascular diseases (20%) and neurological conditions (20%). This contrasts with the data from the United Kingdom where 56.4% of all MDs were due to indirect causes such as heart disease and the causes of direct MD (43.5% of the cases). Meanwhile, 43.5% of all MDs were due to direct causes, the main one being pulmonary thromboembolism. Pregnancy-induced hypertensive diseases were the fourth cause of death.6 In the United States, the main cause of MD is indirect obstetric morbidity with cardiovascular diseases (15.5%)4 as the leading cause of death followed by pregnancy-induced hypertensive disease (6.8%) (8th place).7 However, in other Mexican reports, most admissions and deaths at the ICU setting are due to direct obstetric morbidity.1
Peripartum cardiomyopathy and acute fatty liver of pregnancy (AFLP) were the 2 major conditions that triggered the highest lethality rates (66.6% and 33.3%, respectively). Unlike what has been reported in the medical literature, the average mortality rate was 10% for peripartum cardiomyopathy19 and 10% to 15% for AFLP.20 On the other hand, pregnancy-induced hypertensive disease had a lower lethality rate (6%) compared to what the study conducted by Curiel et al. reported (a 1.5% lethality rate).21 It is estimated that 0.8% of all cases of SMM end up in MD;8 however, the rate of MD in our cohort was 7%, nearly 10 times higher. This may be explained by 3 situations: a) tertiary referral centers admitting obstetric patients referred from other units that manage complex underlying conditions; b) patients included in the study who did not receive medical attention or did not respond to the early management attempted in other centers, and c) the delays reported when arriving to this unit since the beginning of the complication are up to 3.1 days on average. The aforementioned conditions cause more adverse events in obstetric patients admitted to this unit which, in turn, compromise the course of their disease. The high mortality rate seen in obstetric patients from tertiary referral centers has also been reported by other authors: In their cohort of 232 women with SMM from a tertiary center, Blanco et al. reported a 3.8% mortality rate;15 similarly, Paternina et al. reported a 4.7% mortality rate in 625 patients with SMM.16
The APACHE II, APACHE II-M, SOFA, and O-SOFA scores were correlated with findings like the use of vasoactive amines and mechanical ventilation, which confirmed their possible utility to define the subgroup of patients with poor disease progression although these models are only validated to predict mortality.12 All models discriminated between survivors and non-survivors without any significant differences among their different AUC-ROCs. This is contrary to the best discrimination of the O-SOFA model (AUC-ROC = 0.86) compared to the SOFA (AUC-ROC = 0.79) as reported by Blanco et al.15
Regarding the selected cohort points, the APACHE II and the APACHE II-M scores had better sensitivity and specificity. However, the PPV of all models was low (< 60%) and its best utility was for its high NPV (> 95%). No model discriminated or calibrated subgroups of pregnant women or septic subgroups separately. This is due to the fact that only 1 out of 20 maternal deaths occurred in a pregnant woman and another one due to a septic process unlike the cohorts of Blanco et al.15 and Paternina et al.16 where these subgroups are far better represented.
Using the mortality ratio, the APACHE II-M model obtained the best value (closer to 1). This result is consistent with that reported by Paternina et al. who maintain a high discrimination value (AUC-ROC of 0.86) but improves calibration at a mortality ratio of 0.85 compared to 0.30 of the original APACHE II score.16 The Hosmer-Lemeshow test for goodness of fit proved there is no calibration in the predictions made by the APACHE II and the O-SOFA models (P = .034 and P = .039, respectively). In patients with lower mortality risk (most patients in our cohort) the APACHE II-M model made a right estimate of the mortality rate, but as severity went up it started underestimating mortality rate. On the other hand, the APACHE II model overestimates mortality in less severe patients and underestimates it in more severe patients, which explains its predictions null calibration. Both the SOFA and the O-SOFA models overestimated the risk of death. Still, the overestimation of the O-SOFA score was higher, meaning that its calibration was null in our cohort.
The strengths of the studio are that it compares the validity of its 2 components (discrimination and calibration) in 2 prognostic models for general ICU patients. Also, its personalized versions for obstetric patients, a comparison that had not been drawn together before for the different models in 1 same cohort; its internal validity comes from the use of validated statistical tools and from the fact that the patients who were not included in the study due to the lack of data in the clinical history only accounted for 1.6% of the sample, which is why it was considered an insignificant loss.
The limitations of this study are selection bias and its poor external validity given it is a single-center trial and the cohort analyzed is only representative of a minority of all patients with severe maternal outcomes from the region who, due to the severity or complexity of their clinical state, were referred to our hospital considering that it does not have an obstetric ICU and only 6.7% of all admissions are obstetric patients; however, thanks to its therapeutic resources and extracorporeal support it is a reference centers for critically ill patients. Another weakness of the study is the small number of pregnant (10 patients) and septic women (15 patients) included, which prevented the analysis of the prognostic model validity in these subgroups. Similarly, another study limitation is the fact that only 10 deaths were reported, which may lead to erroneous conclusions on the performance of the scales under analysis. No autopsies were performed in any of the patients either to find out the causes of death.
We found a favorable tendency towards the prognostic validity of the APACHE II-M score to predict MD thanks to its improved calibration compared to the original APACHE II score, and a negative tendency on the validity of the O-SOFA score in the prediction of MD compared to the original SOFA score due to its lower calibration capabilities. According to our results, the use of the APACHE II-M model can be recommended to assess the prognosis of mortality in women with SMM.
AuthorsBaltazar Jonguitud López designed the research, manuscript, publication, and data mining protocols.
Daniel Álvarez Lara reviewed and provided counseling during the design phase of the research protocol.
Gerardo del Carmen Palacios Saucedo provided counseling during the design phase of the research and manuscript protocols. Statistical analysis.
Miguel Ángel Sosa Medellín provided counseling during the design phase of the research protocol. Statistical analysis.
Fabio Montoya Barajas conducted data mining and provided counseling during the design phase of the manuscript protocol.
Conflicts of interestNone reported whatsoever.
The following are Supplementary data to this article:
EPV, events per variable; LP, lower probability; TDF, total degrees of freedom.
Please cite this article as: Jonguitud López B, Álvarez Lara D, Sosa Medellín MA, Montoya Barajas F, Palacios Saucedo GC. Comparación de 4 escalas pronósticas para predecir mortalidad en pacientes con morbilidad materna severa. Med Clin (Barc). 2021;45:156–163.

