


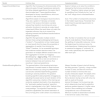
Comparison of the predictive ability of various machine learning algorithms (MLA) versus traditional prediction scales (TPS) for massive hemorrhage (MH) in patients with severe traumatic injury (STI).
DesignOn a database of a retrospective cohort with prehospital clinical variables and MH outcome, a treatment of the database was performed to be able to apply the different AML, obtaining a total set of 473 patients (80% training, 20% validation). For modeling, proportional imputation and cross validation were performed. The predictive power was evaluated with the ROC metric and the importance of the variables using the Shapley values.
SettingOut-of-hospital care of patients with STI.
ParticipantsPatients with STI treated out-of-hospital by a out-of-hospital medical service from January 2010 to December 2015 and transferred to a trauma center in Madrid.
InterventionsNone.
Main variables of interestObtaining and comparing the “Receiver Operating Characteristic curve” (ROC curve) metric of four MLAs: "random forest" (RF), "vector support machine" (SVM), "gradient boosting machine" (GBM) and "neural network" (NN) with the results obtained with TPS.
ResultsThe different AML reached ROC values higher than 0.85, having medians close to 0.98. We found no significant differences between AMLs. Each AML offers a different set of more important variables with a predominance of hemodynamic, resuscitation variables and neurological impairment.
ConclusionsMLA may be helpful in patients with HM by outperforming TPS.
Comparación de la capacidad predictiva de diferentes algoritmos de machine learning (AML) respecto a escalas tradicionales de predicción (ETP) de hemorragia masiva (HM) en pacientes con enfermedad traumática grave (ETG).
DiseñoSobre una base de datos de una cohorte retrospectiva con variables clínicas out-of-hospitalarias y de resultado de HM se realizó un tratamiento de la base de datos para poder aplicar los AML, obteniéndose un conjunto total de 473 pacientes (80% entrenamiento, 20% validación). Para la modelización se realizó imputación proporcional y cross validation. El poder predictivo se evaluó con la métrica ROC y la importancia de las variables mediante los valores Shapley.
ÁmbitoAtención extrahospitalaria del paciente con ETG.
PacientesPacientes con ETG atendidos en el medio extrahospitalario por un servicio médico extrahospitalario desde enero de 2010 hasta diciembre de 2015 y trasladados a un centro de trauma en Madrid.
IntervencionesNinguna.
Variables de interés principalesobtención y comparación de la métrica “Receiver Operating Characteristic curve” (curva ROC) de cuatro AML: “random forest” (RF), “vector support machine” (SVM), “gradient boosting machine” (GBM) y “neural network” (NN) con los resultados obtenidos con ETP.
ResultadosLos diferentes AML alcanzaron valores ROC superiores al 0.85, teniendo medianas cercanas a 0.98. No encontramos diferencias significativas entres los AML. Cada AML ofrece un conjunto de variables diferentes, pero con predominancia de las variables hemodinámicas, de resucitación y de deterioro neurológico.
ConclusionesLos AML podrían superar a las ETP en la predicción de HM.
Severe traumatic injury (STI) is the leading cause of death in individuals under 40 years old (2010−5.1 million deaths, 1 in every 10 deaths was due to traumatic injury).1 Within the scope of STI, massive hemorrhage (MH) is the leading cause of potentially preventable death.2 Early detection of these patients and the use of massive transfusion protocols (MTP) along with damage control resuscitation have reduced mortality by 30%.3 Various predictive scales have been developed to identify patients with MH, and studies have been conducted to determine the most useful traditional predictive scales (TPS) for MH in our setting.4–6 These TPS use classical statistics (linear or logistic regression) and are subject to a set of mathematical restrictions. Currently, computational statistics, specifically machine learning algorithms (MLA), are becoming more relevant due to their greater predictive capacity and different approach to working with data, searching for both linear and non-linear patterns with fewer restrictions.7,8 They do not seek to fit data to mathematical conditions (homoscedasticity, for example), but rather optimize predictive capacity with risk of "overfitting" and a lower degree of explainability. The need to detect patients with MH both better and earlier makes us explore alternatives to traditional TPS.9
The objective is to explore the predictive capacity offered by MLA compared to TPS to detect the occurrence of future MH in adults who have suffered severe traumatic injury (STI). If significant predictive capacity is observed, we would then investigate the importance of variables in different MLA.
MethodsDatabaseSince we know which patients had the event of interest (experiencing MH) and the objective of the study is to determine the predictive capacity of MH, we will apply a supervised learning type of MLA.
Retrospective cohort study. The database used is proprietary, not funded, confidential, and systematically collects various aspects of traumatic disease on a daily basis. It includes patients over 15 years old with severe trauma treated from January 2010 through December 2015 by SAMUR – Protección Civil (PC), the emergency medical service of the city of Madrid, Spain who were then tran transferred to Hospital 12 de Octubre, a high-complexity hospital center based in the capital of Spain. Data comes from mixed sources with prehospital care data extracted from a prospectively maintained database by SAMUR-PC plus another prospectively maintained hospital database from Hospital 12 de Octubre. It is the same study population used in the study "Prediction of massive hemorrhage at out-of-hospital level: validation of six scales."5 The study5 was approved by the Ethics Committee.
All patients with severe trauma defined by physiological and anatomical criteria were consecutively included. Patients who meet the following exclusion criteria upon hospital admission are excluded: (1) Patients in cardiac arrest or pre-mortem situation in whom resuscitation efforts would be considered futile. (2) Patient or family refusal to receive blood products or derivatives. Initial out-of-hospital care is provided by a specialized response team including 2 physicians, 2 nurses, and 2 technicians following the Advanced Trauma Life Support (ATLS) protocols and a joint assistance procedure called "Trauma Code."10 Data are prospectively collected in a specific trauma hospital database. The following variables were studied: demographic variables (age and sex), clinical variables (mechanism of injury, suspected femur fracture or unstable pelvic fractures), physiological variables (first heart rate [HR], systolic blood pressure [SBP], and diastolic blood pressure [DBP]), analytical variables (hemoglobin, base excess [BE], and venous blood lactate [measured using a Siemens Healthineers epoc® blood gas analyzer]), out-of-hospital treatment variables (amount of prehospital fluids administered), imaging variables (a Focused Abdominal Sonography for Trauma (FAST) ultrasound was performed using a portable Sonosite 180 plus® ultrasound machine from FujiFilm [variables collected from the structured report of SAMUR-PC]), variables regarding hospital follow-up at the ICU setting: anatomical injuries, severity (Injury Severity Score [ISS]), need for arteriography/surgery to control bleeding (variables collected from our unit's database), and transfused blood components. The primary outcome variable to be predicted is massive hemorrhage (MH).
Massive hemorrhage criteriaThe objective of the study is to predict MH, so a query on our transfusion registry was performed to collect the number of red blood cell units (RBC) transfused to every patient. In this study, MH was defined with the same definition used in the comparative study5: administration of ≥10 RBC units in the first 24 h of admission following trauma (≥2500 cc). In our database after database pre-processing, we obtained 7.9% of cases, slightly lower than the comparative study (9.2%), which, in principle, would further complicate prediction due to its rarity.
Data cleaning, reorganization, and preprocessingIt should be clear that in this study we will be comparing the results previously obtained throug TPS in a patient cohort ("Prediction of massive hemorrhage at out-of-hospital level level: validation of six scales"5) with the results obtained through machine learning algorithms (MLA) in a subgroup (validation set) derived from the same cohort.
In the comparative study,5 the following predictive scales for massive hemorrhage (MH) were estimated using physiological, anatomical, analytical, and imaging variables from the out-of-hospital setting: (1) Trauma Associated Severe Hemorrhage (TASH) Score.11,12 (2) Assessment of Blood Consumption (ABC) Score,13 (3) Emergency Transfusion Score (ETS),14 (4) Shock Index (SI),15,16 (5) Prince of Wales Hospital/Rainer Score (PWH),4 (6) Larson Score.17 These are the TPS that we will compare using MLA,18
Data preprocessing involved the following actions19:
- 1)
Removal of variables with significant data loss (numerator = available data, denominator = overall data): base excess (EB) (351/550), lactate (169/550), hemoglobin (Hb) (491/550), hematocrit (141/550). In addition, ultrasound values not consistently performed were removed. Due to the, sometimes, existing difficulties coding the mechanism of injury, this variable was also omitted. We should mention that we are removing variables commonly used in day-to-day decision-making.
- 2)
Removal of variables that do not belong to the prehospital field: ISS, length of stay, disease progression.
- 3)
For variables with <5% missing data, data imputation was performed using the "MICE" package following the "Multivariate Imputations by Chained Equations" methodology.
- 4)
In conclusion, we removed variables with a high amount of missing data that were not relevant to the study context. After variable selection, we completed the observations of variables with minimal data loss. However, we saw that the variable of interest (massive hemorrhage, MH) is tremendously out of balance (<10% of the cases). These issues of imbalance and relatively small sample size pose challenges for algorithmic learning so it was decided to use data synthesis/generation techniques using the "SMOTE" (Synthetic Minority Over-sampling Technique) package to balance the cases proportionally and facilitate learning.
After preprocessing, the variables collected were sex, age, Glasgow Coma Scale (GCS) score, initial heart rate (HR), initial diastolic blood pressure (DBP), initial systolic blood pressure (SBP), volume of out-of-hospital fluid administered, suspected pelvic and/or femur injury, and presence of penetrating trauma. These variables allowed us to create "derived variables" that include more information in a single variable like the mean arterial pressure (MAP) at admission, the prehospital shock index, and categorization of neurological level into low, intermediate, or high GCS.
Model development: creation of training and validation datasetsThe steps followed for the application of MLAs were:
- 1)
Preprocessing of the dataset (variable selection, imputation, and synthesis) and derivation of variables (shock index) from the database used in the former study for the application of MLA. Graphical verification was performed to make sure that the distribution of the variable of interest remained similar between the original and synthetic data after case synthesis (see supplementary data).
- 2)
Random partition of the dataset into a training set (80% of cases) and a validation set (remaining 20%).
- 3)
Algorithmic optimization: identification of the best model (accuracy and robustness) through hyperparameter selection, cross-validation (CV) with resampling and repetition
The MLA used were Random Forest (RF), Support Vector Machines (SVM), Neural Networks (NN), and Gradient Boosting Machines (GBM) (Table 1).
Brief summary of the different algorithms explaining the underlying idea behind their function and the adjustable hyperparameters in each and every one of them.
| Model | Intuitive idea | Hyperparameters |
|---|---|---|
| SupportVectorMachines | Algorithm that increases the dimensionality of the data and seeks, through hyperplanes (elements that allow dataset separations), the region that it discriminates best. These algorithms were developed for binary classifications, which are common in the clinical domain. | Sigma: It allows us to relax the conditions imposed by the formula, providing some "slack". Therefore, higher values can lead to overfitting.Cost: Penalty for the "use" of the "soft" margin due to misclassification. |
| NeuralNetwork | Algorithms based on biological neural functions. They are a system of "densely connected neurons" that receive information (variable values) they transform (summing and using activation functions) to provide an output result (class/result).When the result does not match the expected outcome, they try to correct it by adjusting forward and backward transformations (backpropagation). | Size: The number of components (neurons) in the hidden layer.Decay: Parameter that determines the penalty/regularization to avoid overfitting. |
| RandomForest | Algorithm that generates multiple random decision trees using bootstrapping techniques ("random"). The prediction is then made based on most results from the trees (the ensemble or aggregation of results), thus forming the "forest".Therefore, it is an ensemble technique that combines random decision trees.The generation of multiple different random trees and their aggregation is known as "bagging" (bootstrapping + aggregating). This combination of multiple models into a new one achieves a balance between bias and variance, thus resulting in improved predictions. | Mtry: Number of variables that can be split at each node.Splitrule: Rules that govern the splitting of nodes.Min.node.size: Value that determines the minimum size of a node.Importance: It determines the criterion to measure the degree of "uniformity" of each node, specifically the improvement after each split. |
| GradientBoostingMachine | The generalization of the boosting technique (adjustment of models based on weak learners after each iteration) by using any differentiable cost function allowed implementing gradient boosting to several problems.The gradient boosting algorithm adds properties of bagging by adjusting the weak learner at each iteration of the algorithm using only a fraction of the training set, randomly sampled (stochastic), thus developing the "stochastic gradient boosting" algorithm, which is implemented in the "gbm" method of the caret package. This algorithm improves the predictive capabilities and allows estimation of the out-of-bag error under certain circumstances. | Ntrees: Number of trees to be built during the fitting process. Typically, a large number of trees is used, and then the minimum number of trees to minimize the loss function.Interaction.depth: The depth of the tree. The default value is 1, which means that a decision stump (a tree with only one split) is used as the weak learner.Shrinkage: It is the learning rate, which determines how fast the algorithm performs gradient descent. A higher value results in less overfitting but increases computational cost.n.minobsinnode: Minimum number of observations allowed in the terminal nodes of the trees. |
These algorithms seek the best solution (prediction) to a given problem given a dataset.20 The search for this solution requires a methodology, which is different for each algorithm. The "method" followed by each algorithm is defined by its hyperparameters. For example, in the random forest algorithm, one of the hyperparameters is the number of trees used for decision-making. Since the optimal values of these hyperparameters vary depending on the dataset, an exploration of different values is performed. In other words, different algorithms are applied that "explore" the dataset in different ways and different hyperparameters to allow different decision-making approaches.21
Evaluation of the performance of mathematical modelsThe area under the receiver operating characteristic (AUROC) has been the guiding metric for comparison purposes. In addition, other metrics derived from the confusion matrix are also compared. As mentioned before, the main difference is that the results of TPS collected in the previous study5 were used against the entire cohort while MLA are evaluated against a subset that includes synthetic observations (test/validation set).
Statistical analysis was conducted using R 4.1.2 and RStudio 1.3.1093. The libraries used have been documented (see supplementary data). The summary of the entire process is shown on Fig. 1.
Assessment of the importance of the variables of each algorithm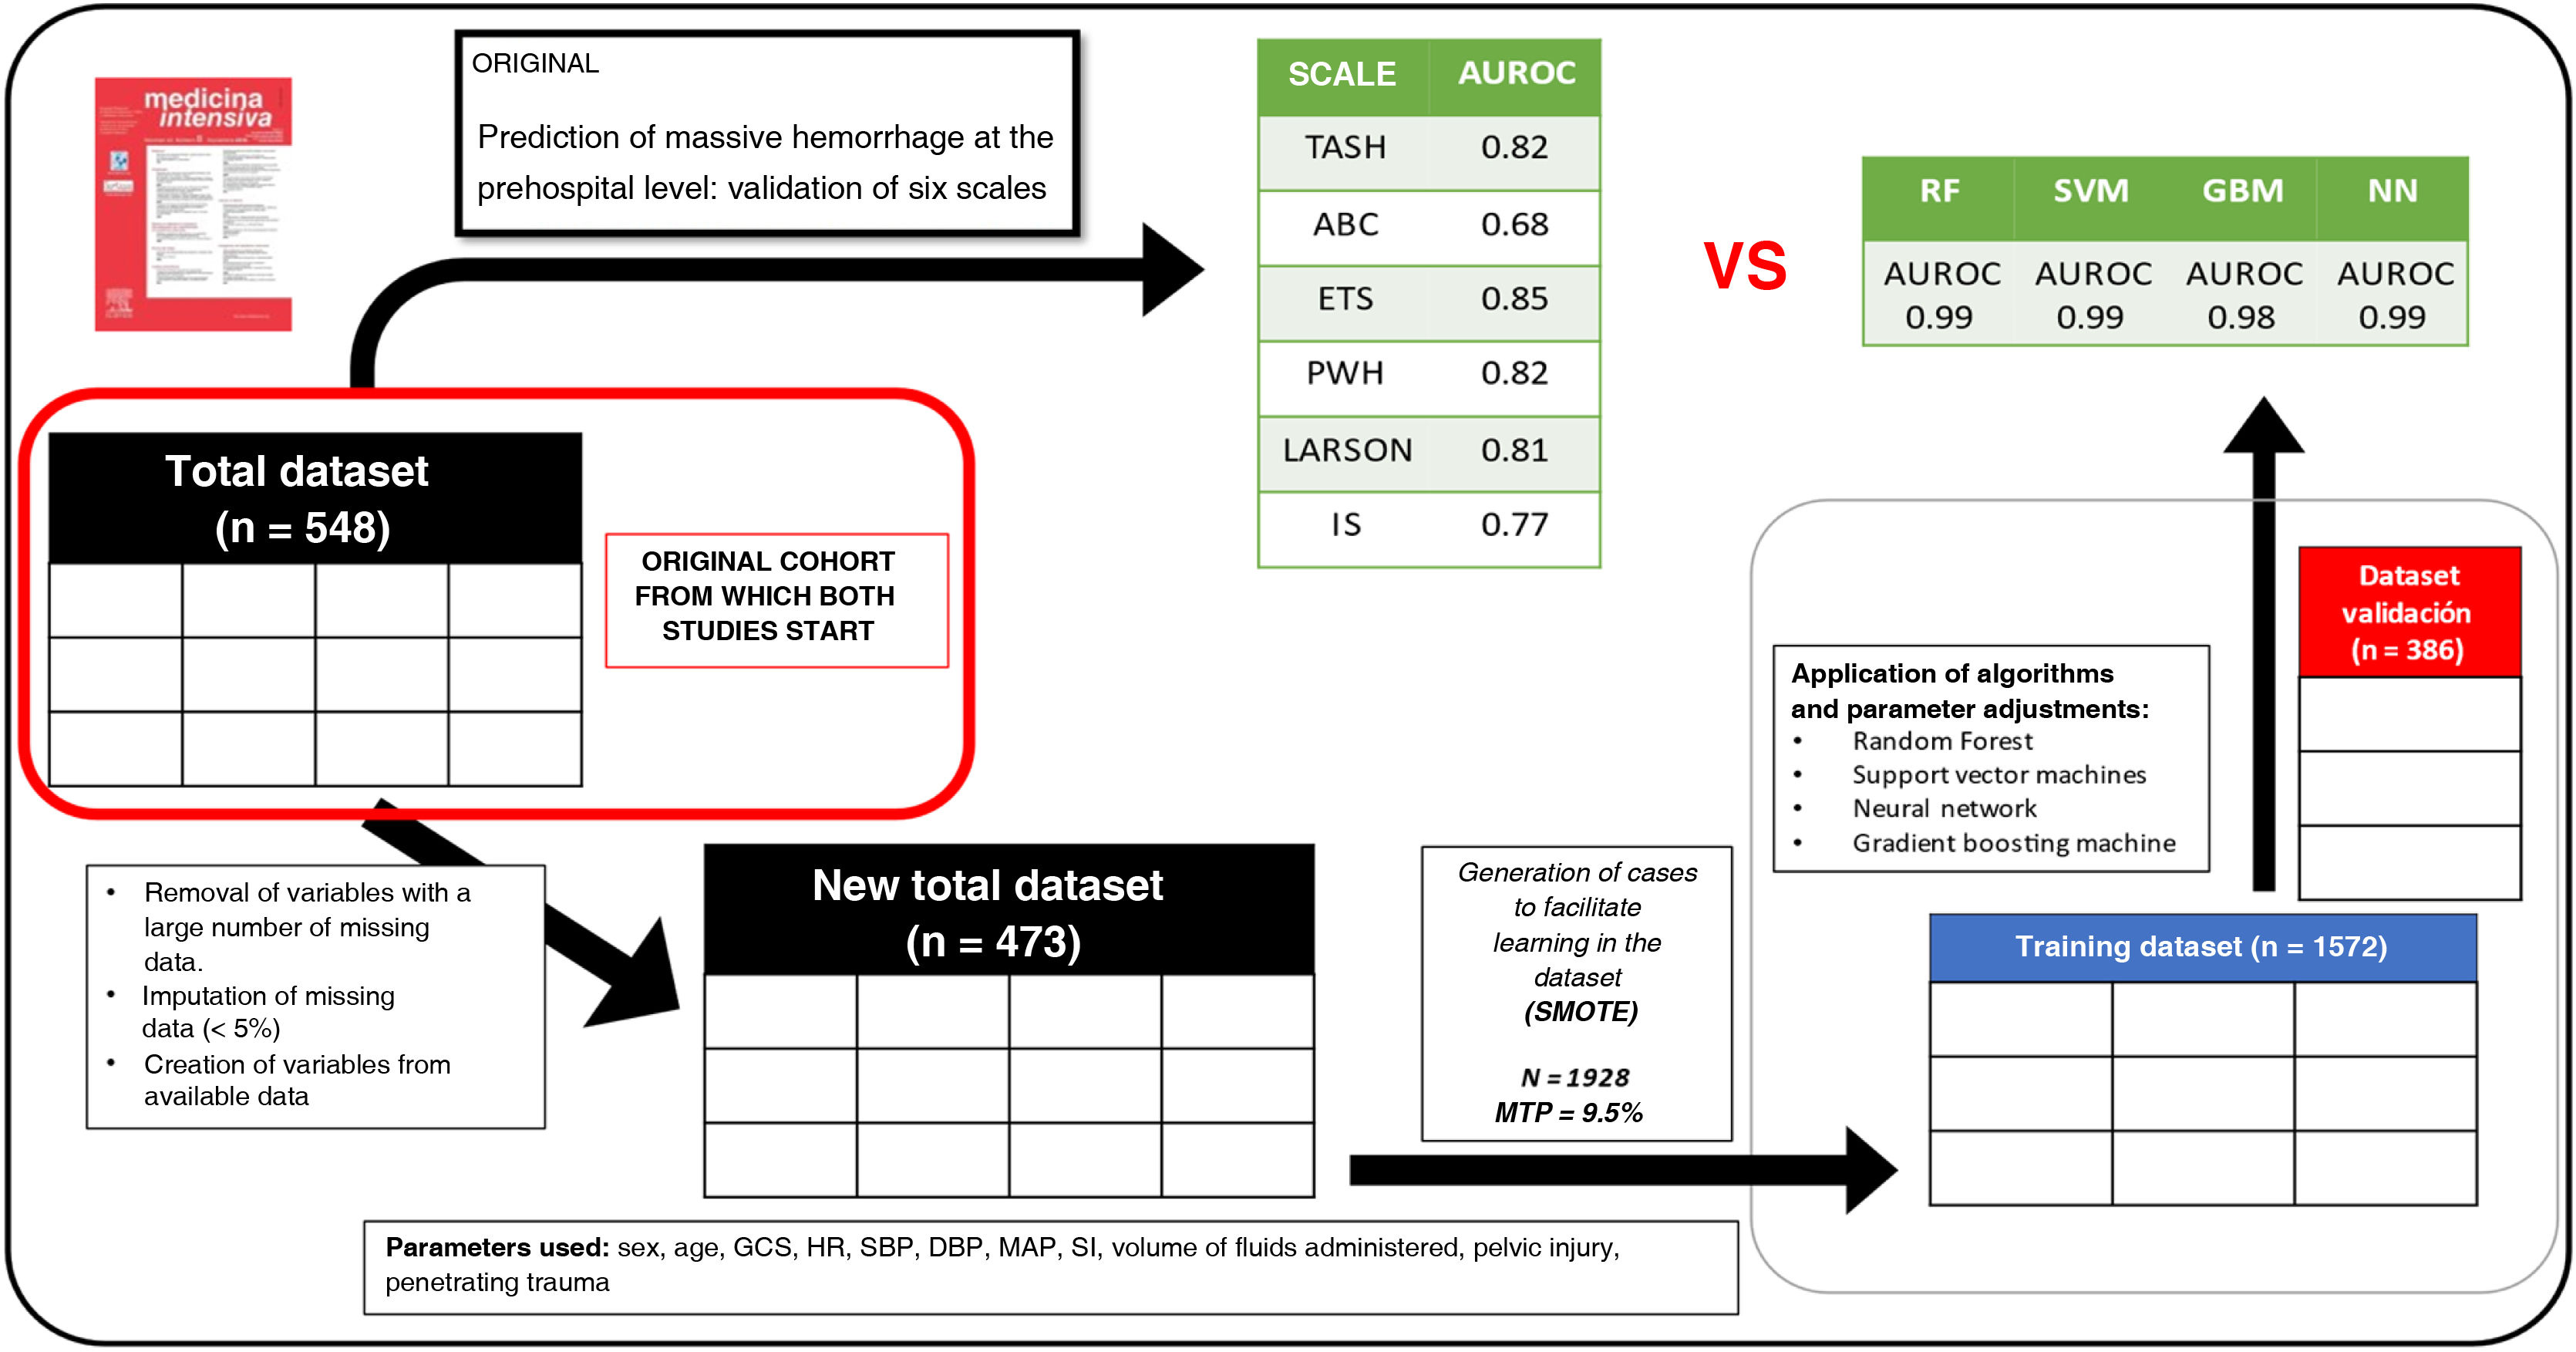
The importance of variables in each MLA was studied too (Fig. 2).
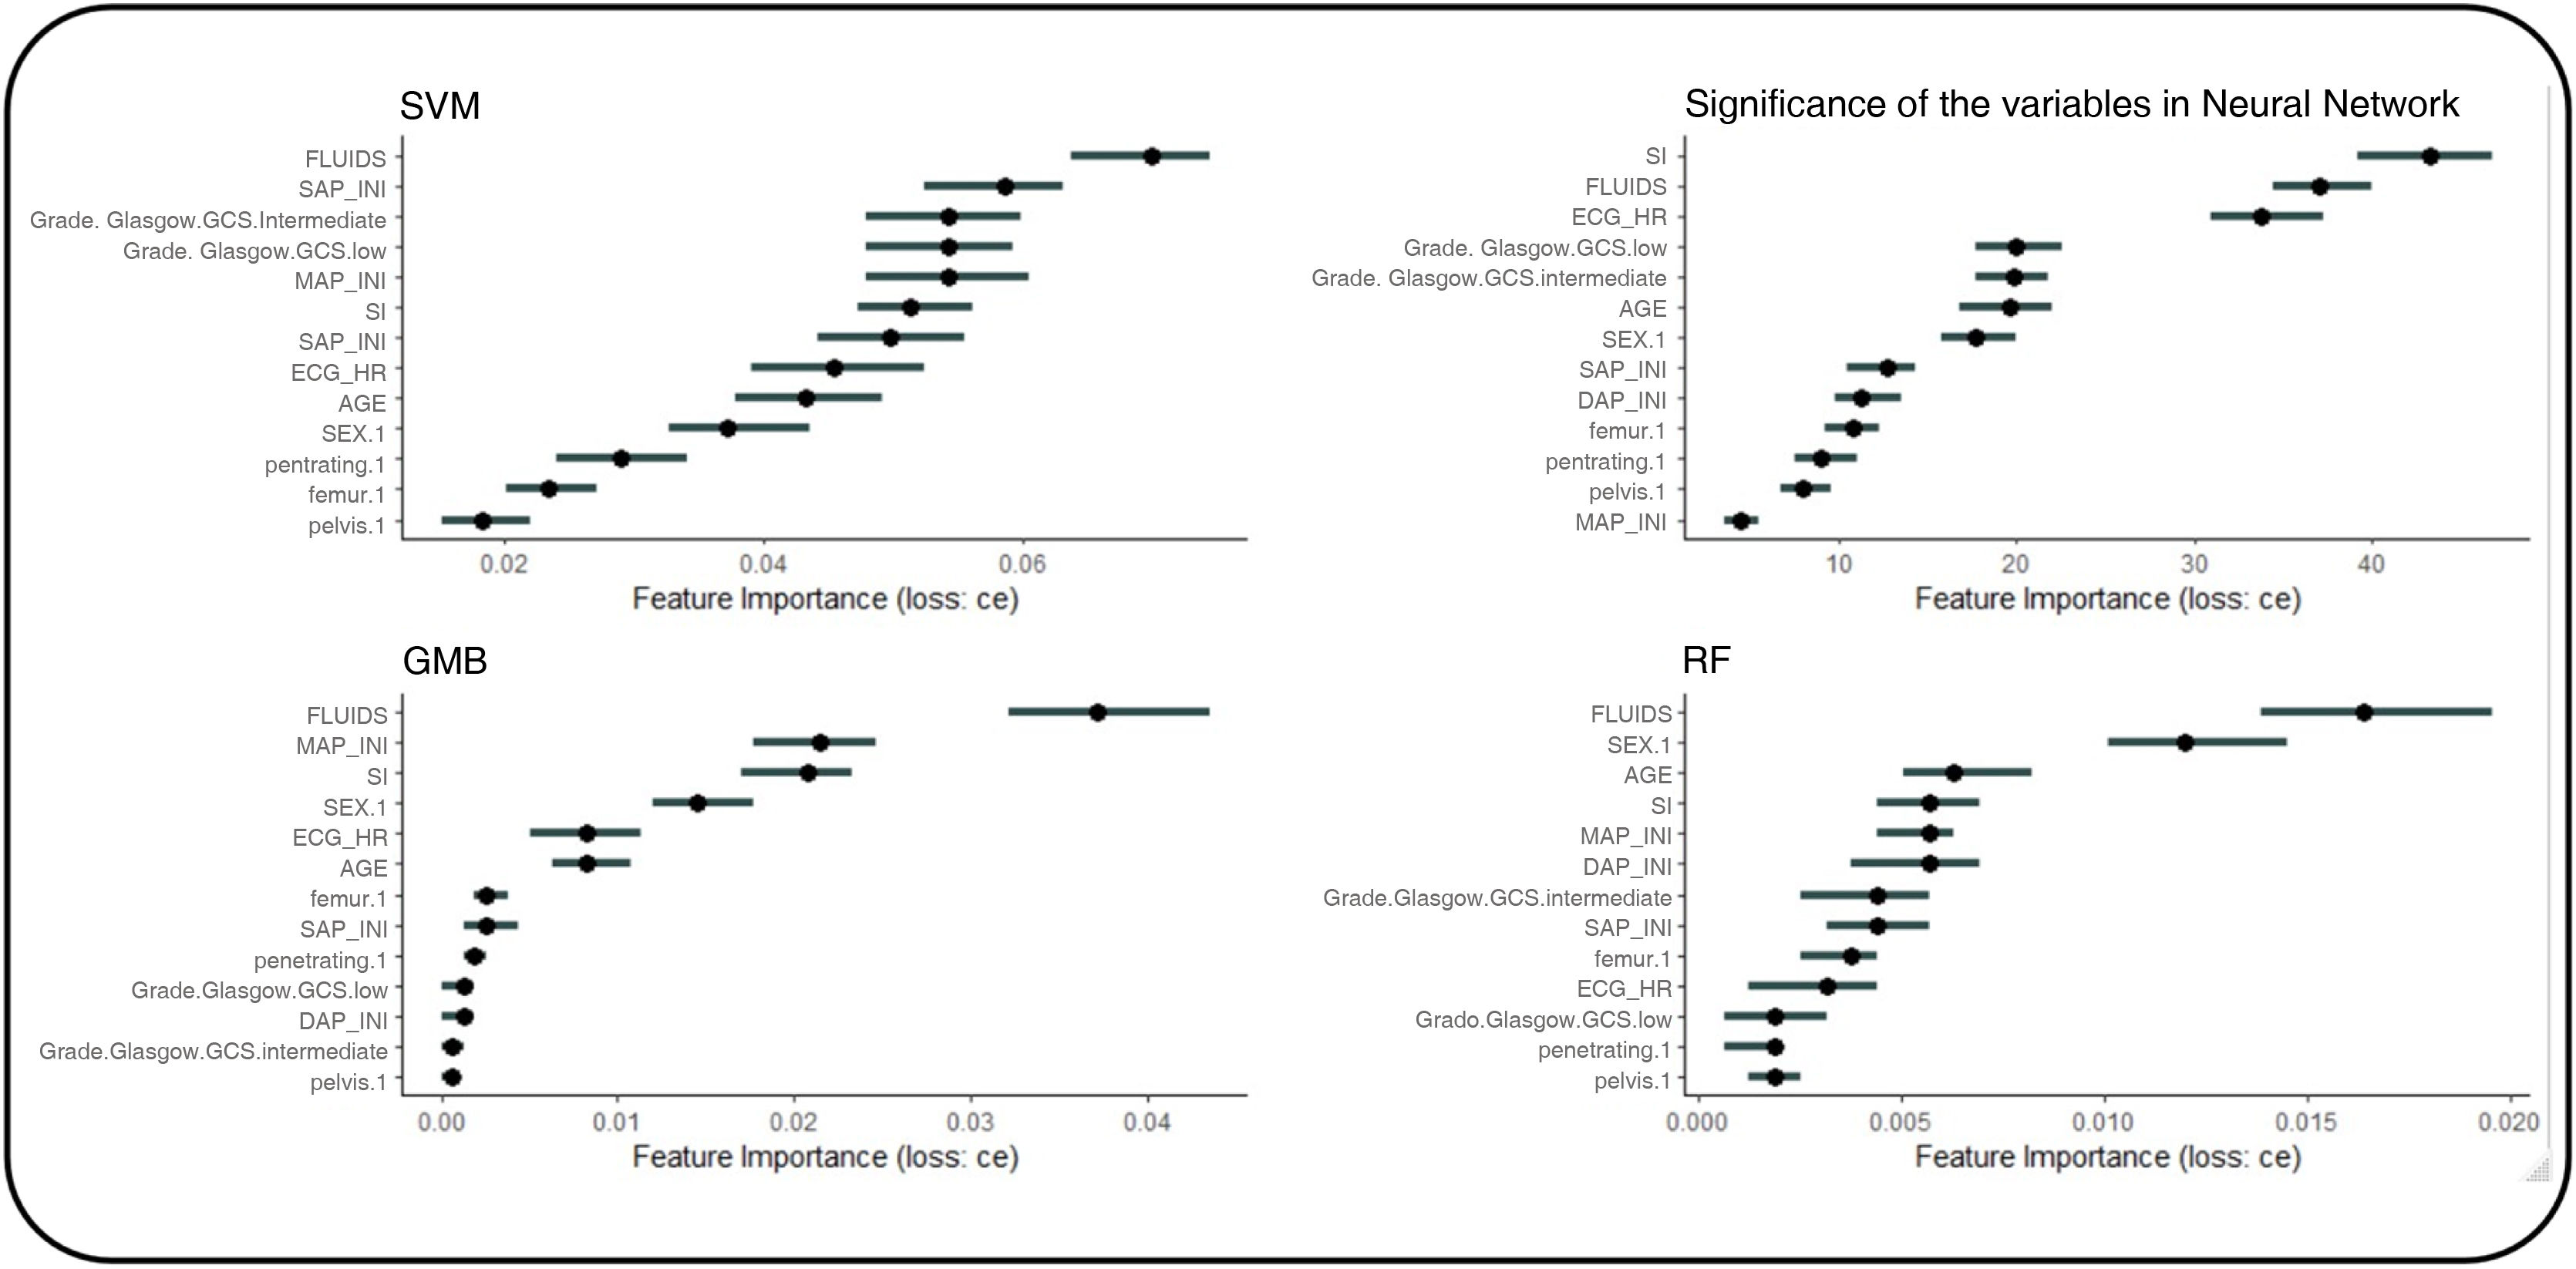
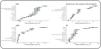
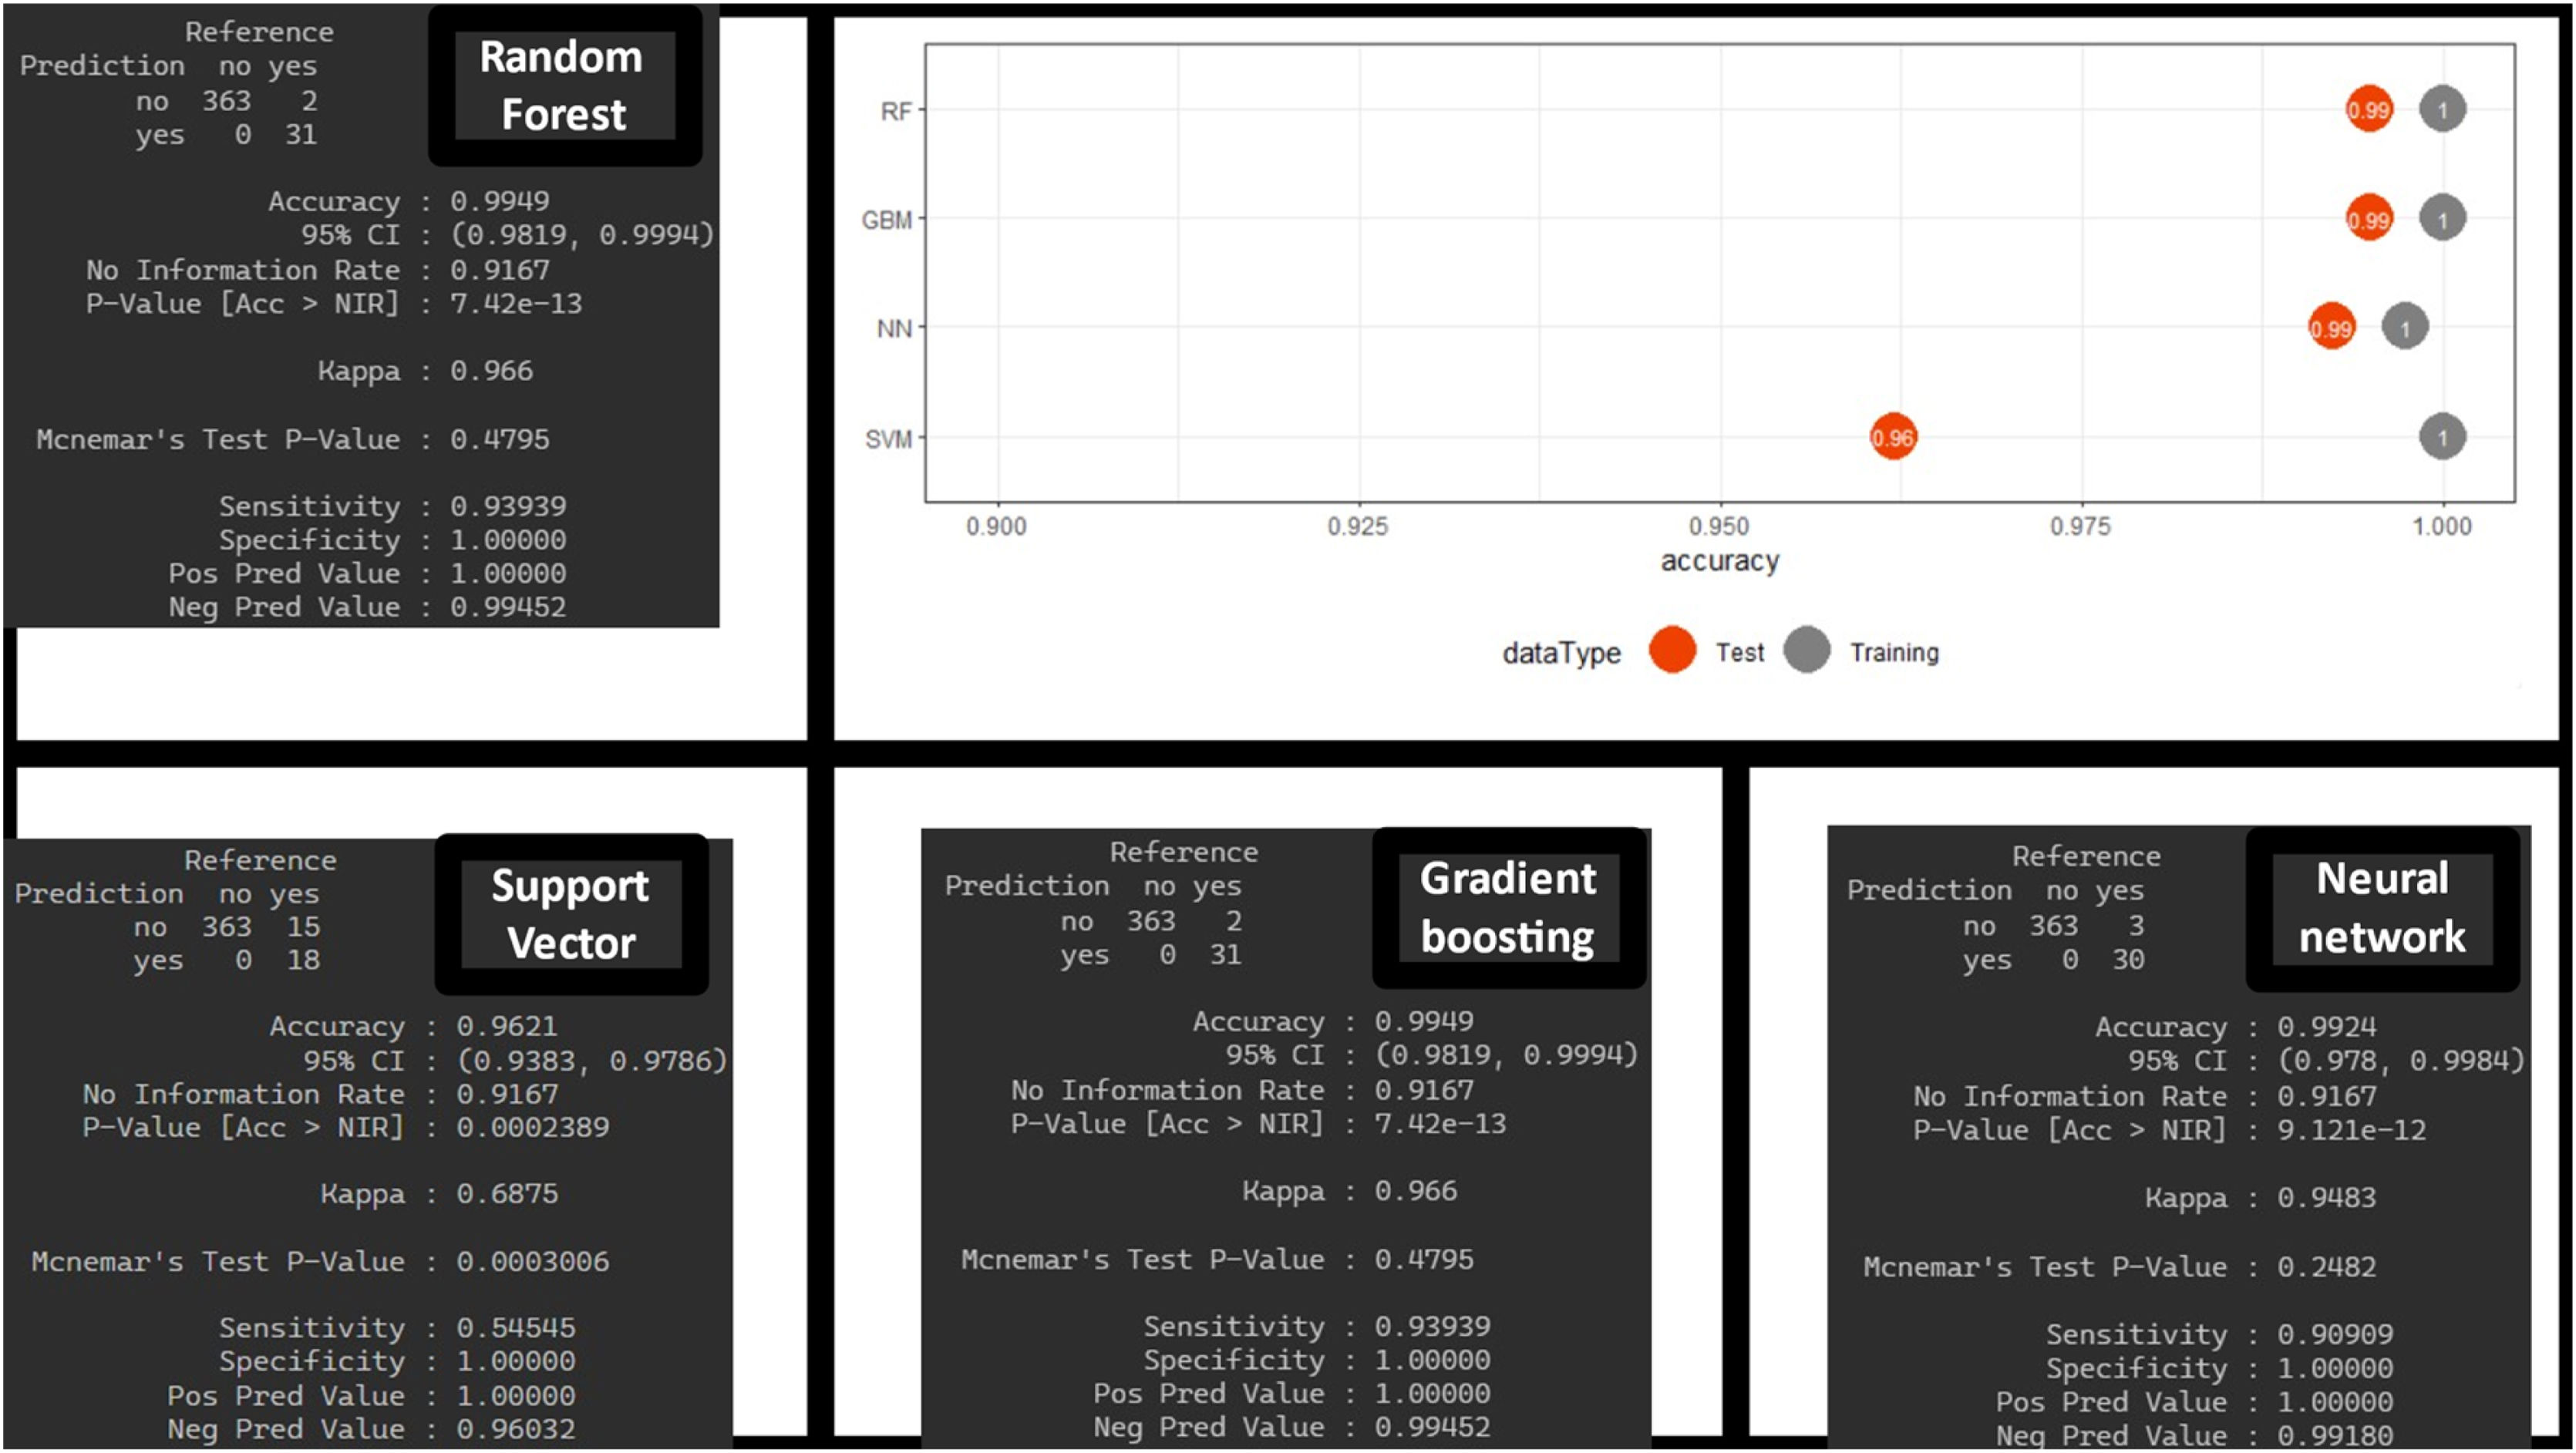
Significance of the variables of each algorithm. The top side of the image shows a graphical comparison of the results obtained from machine learning algorithms and the traditional predictive scores from the former study.5
It includes the ROC curve and the AUC with their confidence intervals (IC). Additionally, performance metrics such as sensitivity, specificity, positive predictive value (VPP), negative predictive value (VPN), and positive and negative likelihood ratios (LR+ and LR−) are shown here. The bottom shows the different results obtained by the machine learning models used to generate estimates.
Regarding the main objective, the ROC metric was obtained for the different MLA using the training set: RF (AUC 0.993, confidence interval (CI), 0.992−0.994), SVM (AUC, 0.99, CI, 0.995−0.997), GBM (AUC, 0.98, CI, 0.97−0.982), and NN (AUC, 0.99, CI, 0.98−0.991). This mean ROC curve value is an estimate obtained from multiple measurements using cross-validation (CV) (10 partitions, 100 repetitions, totaling 1000 measurements) on the training dataset (Fig. 3). Additionally, the following metrics are expressed: sensitivity, specificity, positive predictive value (PPV), negative predictive value (NPV), positive likelihood ratio (LR+), and negative likelihood ratio (LR−).
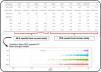
The estimate is obtained thanks to the CV technique, which provides robustness in the estimation (as seen in the values of the different CIs). These results are obtained with the training dataset. However, the true validation is performed with the test dataset showing very good results in the confusion matrix (with higher positive predictive values) and in the difference in accuracy between the training and test sets (Fig. 4). No significant differences were found between the different MLA regarding prediction.
MLA allow us to investigate the importance of each variable in the decision-making process (Fig. 2). Since each MLA has different internal rules, they yield different results.
DiscussionThe data obtained show a high predictive capacity of the different MLAs with higher AUCs compared to those reported by the TPS in the comparative study.5 The results obtained by the TPS, being confronted with real patients, could be considered more robust, while the results obtained by the MLA, being confronted with real and synthetic patients, could be considered more unstable and would require a validation study. We should mention that a specific statistical comparison is not established to determine if the MLA are truly superior to the TPS. However, there are indications that this could be the case: the confidence intervals of the different MLA are high and distant from the AUC results of the TPS. The sensitivity and specificity values corresponding to the best cut-off value of the ROC curve for the MLA show higher PPVs, NPVs, and LR+ compared to the TPS (Figs. 3 and 4).
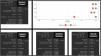
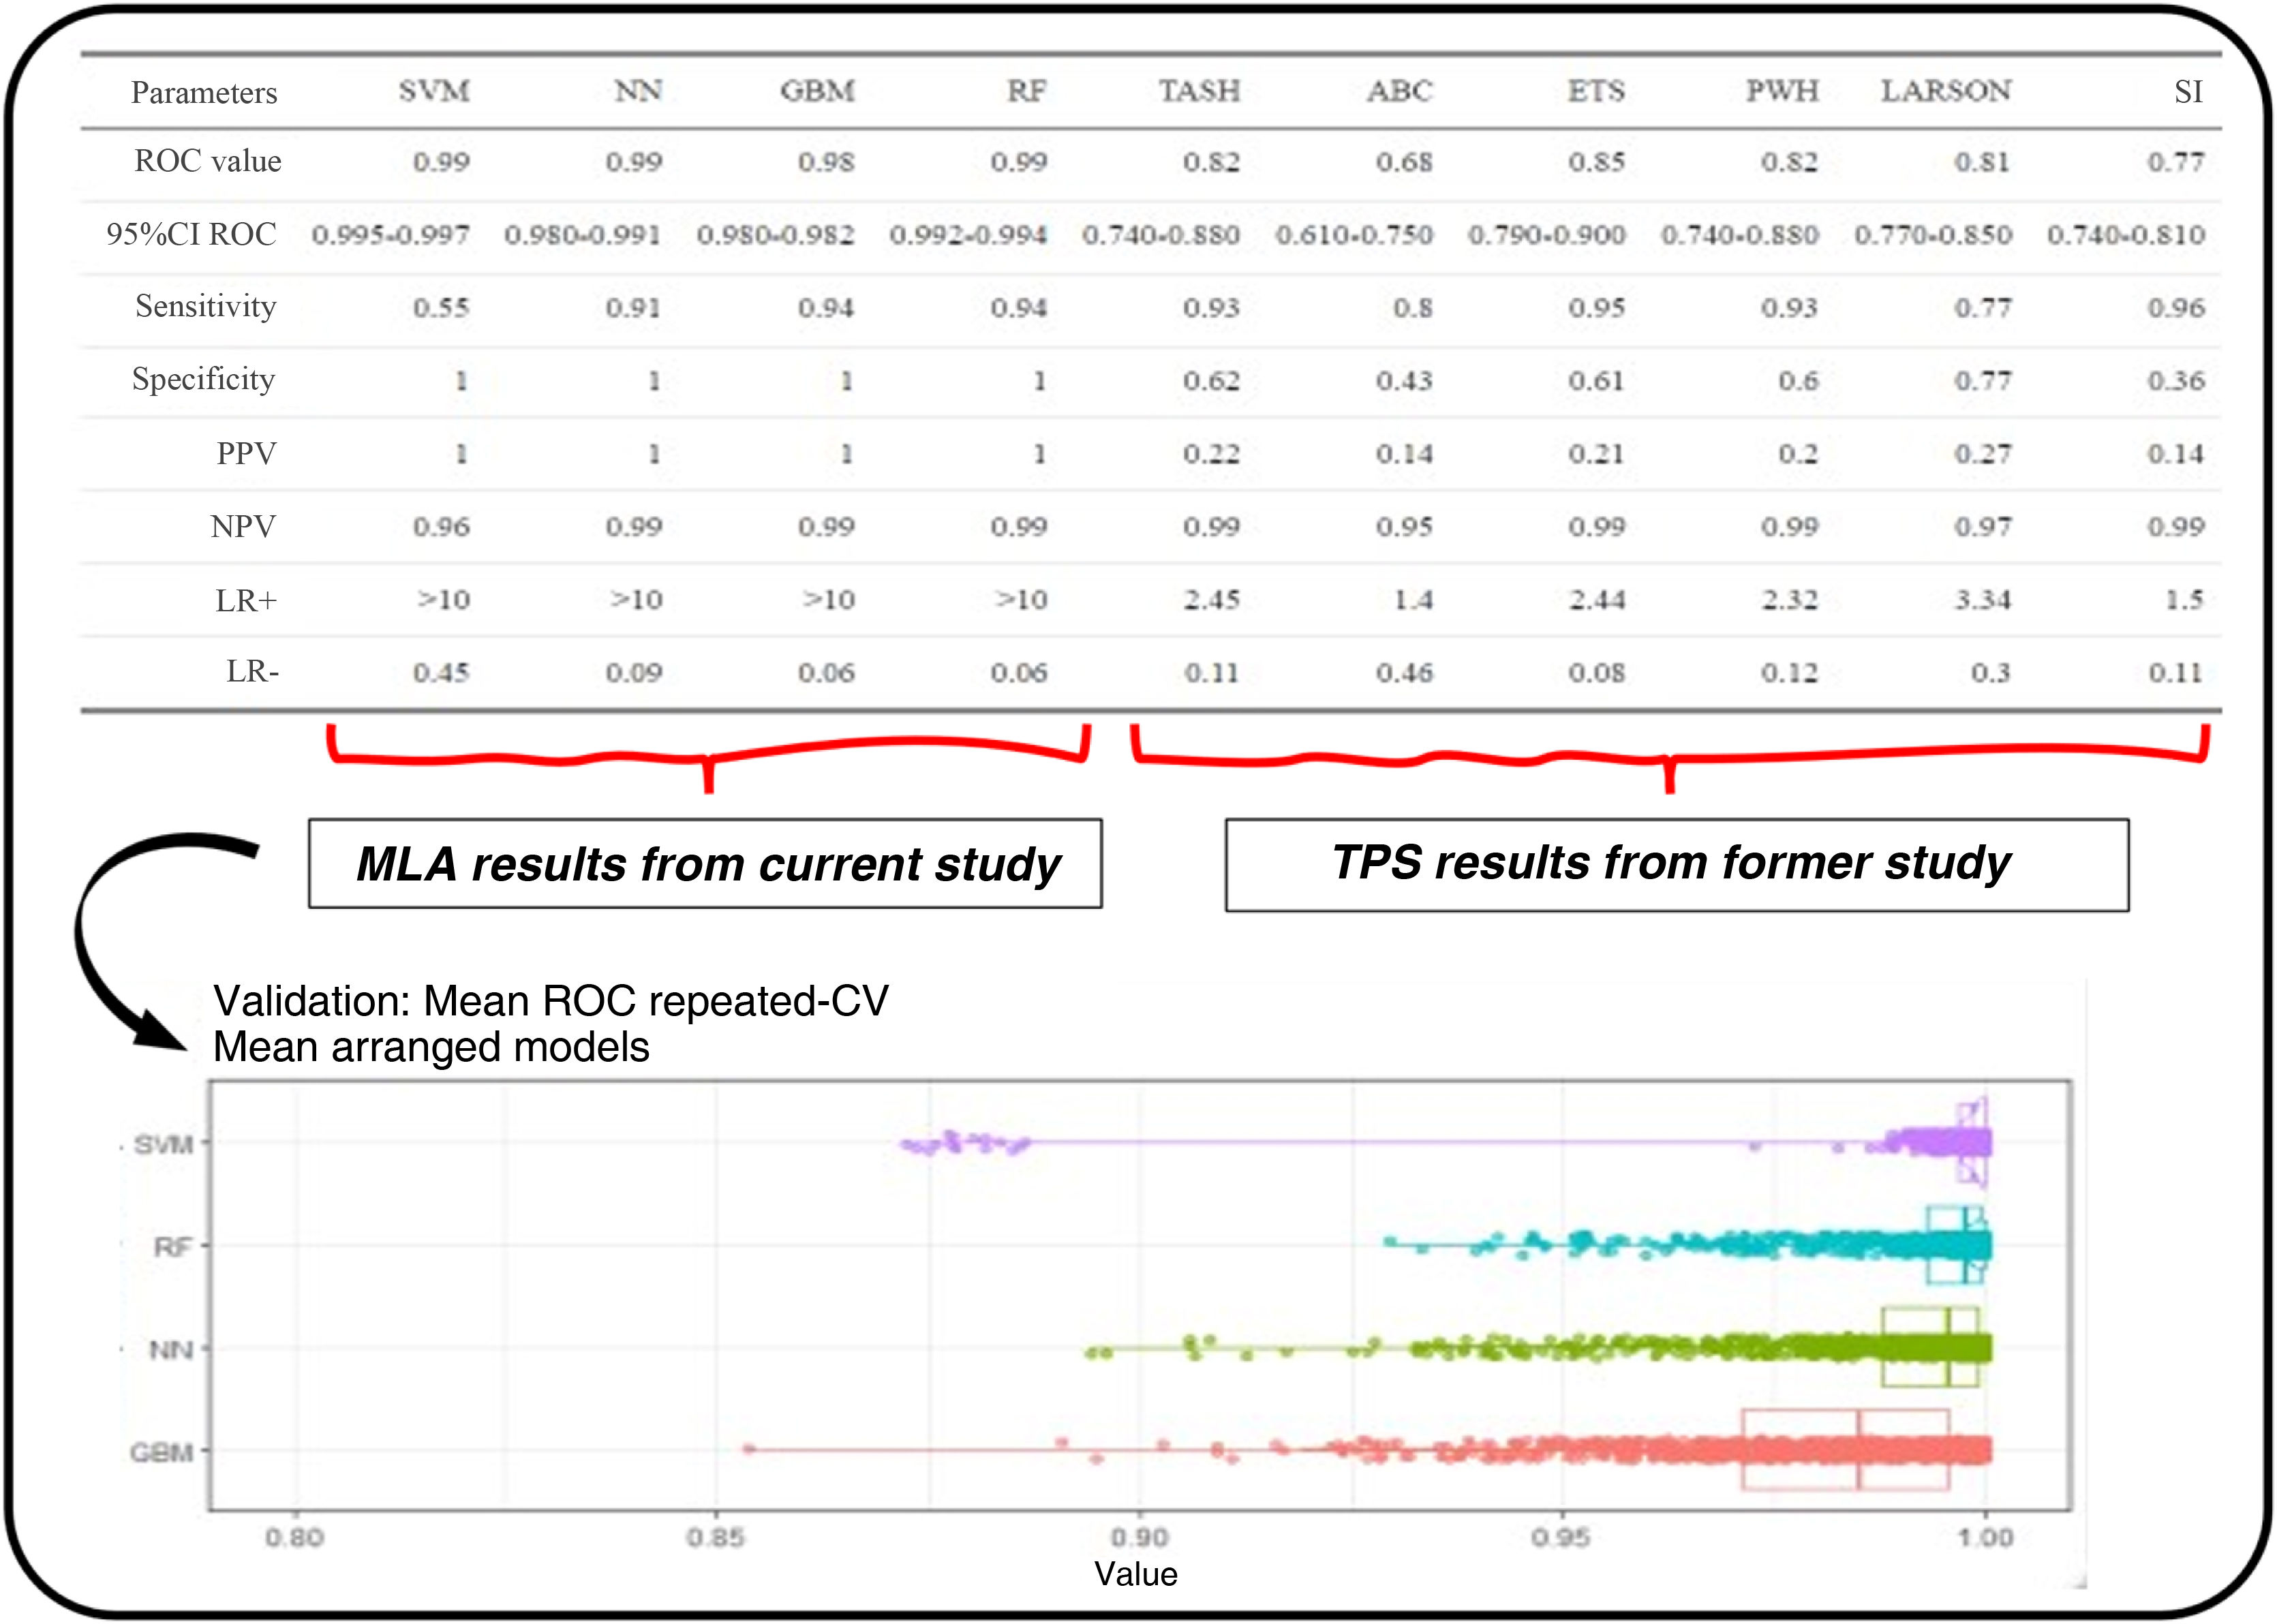
Similarly, each MLA offers a set of more important variables, which are not always fully coincidental. Generally, they include hemodynamic criteria (blood pressure, heart rate, and their relationship), resuscitation criteria (fluid therapy), and neurological criteria (presence of neurological impairment). As an example, we present the results obtained by the neural network (Fig. 5) where it is obvious that the most important variable regarding prediction is SI > fluids >HR > GCS > other variables. If an MLA performs better than the others regarding this problem, the importance of the variables may help us transfer its explainability to the clinical setting.
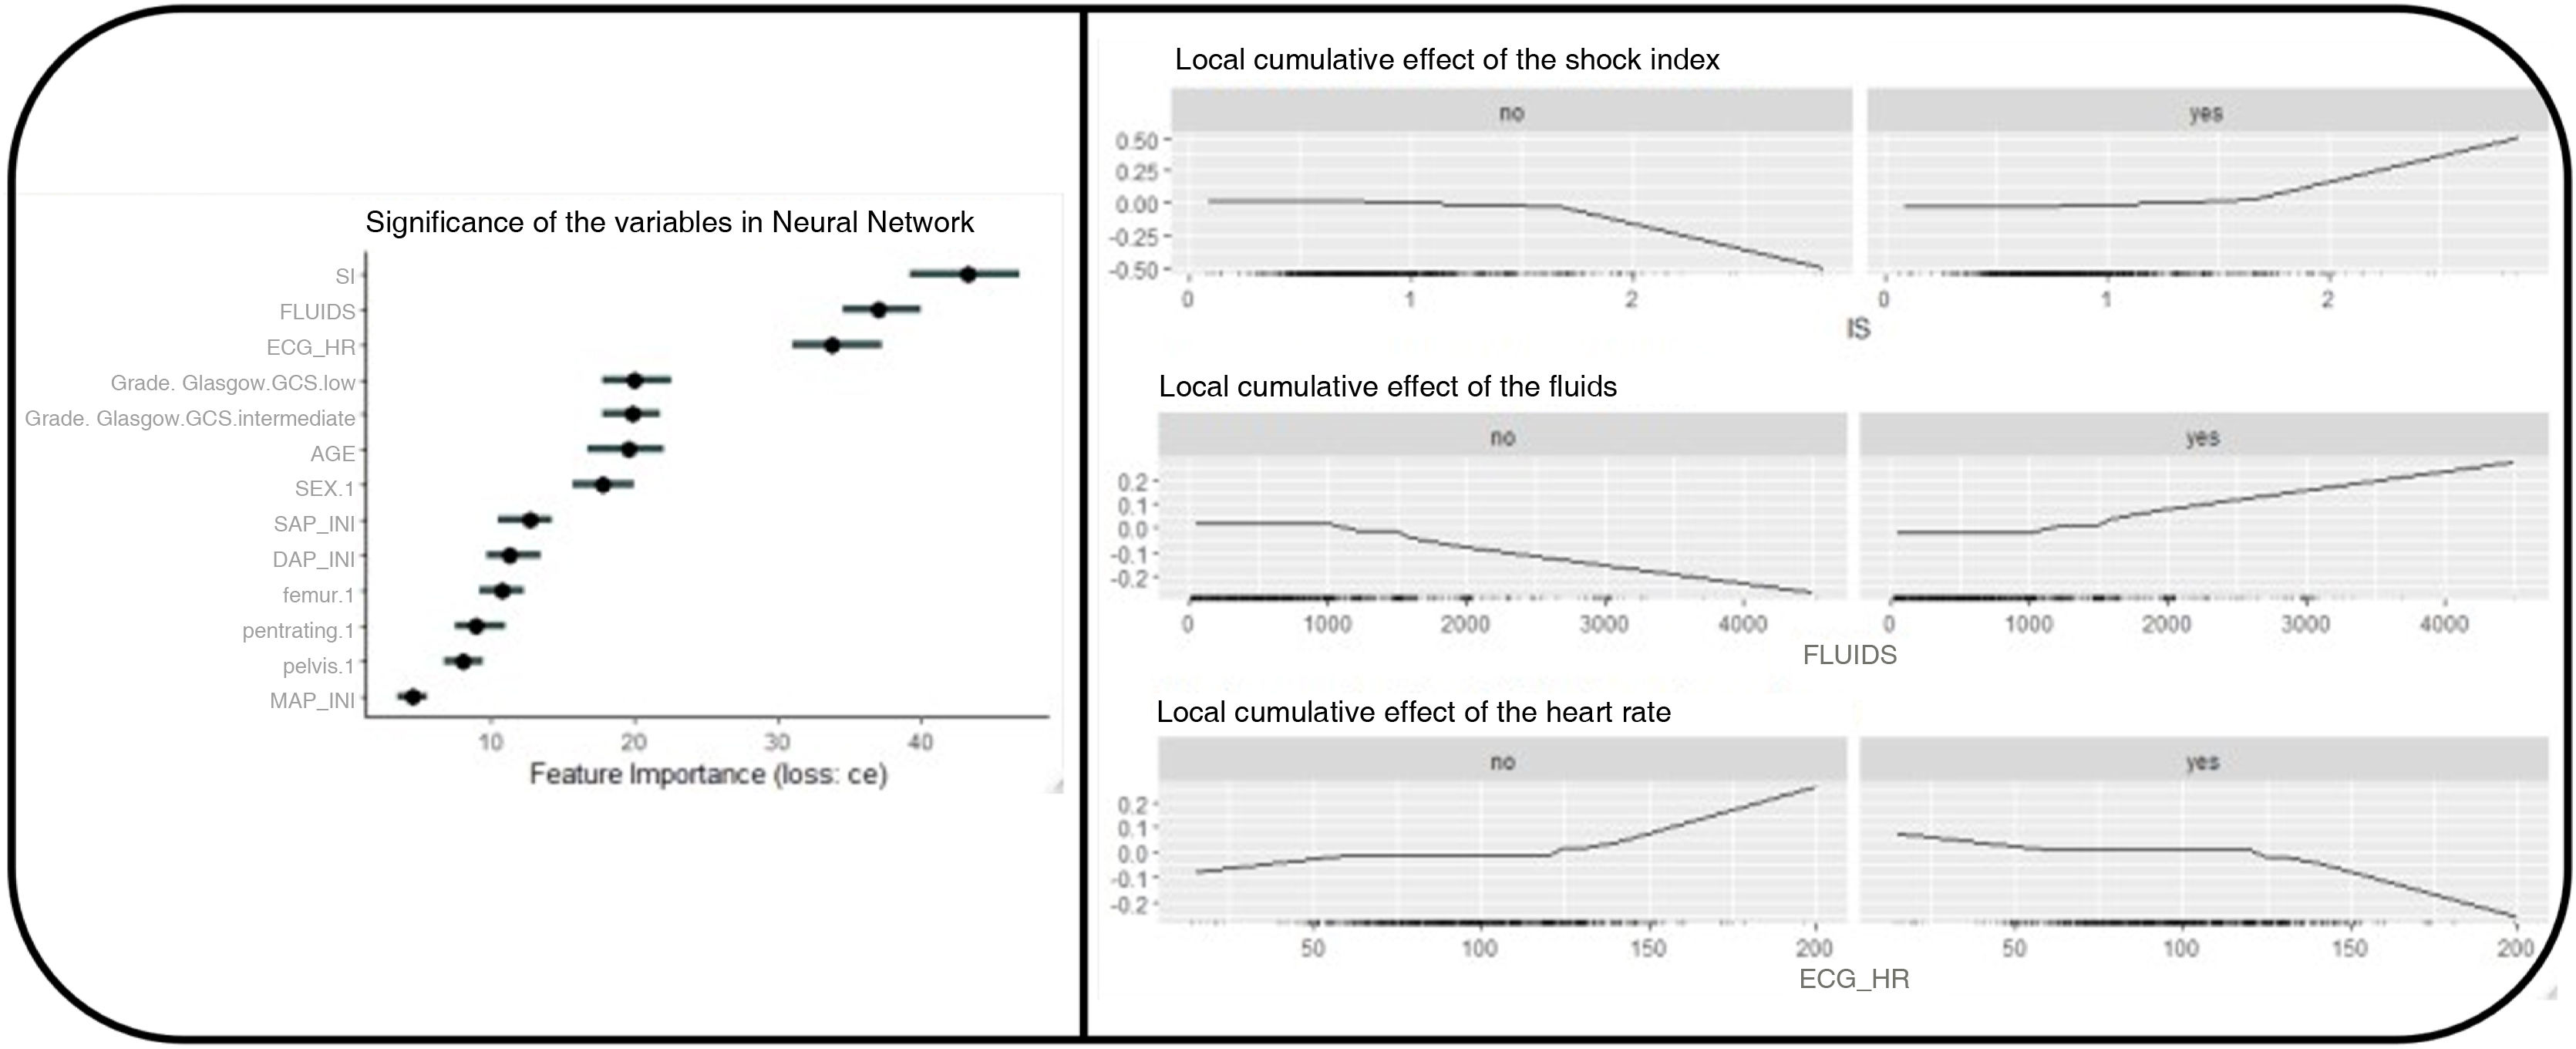
Significance of variables in the "neural network"-type MLA and non-linear evolution of the variables. We chose to select the "Neural Network" algorithm to explore the behavior of the variables. We can observe that the variable's behavior is nonlinear, which is one of the prerequisites for higher predictive quality.
There are 2 relevant clinical findings: (1) SBP does not consistently appear as one of the most important variables. This may be because SBP helps detect shock, but other variables provide more accurate and precise information on the degree of shock. Therefore, the SI may be more relevant than SBP itself. (2) We found that the presence of neurological impairment is predictive of massive hemorrhage. This finding was only seen within the TPS-MH in the PWH scale. It makes clinical sense as it can be indicative of severe cerebral hypoperfusion due to bleeding. This finding could lead to a debate on the monitorization of patients with hemorrhagic shock and mild brain injury, as it may be suggestive of profound shock rather than brain injury per se.
From a methodological point of view, this article highlights the high predictive capacity of MLA using only "basic" variables (without using biochemical or ultrasound measurements). Their high predictive capabilities may be attributed to: (1) the use of variables known to be relevant in the field of traumatic pathology providing an appropriate set of variables to the different MLA; (2) the integration of complex/non-linear interactions between variables that traditional models miss resembling clinical thinking; and (3) the ability to integrate variable variations in severity in a variable manner, rather than assigning fixed values to ranges within a variable (see Fig. 5). The predictive power of MLA invites 3 reflections: (1) increased use of these predictive systems, especially in an era of exponential data growth;22 (2) proactive addition of MLA into the routine clinical practice especially in time-dependent conditions;23 and (3) need to extend the use of MLA to the prehospital field to start prediction as early as possible.24
LimitationsThis study has several limitations: (1) The statistical techniques used are based on induction learning. This induction inevitably includes socio-sanitary aspects specific to a particular healthcare area with a proper out-of-hospital/hospital interaction. Therefore, these models cannot be blindly applied to other populations that do not share the same socio-sanitary context. While MLA can be added, the resulting mathematical models from MLA may not be easily applicable since every socio-sanitary model has unmeasured and unknown variables that influence outcomes differently. (2) The classification variable (presence of MH) does not include the entire clinical spectrum in which the activation of massive transfusion protocols (MTP) can be necessary and useful. In addition, data synthesis had to be performed to facilitate result learning and validation. (3) Some frequently used variables in the prehospital setting were not included or remained uncollected in the working database (mechanism of injury, lactate and hemoglobin levels, prehospital noradrenaline, prehospital ultrasound results, and orotracheal intubation). (4) The use of one of the predictors (IS) in our study could be criticized. However, we consider its use not as a predictor but as a variable. (5) The variable "prehospital fluid administration" is not an initial variable and may have certain individual bias. However, large prehospital fluid volumes are likely indicative of a patient with traumatic critical bleeding rather than lax fluid administration. (6) When results are very good, the possibility of overfitting should be considered especially after using SMOTE. This would require challenging the algorithm with new cases and observing its performance. If performance is good, we would have made sure that the algorithm captured patterns reflecting reality. If performance is lower than expected, it may be indicative that the algorithm has “learned the entire sample” rather than “harnessed reality” (true overfitting). (7) Desirable metrics when dealing with imbalanced data are precision-recall curves or the use of F1 score. However, the ROC curve was chosen for better comparability knowing that it can be "optimistic" in these situations. (8) A small database was used, and powerful data science techniques were applied so caution is advised when interpreting the results especially considering the use of SMOTE in the entire dataset. (9) The comparison of results from the former study with those of the validation set does not allow us to make proper statistical comparisons. Therefore, these results only suggest findings without categorical superiority based on the studied methodology.
ConclusionsMLA may outperform TPS regarding predictive capacity and help predict MH. Adequate comparative studies are needed. The most relevant variables include hemodynamic, resuscitation, and neurological impairment factors. These results support the development and addition of such statistical techniques into routine clinical practice as decision support tools.
Authors' contributionsAll authors have participated in the research work and preparation of this manuscript. Additionally, all authors reviewed and approved the final version of the article.
Marcos Valiente Fernández: Literature search, statistical analysis, and article writing.
Carlos García-Fuentes: Literature search, database management, data collection, statistical analysis, and article writing.
Francisco de Paula Delgado Moya: Manuscript drafting.
Adrián Morales Marcos: Methodology and manuscript drafting.
Hugo Fernández Hervás: Methodology and manuscript drafting.
Jesús Abelardo Mendoza: Methodology and manuscript drafting.
Carolina Mudarra Reche: Manuscript drafting.
Susana Bermejo Aznárez: Manuscript drafting.
Reyes Muñoz Calahorro: Methodology and manuscript drafting.
Laura López García: Manuscript drafting.
Fernando Monforte Escobar: Manuscript drafting and participation in prehospital database.
Mario Chico Fernández: Manuscript drafting.
The following is Supplementary data to this article: