


Central venous-arterial PCO2 to arterial-central venous O2 content ratio (Pcv-aCO2/Ca-cvO2) is commonly used as a surrogate for respiratory quotient (RQ) and tissue oxygenation. Although Pcv-aCO2/Ca-cvO2 might be associated with hyperlactatemia and outcome, neither the interchangeability with RQ nor the correlation with conclusive variables of anaerobic metabolism has never been demonstrated in septic shock. Our goal was to compare Pcv-aCO2/Ca-cvO2 and RQ in patients with septic shock.
DesignProspective, observational study.
SettingTwo adult ICUs.
PatientsForty-seven patients with septic shock on mechanical ventilation with stable respiratory settings and vasopressor dose after initial resuscitation.
InterventionsNone.
Main variables of interestWe measured arterial and central venous gases, Hb, and O2Hb. Pcv-aCO2/Ca-cvO2 and the ratio of central venous-arterial CO2 content to arterial-central venous O2 content (Ccv-aCO2/Ca-cvO2) were calculated. RQ was determined by indirect calorimetry.
ResultsPcv-aCO2/Ca-cvO2 and Ccv-aCO2/Ca-cvO2 were not correlated with RQ (R2 = 0.01, P = 0.50 and R2 = 0.01, P = 0.58, respectively), showing large bias and wide 95 % limits of agreement with RQ (1.09, -1.10−3.27 and 0.42, -1.53−2.37). A multiple linear regression model showed Hb, and central venous PCO2 and O2Hb, but not RQ, as Pcv-aCO2/Ca-cvO2 determinants (R2 = 0.36, P = 0.0007).
ConclusionsIn patients with septic shock, Pcv-aCO2/Ca-cvO2 did not correlate with RQ and was mainly determined by factors that modify the dissociation of CO2 from Hb. Pcv-aCO2/Ca-cvO2 seems to be a poor surrogate for RQ; therefore, its values should be interpreted with caution.
La relación entre la PCO2 venosa central-arterial y el contenido arterial-venoso central de O2 (Pvc-aCO2/Ca-vcO2) se emplea comúnmente como sustituto del cociente respiratorio (CR). Aunque la Pvc-aCO2/Ca-vcO2 puede asociarse a hiperlactacidemia y mayor mortalidad, la intercambiabilidad con CR y la correlación con variables definidas de metabolismo anaeróbico no se han demostrado en el shock séptico. Nuestro objetivo fue comparar Pvc-aCO2/Ca-vcO2 y CR en pacientes con shock séptico.
DiseñoEstudio observacional y prospectivo.
ÁmbitoDos UCIs de adultos.
PacientesCuarenta y siete pacientes con shock séptico, ventilados mecánicamente, y con condiciones respiratorias y dosis de vasopresores estables, luego de la resucitación inicial.
IntervencionesNinguna.
Variables de interés principalesSe midieron gases arteriales y venosos centrales, Hb y O2Hb. Se calcularon Pcv-aCO2/Ca-cvO2 y la relación entre contenido venoso central-arterial de CO2 y el contenido arterial-venoso central de O2 (Cvc-aCO2/Ca-vcO2). El CR se determinó por calorimetría indirecta.
ResultadosPvc-aCO2/Ca-vcO2 y Cvc-aCO2/Ca-vcO2 no correlacionaron con CR (R2 = 0.01, P = 0.50 and R2 = 0.01, P = 0.58, respectivamente) y tuvieron amplios sesgos y límites de concordancia del 95 % (1.09, -1.10−3.27 y 0.42, -1.53−2.37). El modelo de regresión lineal múltiple encontró Hb, PCO2 venosa central y O2Hb, pero no CR, como determinantes de Pvc-aCO2/Ca-vcO2 (R2 = 0.36, P = 0.0007).
ConclusionesIn pacientes con shock séptico, Pvc-aCO2/Ca-vcO2 no tuvo correlación con CR y estuvo determinada principalmente por factores que modifican la disociación de CO2 desde la Hb. Pvc-aCO2/Ca-vcO2 parece ser un pobre sustituto de CR y sus valores deben interpretarse con precaución.
The normalization of tissue perfusion and oxygenation is the final goal of septic shock resuscitation. Unfortunately, there is no gold standard for evaluation of tissue oxygenation. The presence of hyperlactatemia or alterations in peripheral perfusion does not necessarily indicate tissue hypoxia In experimental models of oxygen supply dependence, the abrupt increase in respiratory quotient (RQ)—the ratio of CO2 production (VCO2) to O2 consumption (VO2)—indicates the beginning of anaerobic metabolism.1–4 The RQ rises because the drop in VO2 exceeds the reduction in VCO2. Although VCO2 and VO2 decrease as a reflection of oxidative metabolism derangement, the lower reduction in the former is explained by the surge in anaerobic VCO2 due to bicarbonate buffering of anaerobically generated protons.
The measurement of RQ requires a metabolic cart, which is not usually available in the ICU. Thus, the ratio of mixed venous minus arterial PCO2 to arterial minus mixed venous O2 content (Pmv-aCO2/Ca-mvO2) was proposed as a surrogate for RQ. In an observational study, values of Pmv-aCO2/Ca-mvO2 higher than 1.4 were associated with hyperlactatemia and worse outcome.5 Thereafter, other studies used the ratio of venous minus arterial PCO2 to arterial minus central venous O2 content (Pcv-aCO2/Ca-cvO2) to assess global oxygenation.6–9 To improve the ability of Pcv-aCO2/Ca-cvO2 and Pmv-aCO2/Ca-mvO2 to reflect RQ, calculated CO2 content difference has been used instead of PCO2 difference in the computation of the ratios.6,10 Pcv-aCO2/Ca-cvO2 is thus recommended for the assessment of tissue oxygenation.11,12 Even though Pcv-aCO2/Ca-cvO2 might be associated with hyperlactatemia and outcome, neither the interchangeability with RQ nor the correlation with conclusive variables of anaerobic metabolism has never been demonstrated in septic shock. Besides, basic research suggested that Pmv-aCO2/Ca-mvO2 is more dependent on factors than modify the dissociation of CO2 from Hb than on the actual RQ and that it can increase in presence of preserved tissue oxygenation.13 In addition, experimental studies failed to show a good correlation between Pmv-aCO2/Ca-mvO2 and RQ.13,14
Our goal was to compare Pcv-aCO2/Ca-cvO2 and RQ in patients with septic shock. Our hypothesis was that Pcv-aCO2/Ca-cvO2 is a poor surrogate for RQ. A secondary goal was to assess Pcv-aCO2/Ca-cvO2 determinants.
Patients and methodsThis study was approved by the Institutional Review Board (Comité de Revisión Institucional del Hospital Británico) on September 17, 2021 (CRIHB#865, project title: Comparison of Pcv-aCO2/Ca-cvO2 and respiratory quotient in patients with septic shock). The study was conducted in accordance with the Declaration of Helsinki of 1975. Informed consent was obtained from the patient's next of kin. We followed the Strengthening the Reporting of Observational Studies in Epidemiology (STROBE) recommendations for reporting cohort studies. The completed checklist is included in the Appendix.
We studied patients older than 18 years recruited from two surgical/medical ICUs, from June 2020 to March 2023. Septic shock diagnosis was based on the presence of a source of infection, arterial hypotension refractory to fluid administration and so requiring vasopressors, and blood lactate levels higher than 2.0 mmol/L.15 All patients were intubated and mechanically ventilated on controlled mode, and received infusions of midazolam or propofol and fentanyl. The Richmond Agitation-Sedation Scale was -5 for all patients.16 Patients were included after initial resuscitation, when respiratory settings and vasopressor dose remained stable over 1 h. Patients with FiO2 ≥0.60, PEEP > 10 cm H2O, tidal volume <300 mL, renal replacement therapy, or airway leaks, were excluded from the study since indirect calorimetry measurements might be unreliable in such conditions.
Demographic and clinical data were registered. We measured VO2, VCO2, and RQ by indirect calorimetry (MedGraphics CPX Ultima, Medical Graphics Corporation, St. Paul, MN, and Mindray Metabolic Module, Mindray Medical International, Shenzhen, China). We used the mean of a 5-minute period of measurements when variations were less than 5%.17 During this period of time, arterial and central venous samples were simultaneously obtained for the determination of pH, PCO2, PO2, Hb, and O2Hb (Cobas b 221, Roche Diagnostics GmbH, Mannheim, Germany). We calculated Pcv-aCO2/Ca-cvO2 by standard formulae and the ratio central venous minus arterial CO2 content to arterial minus central venous O2 content (Ccv-aCO2/Ca-cvO2) by the Douglas’ algorithm.18 P50, the PO2 at which Hb is 50 % saturated, was also calculated. A complete depiction of the formulae is shown in the Appendix.
Analysis of the dataWe estimated that 47 patients were required to demonstrate a moderate correlation between Pcv-aCO2/Ca-cvO2 and RQ (r = 0.40), with a significance level of 0.05 and power of 80 %. Shapiro-Wilk test and quantile-quantile plots of the differences were used to test data normality. Correlation and agreement between Pcv-aCO2/Ca-cvO2 and Pcv-aCO2/Ca-cvO2 with RQ were assessed with simple linear regression and Bland and Altman analysis. To identify independent determinants of Pcv-aCO2/Ca-cvO2, variables showing a P-value <0.20 in the simple linear regression and those physiologically plausible were entered into multiple linear regression analysis and a model was constructed. Differences between survivors and nonsurvivors patients were assessed by unpaired t-test, Mann-Whitney U-test, or Chi-square test. Patients were also compared according to arbitrary cutoffs of Pcv-aCO2/Ca-cvO2 and RQ (1.4 and 1.0, respectively). Data are shown as mean ± standard deviation, median [IQR], or n (%). A P-value <0.05 was considered as statistically significant.
ResultsFrom 341 screened patients with septic shock, 47 of them were included. The time between the onset of shock and the measurements was 1 [1–3] days. Most of the patients were not studied because indirect calorimetry measurements were not available at the screening time. The flowchart of the study is shown in the Appendix (Figure A1).
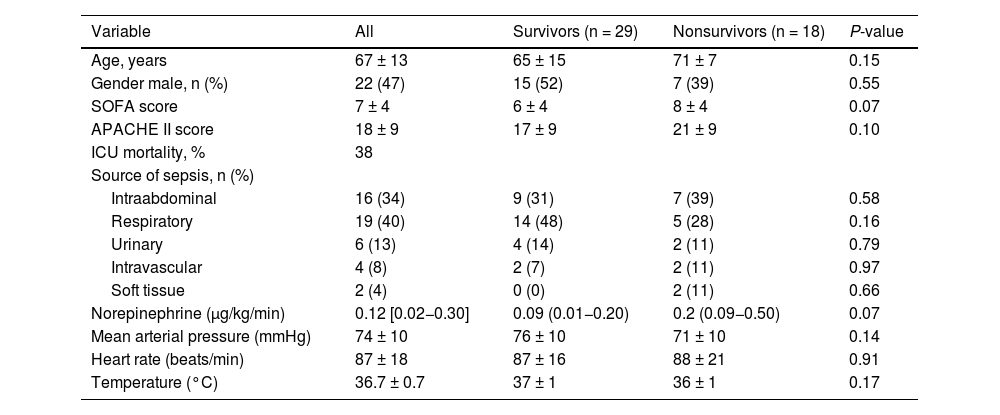
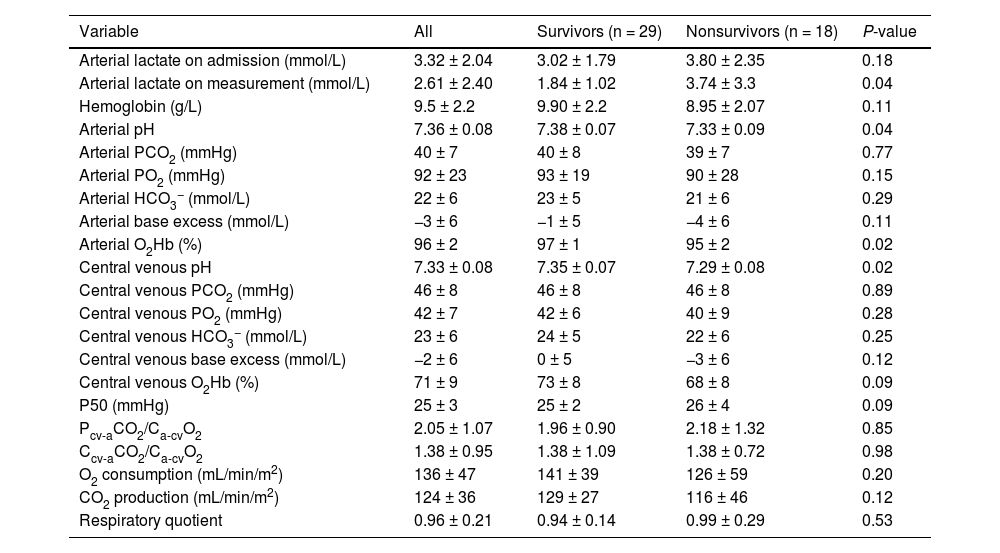
Table 1 shows the main epidemiological and clinical characteristics that did not differ between survivors and nonsurvivors. Neither there were differences according to the cutoffs of Pcv-aCO2/Ca-cvO2 and RQ (Tables A1 and A2). Nonsurvivors showed lower pH and higher lactate levels than survivors. Survivors and nonsurvivors had high mean values of Pcv-aCO2/Ca-cvO2 and Ccv-aCO2/Ca-cvO2, which were not different between groups. Values of RQ were in the normal range and not different between groups (Table 2). Patients with Pcv-aCO2/Ca-cvO2 <1.4 had lower arterial and central venous bicarbonate, and lower central venous PCO2 than patients with Pcv-aCO2/Ca-cvO2 >1.4 (Table A3) Patients with RQ < 1.0 showed higher VO2 and central venous PO2 than patients with RQ > 1.0 (Table A4). Arterial lactate was not different among these subgroups (Tables A3 and A4).
Clinical and epidemiologic characteristics of the patients.
| Variable | All | Survivors (n = 29) | Nonsurvivors (n = 18) | P-value |
|---|---|---|---|---|
| Age, years | 67 ± 13 | 65 ± 15 | 71 ± 7 | 0.15 |
| Gender male, n (%) | 22 (47) | 15 (52) | 7 (39) | 0.55 |
| SOFA score | 7 ± 4 | 6 ± 4 | 8 ± 4 | 0.07 |
| APACHE II score | 18 ± 9 | 17 ± 9 | 21 ± 9 | 0.10 |
| ICU mortality, % | 38 | |||
| Source of sepsis, n (%) | ||||
| Intraabdominal | 16 (34) | 9 (31) | 7 (39) | 0.58 |
| Respiratory | 19 (40) | 14 (48) | 5 (28) | 0.16 |
| Urinary | 6 (13) | 4 (14) | 2 (11) | 0.79 |
| Intravascular | 4 (8) | 2 (7) | 2 (11) | 0.97 |
| Soft tissue | 2 (4) | 0 (0) | 2 (11) | 0.66 |
| Norepinephrine (μg/kg/min) | 0.12 [0.02−0.30] | 0.09 (0.01−0.20) | 0.2 (0.09−0.50) | 0.07 |
| Mean arterial pressure (mmHg) | 74 ± 10 | 76 ± 10 | 71 ± 10 | 0.14 |
| Heart rate (beats/min) | 87 ± 18 | 87 ± 16 | 88 ± 21 | 0.91 |
| Temperature (°C) | 36.7 ± 0.7 | 37 ± 1 | 36 ± 1 | 0.17 |
Abbreviations: SOFA, Sepsis-related Organ Failure Assessment; APACHE, Acute Physiology and Chronic Health Evaluation.
Data are expressed as mean ± standard deviation, median [IQR], or n (%).
Values of arterial and central venous gases, co-oximetry, CO2-derived variables, and expired gases analysis.
| Variable | All | Survivors (n = 29) | Nonsurvivors (n = 18) | P-value |
|---|---|---|---|---|
| Arterial lactate on admission (mmol/L) | 3.32 ± 2.04 | 3.02 ± 1.79 | 3.80 ± 2.35 | 0.18 |
| Arterial lactate on measurement (mmol/L) | 2.61 ± 2.40 | 1.84 ± 1.02 | 3.74 ± 3.3 | 0.04 |
| Hemoglobin (g/L) | 9.5 ± 2.2 | 9.90 ± 2.2 | 8.95 ± 2.07 | 0.11 |
| Arterial pH | 7.36 ± 0.08 | 7.38 ± 0.07 | 7.33 ± 0.09 | 0.04 |
| Arterial PCO2 (mmHg) | 40 ± 7 | 40 ± 8 | 39 ± 7 | 0.77 |
| Arterial PO2 (mmHg) | 92 ± 23 | 93 ± 19 | 90 ± 28 | 0.15 |
| Arterial HCO3− (mmol/L) | 22 ± 6 | 23 ± 5 | 21 ± 6 | 0.29 |
| Arterial base excess (mmol/L) | −3 ± 6 | −1 ± 5 | −4 ± 6 | 0.11 |
| Arterial O2Hb (%) | 96 ± 2 | 97 ± 1 | 95 ± 2 | 0.02 |
| Central venous pH | 7.33 ± 0.08 | 7.35 ± 0.07 | 7.29 ± 0.08 | 0.02 |
| Central venous PCO2 (mmHg) | 46 ± 8 | 46 ± 8 | 46 ± 8 | 0.89 |
| Central venous PO2 (mmHg) | 42 ± 7 | 42 ± 6 | 40 ± 9 | 0.28 |
| Central venous HCO3− (mmol/L) | 23 ± 6 | 24 ± 5 | 22 ± 6 | 0.25 |
| Central venous base excess (mmol/L) | −2 ± 6 | 0 ± 5 | −3 ± 6 | 0.12 |
| Central venous O2Hb (%) | 71 ± 9 | 73 ± 8 | 68 ± 8 | 0.09 |
| P50 (mmHg) | 25 ± 3 | 25 ± 2 | 26 ± 4 | 0.09 |
| Pcv-aCO2/Ca-cvO2 | 2.05 ± 1.07 | 1.96 ± 0.90 | 2.18 ± 1.32 | 0.85 |
| Ccv-aCO2/Ca-cvO2 | 1.38 ± 0.95 | 1.38 ± 1.09 | 1.38 ± 0.72 | 0.98 |
| O2 consumption (mL/min/m2) | 136 ± 47 | 141 ± 39 | 126 ± 59 | 0.20 |
| CO2 production (mL/min/m2) | 124 ± 36 | 129 ± 27 | 116 ± 46 | 0.12 |
| Respiratory quotient | 0.96 ± 0.21 | 0.94 ± 0.14 | 0.99 ± 0.29 | 0.53 |
Abbreviations: Pcv-aCO2/Ca-cvO2, central venous-arterial PCO2 to arterial-central venous O2 content ratio; Pcv-aCO2/Ca-cvO2, central venous-arterial PCO2 to arterial-central venous O2 content ratio.
Pcv-aCO2/Ca-cvO2 and Ccv-aCO2/Ca-cvO2 showed weak correlations and wide 95 % limits of agreement with RQ (Fig. 1). Similar correlations were obtained considering the different metabolic carts used in each hospital (R2 = 0.00, P = 0.71 and R2 = 0.00, P = 0.81 for MedGraphics CPX Ultima, and R2 = 0.05, P = 0.57 and R2 = 0.03, P = 0.64 for Mindray Metabolic Module).
 and respiratory quotient. Panel B: Bland and Altman analysis between Pcv-aCO2/Ca-cvO2 and respiratory quotient. Panel C: Correlation between central venous minus arterial CO2 content to arterial minus central venous O2 content ratio (Ccv-aCO2/Ca-cvO2) and respiratory quotient. Panel D: Bland and Altman analysis between Ccv-aCO2/Ca-cvO2 and respiratory quotient.")
Correlation and agreement of central venous minus arterial PCO2 to arterial minus central venous O2 content and central venous minus arterial CO2 content to arterial minus central venous O2 content ratio with respiratory quotient. Panel A: Correlation between central venous minus arterial PCO2 to arterial minus central venous O2 content ratio (Pcv-aCO2/Ca-cvO2) and respiratory quotient. Panel B: Bland and Altman analysis between Pcv-aCO2/Ca-cvO2 and respiratory quotient. Panel C: Correlation between central venous minus arterial CO2 content to arterial minus central venous O2 content ratio (Ccv-aCO2/Ca-cvO2) and respiratory quotient. Panel D: Bland and Altman analysis between Ccv-aCO2/Ca-cvO2 and respiratory quotient.
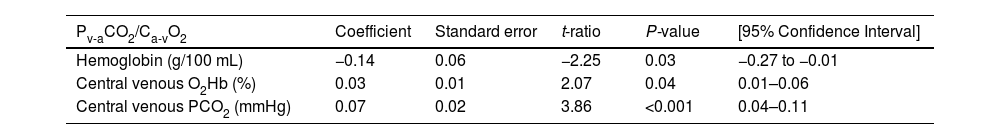
The multiple linear regression model showed hemoglobin, central venous PCO2, and central venous O2Hb as Pcv-aCO2/Ca-cvO2 determinants (R2 = 0.36, P = 0.0007) (Table 3).
Multiple linear regression model for central venous-arterial PCO2 to arterial minus central venous O2 content ratio (Pcv-aCO2/Ca-cvO2).
| Pv-aCO2/Ca-vO2 | Coefficient | Standard error | t-ratio | P-value | [95% Confidence Interval] |
|---|---|---|---|---|---|
| Hemoglobin (g/100 mL) | −0.14 | 0.06 | −2.25 | 0.03 | −0.27 to −0.01 |
| Central venous O2Hb (%) | 0.03 | 0.01 | 2.07 | 0.04 | 0.01–0.06 |
| Central venous PCO2 (mmHg) | 0.07 | 0.02 | 3.86 | <0.001 | 0.04–0.11 |
Our main finding was the absence of a significant correlation between of Pcv-aCO2/Ca-cvO2 and RQ. In addition, Pcv-aCO2/Ca-cvO2 was independently determined by factors that modify the dissociation of CO2 from Hb.
Since RQ has sudden increases during experimental models of oxygen supply dependency,1–4 a surrogatePcv-aCO2/Ca-cvO2has been used as a tool to assess the adequacy of tissue oxygenation. Thus, observational studies found some relationship of Pcv-aCO2/Ca-cvO2 to hyperlactatemia and outcome.5–9 Nevertheless, the agreement between Pcv-aCO2/Ca-cvO2 and RQ, and its ability to reflect tissue hypoxia have never been shown. In addition, a randomized controlled trials failed to show usefulness of Pcv-aCO2/Ca-cvO2 as a goal for resuscitation.19 Despite lack of clear evidence, some reviews have recommended its utilization and incorporated it in algorithms for the assessment and treatment of shock states.11,12 As recently shown in a systematic review and meta-analysis, high values of Pcv-aCO2/Ca-cvO2 have an association with mortality.20 The ability to predict outcome, however, is similar or probably lower than that of lactate. Moreover, its prognostic value might be related to some of its determinants—anemia and metabolic acidosis—and not to the ability to reflect anaerobic metabolism.
The rationale for the use of Pcv-aCO2/Ca-cvO2 in the assessment of tissue oxygenation in patients with septic shock is based on the behavior of RQ in animal models of anaerobic metabolism.1–4 Yet, no clinical study has comprehensively addressed this issue.21 On the other hand, experimental studies showed that Pmv-aCO2/Ca-mvO2 might not reflect the changes in the RQ and the adequacy of tissue oxygenation. During stepwise reductions in oxygen transport (DO2), Pmv-aCO2/Ca-mvO2 was almost five times higher in anemic than in ischemic hypoxia despite comparable degrees of anaerobic metabolism.13 Moreover, Pmv-aCO2/Ca-mvO2 increased even before the beginning of the oxygen supply dependence and the rise of RQ. Similar results were reported in hypoxic hypoxia.22 In experimental hemorrhagic shock, blood transfusion was associated with restoration of oxidative metabolism, as shown by the normalization of oxygen transport, VO2, and RQ. Despite this, Pmv-aCO2/Ca-mvO2 remained elevated.14
In our series of patients with septic shock, there was no correlation between Pcv-aCO2/Ca-cvO2 and RQ. Moreover, high Pcv-aCO2/Ca-cvO2 values coexisted with normal values of RQ. These findings might be explained by the fact that Pcv-aCO2/Ca-cvO2 is more dependent on Hb levels, Haldane effect, metabolic acidosis, and the position in the CO2Hb dissociation, than on the actual RQ.13 In the present study, we also showed that Pcv-aCO2/Ca-cvO2 depends on some factors that modify dissociation of CO2 from Hb, such as Haldane effect and Hb levels. In contrast, we found that base excess or lactate did not behave as determinants Pcv-aCO2/Ca-cvO2.
Unlike animal studies that show poor but significant correlations,13,14 we found an almost null regression coefficient between Pcv-aCO2/Ca-cvO2 and RQ. Differences might be related to different facts. In animal studies, mixed venous instead of central venous samples were used for the calculation of the ratio. An observational study in patients with septic shock showed the lack of interchangeability between both determinations, with unacceptable wide 95% limits of agreement of 1.48.23 The main explanation, however, might be that in the experimental studies there was a wide range of variation in the RQ, which increased during the severe reductions in DO2. On the contrary, RQ remained in the normal physiologic range in the present study. Thus, RQ is a main determinant of Pcv-aCO2/Ca-cvO2 only in real anaerobic conditions.
We found high values of Pcv-aCO2/Ca-cvO2 and Cv-aCO2/Ca-cvO2 (2.05 ± 1.07 and 1.38 ± 0.95, respectively) that could be considered indicative of anaerobic metabolism.1,4 Even though our patients were critically ill, the respiratory and the hemodynamic status and the norepinephrine requirement had been unchanged over the last hour. Moreover, the RQ stayed at normal range (0.96 ± 0.21). Consequently, their condition did not evoke a state of oxygen supply dependence, which is characterized by a rapid decline leading to cardiac arrest. The surge in RQ that develops in models of tissue hypoxia constitutes an extreme event associated with an impending death (i.e., mean blood pressure of 27 ± 2 mmHg in hemorrhagic shock or Hb of 1.2 ± 0.1 g/dL in hemodilution).13 Therefore, it is unlikely that the high Pcv-aCO2/Ca-cvO2 and Cv-aCO2/Ca-cvO2 found in this study can denote global tissue hypoxia. Accordingly, arterial lactate levels did not differ between patients with Pcv-aCO2/Ca-cvO2 lower or higher than 1.4. In line with our results, Pcv-aCO2/Ca-cvO2 did not predict the decrease blood lactate after increases in cardiac output induced by volume expansion in critically ill patients.24 Pcv-aCO2/Ca-cvO2 neither correlated with lactate-to-pyruvate ratio during the resuscitation of septic shock.25
Although the incorporation of CO2 content instead of PCO2 difference in the calculation might improve the performance of the ratio, Ccv-aCO2/Ca-cvO2 also showed poor correlation with RQ. This finding is probably related to limitations of the calculation of CO2 content: it frequently results in unacceptable errors, such as negative Ccv-aCO2/Ca-cvO2. Indeed, this occurred in three of our measurements suggesting that the algorithm might be misleading for this purpose (see Fig. 1 Panel C).
Our study has some limitations. We only performed a single set of measurements at a particular timepoint, which could not be representative of patients’ evolution over time. In addition, many patients were not included because indirect calorimetry was unavailable. This might limit the generalizability of our findings. Finally, each center used a different metabolic cart, each of which was previously validated.26–28 Since the results of different devices are not interchangeable, this could be a further drawback of the study.26 In spite of this, the results were quite similar considering each device separately.
ConclusionsTo our knowledge, this is the first study comparing Pcv-aCO2/Ca-cvO2 and Ccv-aCO2/Ca-cvO2 with RQ, in patients with septic shock. Neither Pcv-aCO2/Ca-cvO2 nor Ccv-aCO2/Ca-cvO2 was correlated with RQ. Our results suggest that in patients with septic shock Pcv-aCO2/Ca-cvO2 should be interpreted cautiously.
Conflict of interestThe authors declare that they have no competing interests.
Authors’ contributionsConception and design: FJG, MOP, and AD; acquisition of data: FJG, MN, SPC, NL, MJR, PNRB, and VSKE; statistical analysis: FJG; drafting of the manuscript: FJG and AD. All authors critically revised the article and approved the final version.
FundingThis study was supported by the grant PICT-2018-03977, Agencia Nacional de Promoción Científica y Tecnológica, Argentina, which was not involved in study design; in the collection, analysis and interpretation of data; in the writing of the report; and in the decision to submit the article for publication.
The following is Supplementary data to this article:

