

Compare prevalence and profile of post-intensive care patient (P-PICS) and family/caregiver (F-PICS) syndrome in two cohorts (COVID and non-COVID) and analyse risk factors for P-PICS.
DesignProspective, observational cohort (March 2018–2023), follow-up at three months and one year.
Setting14-bed polyvalent Intensive Care Unit (ICU), Level II Hospital.
Patients or participants265 patients and 209 relatives. Inclusion criteria patients: age > 18 years, mechanical ventilation > 48 h, ICU stay > 5 days, delirium, septic shock, acute respiratory distress syndrome, cardiac arrest. Inclusion criteria family: those who attended.
InterventionsFollow-up 3 months and 1 year after hospital discharge.
Main variables of interestPatients: sociodemographic, clinical, evolutive, physical, psychological and cognitive alterations, dependency degree and quality of life. Main caregivers: mental state and physical overload.
Results64.9% PICS-P, no differences between groups. COVID patients more physical alterations than non-COVID (P = .028). These more functional deterioration (P = .005), poorer quality of life (P = .003), higher nutritional alterations (P = .004) and cognitive deterioration (P < .001). 19.1% PICS-F, more frequent in relatives of non-COVID patients (17.6% vs. 5.5%; P = .013). Independent predictors of PICS-P: first years of the study (OR: 0.484), higher comorbidity (OR: 1.158), delirium (OR: 2.935), several reasons for being included (OR: 3.171) and midazolam (OR: 4.265).
ConclusionsPrevalence PICS-P and PICS-F between both cohorts was similar. Main factors associated with the development of SPCI-P were: higher comorbidity, delirium, midazolan, inclusion for more than one reason and during the first years.
Comparar prevalencia y características del síndrome post-cuidados intensivos paciente (SPCI-P) y familiar/cuidador (SPCI-F) en dos cohortes (COVID y no COVID) y analizar factores riesgo de SPCI-P.
DiseñoProspectivo, observacional cohortes (Marzo 2018–2023), seguimiento a tres meses y año.
ÁmbitoUnidad de Cuidados Intensivos (UCI) polivalente 14 camas, Hospital Nivel II.
Pacientes o participantesPacientes: 265, familiares: 209. Criterios inclusión pacientes: edad > 18 años, ventilación mecánica > 48 horas, estancia UCI > 5 días, delirium, shock séptico, síndrome distrés respiratorio agudo, parada cardiaca. Criterios inclusión familiares: acudir consulta.
IntervencionesSeguimiento 3 meses y año del alta hospitalaria.
Variables de interés principalesPacientes: sociodemográficas, clínicas, evolutivas, alteraciones físicas, psíquicas y cognitivas, dependencia y calidad de vida. Familiares: estado mental y sobrecarga física.
ResultadosSPCI-P 64,9%, sin diferencias entre grupos. Pacientes COVID más alteraciones físicas que los no-COVID (P =,028). Estos últimos más deterioro funcional (P =,005), peor calidad de vida (P =,003), más alteraciones nutricionales (P =,004) y deterioro cognitivo (P <,001). 19,1% SPCI-F, más frecuente en familiares de pacientes no COVID (17,6% vs 5,5%; P =,013). Factores predictivos independientes de SPCI-P: primeros años estudio (OR: 0,484), mayor comorbilidad (OR: 1,158), delirium (OR: 2,935), varios motivos de inclusión consulta (OR: 3,171) y midazolan (OR: 4,265).
ConclusionesPrevalencia de SPCI-P y SPCI-F similar en ambas cohortes. Principales factores asociados a SPCI-P: mayor comorbilidad, delirium, midazolan, haber sido incluido en la consulta por más de un motivo y primeros años del estudio.
Critical illness can alter the life trajectory of patients admitted to the intensive care unit (ICU) and result in a traumatic experience for the family. Therefore, one of the current challenges of intensive care medicine is to promote long-term continuous care beyondthe boundaries of ICU and hospital, through follow-up in post-ICU consultations.1 With adequate prevention, detection, and follow-up, we can minimize the occurrence of symptoms and signs related to the Table 6 (PICS), both in patients (PICS-P) and primary caregivers or family members (PICS-F).2,3
In a systematic review, 60 risk factors were identified for developing PICS-P, approximately half of which were related to the patient and the other half to the ICU.4 Interventions should target modifiable risk factors related to the ICU. The application of the ABCDEF bundle may improve patient-centered care, as well as the experience of patients and their families.5
In COVID-19 patients, multiple risk factors related to PICS6,7 have been identified, in addition to barriers hindering the application of the ABCDEF bundle,8 making this population especially vulnerable to syndrome development. Furthermore, severe acute respiratory illness caused by SARS-CoV-2 infection may cause long-lasting symptoms (“long COVID”), persisting long after hospital discharge and potentially overlapping with PICS, exacerbating its symptoms.9 PICS-F may also have worsened during the pandemic due to distancing from loved ones and difficulties in providing support during bereavement.10 This has led to the recommendation to conduct post-ICU consultations for selected patients, with an initial individualized visit after hospital discharge, to predict, identify, and treat long-term problems related to critical illness.11,12
The main objective of this study is to compare the prevalence and sociodemographic and clinical characteristics of PICS-P and PICS-F in 2 cohorts of patients (COVID vs non-COVID). The secondary objective is to identify risk factors associated with PICS-P.
Patients and methodsStudy designProspective, observational study of 2 cohorts of critical patients (COVID-19 and other diagnoses) and their family members. From March 2018 through March 2023, all patients discharged alive from the ICU, aged 18 years or older, who met at least one of the following criteria were included: invasive and non-invasive mechanical ventilation for >48 h, ICU stay > 5 days, delirium, septic shock, ARDS, and cardiac arrest (CA). Also included in the study were all family members or primary caregivers who attended the consultation. Patients with a past medical history of severe psychiatric conditions, severe cognitive deficits, severe functional dependence, and patients transferred to other centers or from geographical areas without the possibility of attending subsequent evaluations were excluded. All patients were informed about the study inclusion and gave their consent. The study was conducted in accordance with the principles set forth in the Declaration of Helsinki13 and was approved by the Hospital Ethics Committee.
VariablesSociodemographic, clinical, and evolutionary variables related to ICU admission were analyzed. After discharge, variables related to the appearance of physical (musculoskeletal, nutritional, and respiratory), psychological, and cognitive changes, as well as the patient’s degree of dependence and quality of life were evaluated. Variables related to caregiver mental status and physical burden were also analyzed.
Study protocol and follow-up evaluationAn individual face-to-face appointment was scheduled for post-ICU consultation after hospital discharge for patients and primary caregivers, adapted during the pandemic to the epidemiological situation. If the patient had not been discharged during the first appointment, he/she was scheduled for another appointment 1 year after hospital discharge, and depending on the symptoms and test findings, they were referred to other medical specialties. All patients and family members completed a satisfaction survey regarding their ICU stay and the consultation.
All patients underwent medical history taking and a complete physical examination. To assess musculoskeletal changes, muscle strength and atrophy, joint pains and limitations, and paresthesias were evaluated. For respiratory issues, the degree of dyspnea was assessed using the modified Medical Research Council dyspnea scale (mMRC),14 as well as other complications related to orotracheal intubation (granulomas, vocal cord paralysis, etc.). Additionally, patients with dyspnea and/or on mechanical ventilation for >48 h were requested to undergo spirometry. Nutritional status was evaluated using the Malnutrition Universal Screening Tool (MUST).15 Mental status (both of patients and caregivers) was assessed using the Hospital Anxiety and Depression Scale (HADS)16 and the severity scale of post-traumatic stress disorder (PTSD),17 while cognitive function was assessed using the Montreal Cognitive Assessment (MoCA).18 Dependency level was measured using the Barthel Index,19 and quality of life was assessed using the Short Form Health Survey (SF-12) questionnaire.20 Caregiver burden was evaluated using the Zarit Burden Interview21 (Supplementary data. Table S1).
Patients and/or family members met the PICS criteria if they exhibited changes in, at least, 1 of the spheres (physical, psychological, or cognitive).3,12
Statistical analysisQuantitative variables were expressed as mean ± standard deviation or median (interquartile range), and categorical variables as absolute and relative frequencies. Comparison between categorical variables was performed using Pearson's chi-squared test, the linear trend chi-square test, and Fisher's exact test. Comparison between quantitative variables and a dichotomous categorical variable was conducted using the Student's t-test and the Mann-Whitney U test. Multivariate analysis to analyze independent predictive variables for the development of SPCI was performed using logistic regression, employing the stepwise forward method (PIN < 0.10, POUT < 0.05) to correct for collinearity. The variables introduced in the analysis were clinically relevant, as well as those showing a relationship in the univariate analysis with P values < .20. Propensity score matching analysis was conducted using the nearest-neighbor method without replacement on a 1:1 ratio. Each patient from the COVID group was matched with one from the non-COVID group based on the following variables: age, gender, SAPS III, SOFA at admission, months between discharge and consultation, Charlson Index, ARDS, septic shock, delirium, need for mechanical ventilation (MV)/invasive mechanical ventilation (IMV)/non-invasive mechanical ventilation (NIV) > 48 h, deep sedation, and length of ICU stay (days). The effectiveness of matching was determined by calculating the standardized mean difference, where a value < 10% indicates adequate matching. Comparisons of variables in matched groups were performed using McNemar's test and the Wilcoxon signed-rank test. All comparisons were conducted with 2-tailed tests, and P values ≤ .05 were considered statistically significant. Statistical analyses were performed using IBM SPSS version 27® software (IBM™, Armonk, NY) and R version 3.4.0® software (Copyright 2017 The R Foundation for Statistical Computing Platform™).
ResultsA total of 265 patients and 209 family members/caregivers were analyzed. Among them, 104 (39.2%) were admitted for COVID-19 (COVID group) and 161 (60.8%) for other etiologies (non-COVID group).
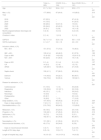
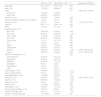
Sociodemographic, clinical, and evolutionary characteristics during the ICU stayThe main characteristics of the patients from each group are shown in Table 1. Patients from the non-COVID group were older (P < .001), had more comorbidities (P < .001), and higher severity measured by SAPS III (P = .006) and SOFA at admission (P < .001). The length of ICU stay (median, 10 vs 7 days; P < .001) and hospital stay (median, 19 vs 14 days; P < .001) was longer in the COVID group.
Sociodemographic, clinical, and evolutionary characteristics at the ICU stay.
| Total (n = 265) | COVID-19 (n = 104) | Non-COVID-19 (n = 161) | P | |
|---|---|---|---|---|
| Age | 61.7 ± 16.2 | 56.4 ± 13.1 | 65.2 ± 17.1 | < .001 |
| Men, n (%) | 177 (66.8) | 67 (64.4) | 110 (68.3) | .510 |
| Year | < .001 | |||
| 2018 | 67 (25.3) | – | 67 (41.6) | |
| 2019 | 41 (15.5) | – | 41 (25.5) | |
| 2020 | 69 (26.0) | 54 (51.9) | 15 (9.3) | |
| 2021 | 65 (24.2) | 45 (43.3) | 19 (11.8) | |
| 2022 | 24 (9.1) | 5 (4.8) | 19 (11.8) | |
| Months elapsed between discharge and consultation | 4 (3−6) | 4 (3−6) | 4 (2−6.5) | .422 |
| Charlson’s index | 2 (1−4) | 1 (0−3) | 3 (1−5) | < .001 |
| SAPS III | 54.7 ± 11.8 | 52.4 ± 8.3 | 56.1 ± 13.5 | .006 |
| SOFA at admission | 4.1 ± 2.7 | 3.2 ± 1.6 | 4.6 ± 3.0 | < .001 |
| Inclusion criteria, n (%) | ||||
| MV > 48 h | 151 (57.0) | 77 (74.0) | 74 (46.0) | < .001 |
| IMV > 48 h | 109 (41.4) | 48 (46.2) | 61 (37.9) | .182 |
| Days on IMV | 15 (6–25) | 14 (6–25) | 15 (8–31.5) | .015 |
| NIV > 48 h | 60 (22.6) | 41 (39.4) | 19 (11.8) | < .001 |
| Days on NIV | 2 (1–4) | 2 (1–4) | 2 (1–3.5) | .137 |
| CA | 14 (5.3) | 2 (1.9) | 12 (7.5) | .049 |
| ARDS | 129 (48.7) | 102 (98.1) | 27 (16.8) | < .001 |
| Septic shock | 109 (41.1) | 27 (26.0) | 82 (50.9) | < .001 |
| Delirium | 114 (43.0) | 34 (32.7) | 80 (49.7) | .006 |
| Various | 194 (73.2) | 94 (90.4) | 100 (62.1) | < .001 |
| Reason for admission, n (%) | < .001 | |||
| Cardiovascular | 41 (15.5) | 1 (1.0) | 40 (24.8) | |
| Respiratory | 133 (50.2) | 101 (97.1) | 32 (19.9) | |
| Infectious | 40 (15.1) | 1 (1.0) | 39 (24.2) | |
| Neurologic | 10 (3.8) | – | 10 (6.2) | |
| Postoperative | 23 (8.7) | – | 23 (14.3) | |
| Other | 18 (6.8) | 1 (1.0) | 17 (10.6) | |
| Deep sedation, n (%) | 107 (40.4) | 46 (44.2) | 61 (37.9) | .304 |
| Days on deep sedation | 7 (4.5–11) | 6 (3–11) | 9 (8–14) | .007 |
| Dexmedetomidine, n (%) | 210 (79.2) | 98 (94.2) | 112 (69.6) | < .001 |
| Midazolan, n (%) | 49 (18.5) | 25 (24.0) | 24 (14.9) | .062 |
| Propofol, n (%) | 130 (49.1) | 47 (45.2) | 83 (51.6) | .312 |
| Isofluorane, n (%) | 19 (7.2) | 14 (13.5) | 5 (3.1) | .001 |
| Opioids, n (%) | 162 (61.1) | 82 (78.8) | 80 (49.7) | < .001 |
| Neuroleptics, n (%) | 101 (38.1) | 41 (39.4) | 60 (37.3) | .724 |
| Neuromuscular blockers, n (%) | 45 (17.0) | 36 (34.6) | 9 (5.6) | < .001 |
| Days on neuromuscular blockers | 4 (3–7) | 5 (3–7) | 2 (2–8.5) | .276 |
| Length of ICU stay, days | 8 (5–14) | 10 (5–17) | 7 (4−11) | < .001 |
| Length of hospital stay, days | 16 (10−27) | 19 (13−31.5) | 14 (8−25) | < .001 |
ARDS, acute respiratory distress syndrome; CA, cardiac arrest; ICU, intensive care unit; IMV, invasive mechanical ventilation; MV, mechanical ventilation; NIV, non-invasive mechanical ventilation; SAPS, Simplified Acute Physiology Score; SOFA, Sequential Organ Failure Assessment.
The main drugs used for analgesia and sedation are shown in Table 1. Although there were no differences in the percentage of patients with deep sedation, the duration of deep sedation was longer in the non-COVID group (median of 8 days) bs the COVID (median of 6 days) [P = .007].
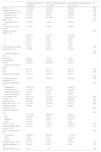
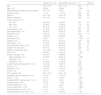
Presence of PICS in the first consultationThe relationship between patient groups analyzed, the development of PICS, and the presence of physical, psychological, and cognitive complications at the first consultation are shown in Table 2. A total of 172 (64.9%) patients presented with PICS, with no significant differences between the groups. Patients from the COVID group showed more physical changes vs non-COVID patients (P = .028). Functional physical deterioration (P = .005), poorer quality of life scores (P = .003), nutritional alterations (P = .004), and cognitive impairment (P < .001) were more frequent in the non-COVID group.
Physical, cognitive, and mental changes at the first post-ICU consultation.
| Total patients/families (n = 265/209) | COVID-19 patients/families (n = 104/73) | Non-COVID-19 patients/families (n = 161/136) | P | |
|---|---|---|---|---|
| PICS- P, n (%) | 172 (64.9) | 63 (60.6) | 109 (67.7) | .235 |
| Physical changes, n (%) | 91 (34.3) | 44 (42.3) | 47 (29.2) | .028 |
| Musculoskeletal, n (%) | 75 (28.3) | 35 (33.7) | 40(24.8) | .120 |
| Nutritional, n (%) | 32 (12.1) | 5 (4.8) | 27(16.8) | .004 |
| Respiratory, n (%) | 60 (22.6) | 28 (26.9) | 32(19.9) | .181 |
| MUST, n (%) | .310 | |||
| Intermediate risk (1 point) | 21 (67.7) | 2 (40.0) | 19 (70.4) | |
| High risk (2 or more points) | 11 (32.3) | 3 (60.0) | 8 (29.6) | |
| Degree of dyspnea, mMRC, n (%) | .037 | |||
| 0 | 215 (81.1) | 79 (76.0) | 136 (84.5) | |
| 1 | 24 (9.1) | 9 (8.7) | 15 (9.3) | |
| 2 | 15 (5.7) | 9 (8.7) | 6 (3.7) | |
| 3 | 6 (2.3) | 5 (4.8) | 1 (0.6) | |
| 4 | 5 (1.9) | 2 (1.9) | 3 (1.9) | |
| Other respiratory changes | 14 (5.3) | 6 (5.8) | 8 (5.0) | .776 |
| Spirometry*, n (%) | 77 (47.8) | 55 (67.1) | 22 (27.8) | < .001 |
| Spirometric pattern*, n (%) | .440 | |||
| Obstructive | 2 (2.6) | 1 (1.8) | 1 (4.5) | |
| Non-obstructive | 50 (64.9) | 34 (61.8) | 16 (72.7) | |
| Normal | 25 (32.5) | 20 (36.4) | 5 (22.7) | |
| Values* (% theoretical value) | ||||
| FVC | 75 ± 16 | 79 ± 13 | 65 ± 13 | .002 |
| FEV1 | 81 ± 21 | 87 ± 17 | 65 ± 22 | .005 |
| Tiffeneau-Pinelloi index | 105 ± 14 | 108 ± 13 | 99 ± 13 | < .001 |
| Simplified functional impairment, n (%) | 72 (27.2) | 19 (18.3) | 53 (32.9) | .009 |
| Functional impairment, n (%) | .005 | |||
| Independient | 193 (72.8) | 85 (81.7) | 108 (67.1) | |
| Mild dependence | 42 (15.6) | 13 (12.5) | 29 (18.0) | |
| Moderat dependence | 21 (7.8) | 5 (4.8) | 16 (9.9) | |
| Severe dependence | 9 (3.3) | 1 (1.0) | 8 (5.0) | |
| SF-12 quality of life | 48.9 ± 11.8 | 51.3 ± 9.4 | 47.2 ± 12.9 | .003 |
| Anxiety, n (%) | 59 (22.3) | 21 (20.2) | 38 (23.6) | .515 |
| Depression, n (%) | 43 (16.2) | 18 (17.3) | 25 (15.5) | .701 |
| Patient with PTSD, n (%) | 37 (14.0) | 15 (14.4) | 22 (13.7) | .862 |
| Simplified cognitive impairment, n (%) | 78 (29.4) | 16 (15.4) | 62 (38.5) | < .001 |
| Cognitive impairment, n (%) | < .001 | |||
| No | 187 (70.6) | 88 (84.6) | 99 (61.5) | |
| Mild | 49 (18.5) | 9 (8.7) | 40 (24.8) | |
| Moderate | 19 (7.2) | 6 (5.8) | 13 (8.1) | |
| Sever | 10 (3.8) | 1 (1.0) | 9 (5.6) | |
| PICS-F **, n (%) | 40 (19.1) | 11 (15.1) | 29 (21.3) | .273 |
| Simplified ZARIT familiar burden**, n (%) | 28 (13.4) | 4 (5.5) | 24 (17.6) | .014 |
| ZARIT familiar burden **, n (%) | .076 | |||
| No overload | 180 (86.1) | 69 (94.5) | 111 (81.6) | |
| Mild | 19 (9) | 2 (2.7) | 17 (12.5) | |
| Intense | 10 (4.8) | 2 (2.8) | 8 (5.8) | |
| Familial anxiety**, n (%) | 24 (11.5) | 9 (12.3) | 15 (11.0) | .779 |
| Familial depression**, n (%) | 10 (4.8) | 4 (5.4) | 6 (4.4) | .747 |
| Familial PTSD**, n (%) | 1 (0.1) | 1 (1.4) | – | .349 |
FEV1, forced expiratory volume in 1 s; FVC, forced vital capacity; mMRC, modified Medical Research Council dyspnea scale; PICS, post-intensive care syndrome; PTSD, post-traumatic stress disorder.
PICS was present in 40 (19.1%) family members and/or primary caregivers. Only family ZARIT differed between the groups, showing higher burden in non-COVID patient's family members (17.6% vs 5.5% in the COVID group; P = .013).
Referral to different medical specialists (77.4% of the patients) is shown in Supplementary Table S2. Only the referral to Pulmonology was more frequent in the COVID group (20 cases, 19.2%) vs non-COVID-19 group (9 cases, 5.6%) [P < .001].
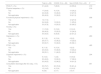
Evolution at the second consultationAfter the first consultation, 184 (69.4%) patients were discharged, and 81 (30.6%) were scheduled for a second consultation (Table 3).
Physical and neuropsychological sequelae in second post-ICU consultation.
| Total (n = 69) | COVID-19 (n = 26) | Non-COVID-19 (n = 43) | P | |
|---|---|---|---|---|
| PICS-P, n (%) | 31 (44,9) | 7 (26,9) | 24 (55,8) | .019 |
| Physical sequelae, n (%) | .218 | |||
| Yes | 17 (24,6) | 4 (15,4) | 13 (30,2) | |
| No | 24 (34,8) | 12 (46,2) | 12 (27,9) | |
| Not applicable | 28 (40,6) | 10 (38,5) | 18 (41,9) | |
| Functional physical impairment, n (%) | .006 | |||
| Yes | 12 (17,4) | – | 12 (27,9) | |
| No | 24 (34,8) | 13 (50,0) | 11 (25,6) | |
| Not applicable | 33 (47,8) | 13 (50,0) | 20 (46,5) | |
| Anxiety, n (%) | .253 | |||
| Yes | 11 (15,9) | 5 (19,2) | 6 (14,0) | |
| No | 28 (40,6) | 13 (50,0) | 15 (34,9) | |
| Not applicable | 30 (43,5) | 8 (30,8) | 22 (51,2) | |
| Depression, n (%) | .280 | |||
| Yes | 8 (11,6) | 4 (15,4) | 4 (9,3) | |
| No | 26 (37,7) | 12 (46,2) | 14 (32,6) | |
| Not applicable | 35 (50,7) | 10 (38,5) | 25 (58,1) | |
| PTSD, n (%) | .485 | |||
| Yes | 8 (11,6) | 4 (15,4) | 4 (9,3) | |
| No | 23 (33,3) | 10 (38,5) | 13 (30,2) | |
| Not applicable | 38 (55,1) | 11 (46,2) | 26 (60,5) | |
| Cognitive impairment, n (%) | .204 | |||
| Yes | 9 (13,0) | 1 (3,8) | 8 (18,6) | |
| No | 30 (43,5) | 13 (50,0) | 17 (39,5) | |
| Not applicable | 30 (43,5) | 12 (46,2) | 18 (41,9) | |
| Consultation discharge after ICU stay, n (%) | .851 | |||
| Yes | 55 (79,7) | 20 (76,9) | 35 (81,4) | |
| No | 10 (14,5) | 4 (15,4) | 6 (14,0) | |
| Not applicable | 4 (5,8) | 2 (7,7) | 2 (4,7) |
PICS, post-intensive care syndrome; PTSD, post-traumatic stress disorder.
Mortality could not be determined in 18 of the 265 analyzed patients at 1 year as this time had not yet elapsed since hospital discharge. In the remaining 247 patients, mortality did not differ between the COVID (1 case, 1%) and the non-COVID groups (6 cases, 4.2%) [Table 4]. Both ICU and hospital readmission were more frequent in the non-COVID group (Table 4).
Yearly evolution.
| Total (n = 247) | COVID-19 (n = 104) | Non-COVID-19 (n = 143) | P | |
|---|---|---|---|---|
| 1-year mortality*, n (%) | 7 (2.8) | 1 (1.0) | 6 (4.2) | .244 |
| ICU readmission at 1 year, n (%) | 16 (6.0) | 1 (1.0) | 15 (9.3) | .005 |
| Hospital readmission at 1 year, n (%) | 61 (23.0) | 3 (2.9) | 58 (36.0) | < .001 |
| Time elapsed since discharge until readmission**, n (%) | .518 | |||
| <1 month | 15 (24.6) | 1 (33.3) | 14 (24.1) | |
| 1−3 months | 18 (29.5) | 1 (33.3) | 17 (29.3) | |
| 3−6 months | 18 (29.5) | 1 (33.3) | 17 (29.3) | |
| >6 months | 10 (16.4) | – | 10 (17.2) |
The risk factors for developing PICS in analyzed patients are shown in Table 5. On multivariate analysis, independent predictive factors were identified such as early admission to the study (OR = 0.484; 95%CI, 0.251−0.933), higher Charlson comorbidity index (OR = 1.158; 95%CI, 1.009−1.329), delirium (OR = 2.935; 95%CI, 1.530−5.630), various reasons for inclusion in post-ICU consultation (OR = 3.171; 95%CI, 1.592−6.315), and treatment with midazolam (OR = 4.265; 95%CI, 1.608−11.310).
Predictive factors of PICS-P.
| PICS (n = 172) | Non-PICS (n = 93) | P | Adjusted OR (95%CI) | |
|---|---|---|---|---|
| Age, years | 63.5 ± 16.2 | 58.5 ± 15.9 | .015 | |
| Men, n (%) | 113 (65.7) | 64 (68.8) | .607 | |
| Years | .071 | 0.484 (0.251−0.933) | ||
| 2018−2019 | 77 (44.8) | 31 (33.3) | ||
| 2020−2022 | 95 (55.2) | 62 (66.7) | ||
| COVID-19, n (%) | 63 (36.6) | 41 (44.1) | .235 | |
| Months between discharge and consultation | 4 (3−6) | 4 (3−7) | .044 | |
| Charlson’s index | 3 (1−5) | 1 (0−4) | .005 | 1.158 (1.009−1.329) |
| SAPS III | 55.7 ± 11.1 | 52.8 ± 13.0 | .053 | |
| SOFA | 4.3 ± 2.6 | 3.7 ± 2.6 | .106 | |
| Inclusion criteria, n (%) | ||||
| MV > 48 h | 109 (63.4) | 42 (45.2) | .004 | |
| IMV > 48 h | 85 (49.4) | 24 (25.8) | < .001 | |
| Days on IMV | 15 (6−25) | 13 (8−30) | .020 | |
| NIV > 48 h | 39 (22.7) | 21 (22.6) | .986 | |
| Days on NIV | 2 (1−4) | 2 (1−4.5) | .201 | |
| CA | 10 (5.8) | 4 (4.3) | .599 | |
| ARDS | 82 (47.7) | 47 (50.5) | .656 | |
| Septic shock | 80 (46.5) | 29 (31.2) | .016 | |
| Delirium | 94 (54.7) | 20 (21.5) | < .001 | 2.935 (1.530−5.630) |
| Various | 136 (79.1) | 58 (62.4) | .003 | 3.171 (1.592−6.315) |
| Reason for admission, n (%) | .843 | |||
| Cardiovascular | 25 (14.5) | 16 (17.2) | ||
| Respiratory | 85 (49.4) | 48 (51.6) | ||
| Infectious | 29 (16.9) | 11 (11.8) | ||
| Neurologic | 6 (3.5) | 4 (4.3) | ||
| Postoperative | 14 (8.1) | 9 (9.7) | ||
| Other | 13 (7.6) | 5 (5.4) | ||
| Deep sedation, n (%) | 84 (48.8) | 23 (24.7) | < .001 | |
| Days on deep sedation | 5 (3−9) | 3 (2−6) | < .071 | |
| Dexmedetomidine, n (%) | 145 (84.3) | 65 (69.9) | .005 | |
| Midazolan, n (%) | 43 (25.0) | 6 (6.5) | < .001 | 4.265 (1.608−11.310) |
| Propofol, n (%) | 99 (57.6) | 31 (33.3) | < .001 | |
| Isofluorane, n (%) | 15 (8.7) | 4 (4.3) | .183 | |
| Opioids, n (%) | 107 (62.2) | 55 (59.1) | .625 | |
| Neuroleptics, n (%) | 85 (49.4) | 16 (17.2) | < .001 | |
| Neuromuscular blockers, n (%) | 37 (21.5) | 8 (8.6) | .008 | |
| Length of ICU stay, days | 8 (5−18) | 7 (4−10) | < .001 | |
| Length of hospital stay, days | 18 (10−35) | 13 (9−21) | .001 |
After adjusting for multiple confounding variables through matched propensity score analysis, the development of PICS did not differ between the COVID and non-COVID groups (Table 6). Only nutritional changes (P = .021), hospital readmission (P < .001), and worse quality of life at the follow-up (SF-12 46.3 ± 12.5 vs 50.3 ± 10.4; P = .037) were more frequent in the non-COVID group.
Sociodemographic, clinical, and evolutionary characteristics. Propensity Score Matching Analysis.
| COVID-19 (n = 70) | Non-COVID-19 (n = 70) | P | SMD (%) | |
|---|---|---|---|---|
| Age | 59.2 ± 16.7 | 59.5 ± 13.8 | .868 | 2 |
| Men, n (%) | 42 (60) | 40 (60) | > .999 | – |
| Months between discharge and consultation | 4 (3−5.2) | 4 (3.6) | .737 | 5.8 |
| Charlson’s index | 1 (1−3) | 1 (1−2.5) | .682 | 3.2 |
| SAPS III | 54.7 ± 9.9 | 54.2 ± 9.4 | .708 | 4.5 |
| SOFA at admission | 3.4 ± 1.8 | 3.5 ± 2.0 | .889 | 1.7 |
| Inclusion criteria, n (%) | ||||
| MV > 48 h | 44 (62.9) | 42 (60.0) | .860 | 4.2 |
| IMV > 48 h | 32 (45.7) | 34 (48.6) | .774 | 3.8 |
| NIV > 48 h | 22 (31.4) | 18 (25.7) | .875 | 6.9 |
| Deep sedation, n (%) | 31 (44.3) | 29 (41.4) | .871 | 3.9 |
| Dexmedetomidine, n (%) | 66 (94.3) | 64 (91.4) | .687 | 9.7 |
| Midazolan, n (%) | 16 (22.9) | 13 (18.6) | .664 | 7.8 |
| Propofol, n (%) | 42 (60.0) | 40 (60.0) | > .999 | – |
| Isofluorane, n (%) | 6 (8.6) | 5 (7.1) | > .999 | 5.3 |
| Opioids, n (%) | 54 (77.1) | 52 (74.3) | .839 | 4.9 |
| Neuroleptics, n (%) | 31 (44.3) | 28 (40.0) | .664 | 7.8 |
| Neuromuscular blockers, n (%) | 21 (30.0) | 23 (32.9) | .687 | 9.7 |
| Length of ICU stay. days | 9 (5–19) | 8 (5–15) | .220 | 3.1 |
| Length of hospital stay. days | 20 (15–35) | 16 (9−34) | .212 | 0.6 |
| PICS, n (%) | 42 (60.0) | 43 (61.4) | > .999 | |
| Physical changes, n (%) | 32 (45.7) | 20 (28.6) | .081 | |
| Musculoskeletal, n (%) | 21 (30.0) | 22 (31.4) | > .999 | |
| Nutritional, n (%) | 5 (7.1) | 13 (18.6) | .021 | |
| Respiratory, n (%) | 20 (28.6) | 13 (18.6) | .189 | |
| Simplified functional impairment, n (%) | 13 (18.6) | 18 (25.7) | .359 | |
| Anxiety, n (%) | 16 (22.9) | 19 (27.1) | .629 | |
| Depression, n (%) | 14 (20.0) | 13 (18.6) | > .999 | |
| PTSD, n (%) | 9 (17.1) | 9 (12.9) | .648 | |
| SF-12 quality of life | 50.3 ± 10.4 | 46.3 ± 12.5 | .037 | |
| Simplified cognitive impairment, n (%) | 9 (12.9) | 17 (24.3) | .115 | |
| PICS-F *, n (%) | 5 (11.6) | 8 (12.5) | > .999 | |
| Simplified ZARIT familiar burden**, n (%) | 2 (4.7) | 6 (9.4) | .500 | |
| Familiar anxiety*, n (%) | 5 (11.6) | 7 (10.9) | > .999 | |
| Familiar depression*, n (%) | 1 (1.4) | 2 (2.9) | > .999 | |
| 1-year mortality rate**, n (%) | 2 (2.9) | 2 (3.1) | > .999 | |
| ICU readmission at 1 year, n (%) | 1 (1.4) | 7 (10.0) | .070 | |
| Hospital readmission at 1 year, n (%) | 1 (1.4) | 23 (32.9) | < .001 |
PICS, post-ICU syndrome; PTSD, post-traumatic stress disorder; SMD, standardized mean difference; ICU, intensive care unit.
The most important finding of this study is that the prevalence of PICS-P and PICS-F was similar in both cohorts (COVID and non-COVID) at the first follow-up consultation, with rates of 65.2% and 19.1% in both patients and family members, respectively. However, at the 1-year follow-up, a higher percentage of non-COVID patients still exhibited signs or symptoms of PICS-P. Additionally, there were differences in the type of changes exhibited by both cohorts of patients and family members. In patients, the most frequent were physical, especially in the COVID group (42.3% vs 29.2%, P = .028), at the expense of a higher, albeit not significant, number of musculoskeletal and respiratory changes, which, however, were more frequent in non-COVID patients at the 1-year follow-up. Regarding the degree of functional dependence and quality of life, these were worse in the non-COVID patient group.
There is significant variability in the prevalence of PICS-P and PICS-F2 across different studies, and the most common changes depend on the characteristics of the patienets and the evaluation methods used. In COVID-19 patients, this variability is equal to or even greater. Various studies conducted in France,22 the United States,6 and the Netherlands,23 involving COVID-19 patients on mechanical ventilation, have shown very significantly different results. In Spain, a study conducted on ventilated COVID-19 patients found that approximately 3 out of every 4 patients met PICS criteria at the 3-months follow-up.24 One of the main limitations of these studies is the lack of comparison with a non-COVID-19 patient cohort, and the fact that most follow-ups (except the Spanish study) were not conducted in person.
Several authors have reported that the physical, psychological, and cognitive deficits observed in ICU survivors after COVID-19 are comparable to those observed in patients with other diseases.25,26 Additionally, it has been demonstrated that ARDS survivors have persistent functional limitations 1 year after ICU discharge due to muscle atrophy and weakness,27 and that the inability to exercise even at the 5-year follow-up is mainly due to extrapulmonary causes.28–30 Similarly, prolonged mechanical ventilation (MV) is a risk factor for long-term physical changes.24 This would explain the higher percentage of functional changes reported in COVID patients who were primarily included due to MV > 48 h and ARDS.
However, age,31 pre-existing comorbidities,1 nutritional changes, and disease severity4 have been identified as determinants of poor prognosis related to increased functional dependency and worse long-term quality of life, all of which are present in our non-COVID patients. Furthermore, the severity of illness upon ICU admission has also been associated with a higher rate of ICU and hospital readmission, both significantly higher in our non-COVID patient group.
Cognitive impairment was also more common in non-COVID patients, due to the older age of these patients, but also to the longer duration of deep sedation and higher incidence of delirium, both factors clearly associated with long-term cognitive impairments.32,33 Deep sedation contributes to increased mortality and worsens clinical outcomes, both in the short- and long-term (delirium and cognitive impairment).34,35
Therefore, although physical changes (primarily musculoskeletal and respiratory) were more frequent in the COVID group, as a consequence of their respiratory disease (more patients with ARDS and mechanical ventilation > 48 h), the greater presence of other predictive factors of poor prognosis in the non-COVID patient group, such as older age, comorbidities, worse nutritional status, and disease severity, influenced and significantly impacted the quality of life and degree of dependency within the first few months of follow-up, as well as the persistence of PICS-P 1 year after hospital discharge. These factors also had an impact on the hospital and ICU readmission rates at 1 year.1 In addition to these non-modifiable factors, other factors external to the patient and preventable in the ICU, such as deep sedation and delirium, contributed to a greater long-term cognitive decline in COVID patients.
PICS-F was present in 19.1% of family members and/or caregivers. The most frequent change was family burden (P = .014), which was significantly higher in non-COVID patients' families (17.6% vs 5.5%; P = .013), followed by anxiety. There is great variability in the prevalence of PICS-F in different studies,36,37 with mental and physical changes being described in up to 60% and 40%, respectively, depending on the variables analyzed and methods used. Similarly, multiple risk factors for PICS-F38 have been identified such as disease severity, communication, female sex, etc. In our series, the incidence was lower, and caregivers who experienced greater burden were those of patients with more dependency and worse quality of life.
The risk factors identified in our patients for developing PICS-P were greater comorbidity, delirium, several reasons for post-ICU follow-up consultation, treatment with midazolam, and being admitted within the early years of the study. The association of pre-existing comorbidity, delirium, and other factors such as age with PICS has been previously discussed. Additionally, the use of midazolam has also been identified as an important factor associated with this syndrome.39 Regarding being admitted in the early years of the study, this relationship could be due to the greater implementation of the ABCDEF bundle throughout the study period, which has been shown to improve the patients' long-term prognosis.1,40 In our ICU, we gradually implemented a program to prevent PICS (optimization and monitoring of analgosedation and delirium, flexible visiting hours, improvement of communication and entertainment through clocks, TVs, augmentative communicators, etc.), culminating in 2020 (during the pandemic) with the addition of a physical therapist and a psychologist into our unit. This may have influenced the admission in the early years of the study as a risk factor for developing PICS and COVID patients presenting with less physical, functional, and cognitive deterioration than non-COVID patients (most of whom were admitted before the pandemic).
This work has strengths and weaknesses. It is a study with face-to-face follow-up, including a relevant number of patients and family members, and compares 2 different cohorts: COVID and non-COVID, which is a strength of the study. Regarding weaknesses, firstly, due to its single-center design, the generalization of results may be compromised to some extent. Secondly, due to follow-up, some of the evolving variables have not yet been measured at the time of this work. Finally, although the inclusion of analyzed variables was certainly comprehensive, we may have overlooked some important variables. Nevertheless, we believe that the study's conclusions remain valid. We propose future research based on a national registry of PICS.
ConclusionsThere were no differences in the incidence of PICS in patients and family members of both cohorts (COVID vs non-COVID) at the first follow-up consultation, although it was more frequent in non-COVID patients at 1 year. The main factors associated with developing PICS-P were greater comorbidity, presence of delirium, sedation with midazolam at the ICU stay, as well as being included in the consultation for more than 1 reason and during the early years of the study, when the implementation of the ABCDEF bundle was lower.
FundingNo total or partial funding was received to conduct study, nor any type of grant or financial support.
Conflicts of interestNone declared.
Authors’ contributionsCarola Giménez-Esparza Vich: Data mining. Elaboration and drafting of the article.
Beatriz Hurtado Oliver: Data mining. Drafting.
Maria Angeles Relucio Martinez: Data mining. Drafting.
Salomé Sanchez Pino: Data mining.
Cristina Portillo Requena: Data mining.
José David Simón Simón: Data mining.
Isabel María Pérez Gómez: Data mining.
Fernando Mario Andrade Rodado: Data mining.
Fadoua Laghzaoui Harbouli: Data mining.
Fernando Javier Sotos Solano: Data mining.
Carlos Augusto Montenegro Moure: Data mining.
Andrés Carrillo Alcaraz: Statistical analysis and Drafting.
We wish to thank Dr. José Manuel Añón Elizalde and Dr. José Abelardo García de Lorenzo for providing us with all the necessary assistance and documentation to initiate post-ICU consultations.
The following is Supplementary data to this article:


