
Describe and compare the Quality of Life (QoL) and disability of critical care survivors with COVID-19 and NON-COVID-19 critical illness, admitted during and after the pandemic period. We hypothesize that both COVID-19 disease and the pandemic context have a significant impact on long-term outcomes of Intensive Care Unit (ICU) survivors.
DesignPost-hoc analysis of prospectively collected data.
SettingIntensive Care Department of Unidade Local de Saúde São João between 1st October 2020 and 31st December 2021.
ParticipantsThree groups of adult critical care survivors; Group 1: critical COVID-19 patients; Group 2: critical patients with other diagnosis, admitted in the pandemic period; Group 3: critical patients admitted in the post-pandemic period due to non-COVID-19 causes.
InterventionTelephone consultation 16 months after discharge home, assessing QoL and disability.
Main variables of interestQoL five dimensions, EuroQol Visual Analog Scale (EQ-VAS) and Health and disability 6 domains.
ResultsOf the 185 survivors, Group 1 reported less problems in“Self-care” (OR = 0.15, 95%CI: 0.04−0.55), “Usual activities” (OR = 0.20, 95%CI: 0.08−0.0.52), and “Anxiety/Depression” (OR = 0.36, 95%CI: 0.14−0.97) dimensions. Health and disability domains assessment showed Group 1 had less difficulties in “Cognition” (OR = 0.37, 95%CI: 0.15−0.91), “Mobility” (OR = 0.25, 95%CI: 0.09−0.68), “Self-care” (OR = 0.15, 95%CI: 0.05−0.40) and “Life activities” (OR = 0.32, 95%CI: 0.13−0.76).
ConclusionsSixteen months after discharge home, survivors of non-COVID-19 admitted during the pandemic period present worse QoL and functional status than COVID-19 survivors admitted during the same period and greater post-hospital discharge healthcare needs.
Describir y comparar la Calidad de Vida (CdV) y la discapacidad de los supervivientes de enfermedades críticas COVID-19 y no-COVID-19 ingresados en periodo de pandemia y en periodo post pandemia. Nuestra hipótesis es que tanto la COVID-19 como el contexto pandémico tienen un impacto significativo en los resultados a largo plazo de los sobrevivientes de la Unidad de Cuidados Intensivos (UCI).
DiseñoAnálisis post-hoc de datos recogidos prospectivamente.
ÁmbitoServicio de Medicina Intensiva de la ULSSJ entre el 1 de octubre de 2020 y el 31 de diciembre de 2021.
ParticipantesTres grupos de adultos supervivientes de UCI: Grupo 1 - pacientes críticos COVID-19; Grupo 2 - pacientes críticos no-COVID-19, ingresados en periodo de pandemia; Grupo 3 - pacientes críticos no-COVID-19 ingresados en periodo post pandemia.
IntervenciónConsulta telefónica 16 meses después del alta a casa, evaluando CdV y discapacidad.
Variables de interés principalesDimensiones de la CdV; EuroQol escala analógica visual (EQ-VAS) y los dominios de la discapacidad.
ResultadosDe los 185 supervivientes, Grupo 1 presenta menores problemas en la CdV: “Cuidados Personales” (OR = 0.15, 95%CI: 0.04−0.55), “Actividades habituales” (OR = 0.20, 95%CI: 0.08−0.0.52) y “Ansiedad/Depresión” (OR = 0.36, 95%CI: 0.14−0.97). La evaluación de la discapacidad mostró que Grupo 1 muestra menos dificultad em la “Cognición” (OR = 0.37, 95%CI: 0.15−0.91), “Movilidad” (OR = 0.25, 95%CI: 0.09−0.68), “Cuidados personales” (OR = 0.15, 95%CI: 0.05−0.40) y “Actividades de la vida” (OR = 0.32, 95%CI: 0.13−0.76.
ConclusionesDieciséis meses después del alta a casa, los supervivientes no-COVID-19 ingresados durante el periodo pandémico presentan peor CdV, estado funcional y mayores necesidades de atención sanitaria.
Recent decades have brought the concern about persistent sequelae in survivors of critical illness and their families, prompting the Society of Critical Care Medicine (SCCM) to carve the concept of Post Intensive Care Syndrome (PICS) defined as “new or worsened impairments in physical, cognitive, and mental health”, after Intensive Care Unit (ICU) admission.1,2
Survivors of Acute Respiratory Distress Syndrome (ARDS) frequently experience long-lasting physical, cognitive and mental health impairments, with decreased quality of life3,4 and higher disability. A recent multicenter study describes considerable long-term impairments in critically ill Coronavirus Disease 2019 (COVID-19) survivors,5 often after prolonged Intensive Care Unit (ICU) length of stays (LoS).6 Long-term outcomes of survivors of critical illness due to COVID-19 compared with non-COVID-19 are yet to be fully established due to COVID-19 ARDS physiopathology.7,8 Some studies revealed considerable overlap in both pathophysiological mechanics9 which could lead us to assume that the long-term results would be similar.10
COVID-19 outbreak added difficulties to prevent and mitigate PICS due to physical isolation, deep sedation, delayed mobilization and restriction of visits. Healthcare workers were overwhelmed with Intensive Care Medicine Department (ICMD) increased workload and experienced higher stress levels.11
During the pandemic period, our follow-up clinic was centered in critical COVID-19 survivors’ short-term outcomes,12,13 but it is crucial to understand their long-term sequelae, compared to other critically ill patients cared for during or after the pandemics.
Our hypothesis is that differences in long-term Health Related Quality of Life (HRQoL) and disability among ICU survivors are attributable both to the nature of critical care illness, as to the timing of admission, reflecting the combined effect of disease-specific and system-level factors.
The aims of this study are, on one hand to describe and compare COVID-19 and non-COVID-19 critical care survivor’s HRQoL and disability, comparing Group 1 (COVID-19 critical patients admitted along pandemic period) and Group 2 (non-COVID-19 patients admitted along pandemic period) and, on the other hand, to understand the role of the pandemic context in the same survivor’s outcomes, comparing Group 2 (non-COVID-19 patients admitted along pandemic period) and Group 3 (non-COVID-19 patients admitted after pandemic period). Including a post-pandemic non-COVID-19 cohort enables us to distinguish the effects of the pandemic healthcare environment itself from those of the underlying critical illness. During the pandemic, resource allocation, clinical workflows, and patient support systems were significantly disrupted; in the post-pandemic period, the gradually returned to standard practices. This comparison thus provides insight into whether observed long-term outcomes are attributable to the disease, to pandemic-related system changes, or to both.
Patients and methodsParticipantsThis post-hoc analysis of prospectively collected data study included all consecutive adult patients (≥18 years old), admitted to the ICMD of Unidade Local de Saúde São João (ULSSJ) between 1st October 2020 and 31st December 2021.
Group 1 included critical COVID-19 patients (with a diagnosis of critical illness defined by World Health Organization criteria for COVID - i.e., respiratory failure, septic shock, or multi-organ disfunction) and Group 2 critically ill patients admitted with other diagnosis, both groups admitted to our ICMD between 1st October 2020 to 30th April 2021 (pandemic period).
Group 3 included critically ill patients admitted to our ICMD from 1st June 2021 to 31st December 2021 (post-pandemic period) due to non-COVID-19 causes and not infected with SARS-COV-2.
We excluded patients: (a) admitted with ICMD LoS ≤ 4 days; (b) with another admission in ICMD for more than 4 days within one year (before or after the admission in study), as distinguishing which was the admission determining the sequelae would be impossible; (c) with neurologic or psychiatric diagnoses; (d) patients with non-COVID-19 critical illness despite a positive SARS-COV-2 test (that is, patients who were positive to SARS-COV-2 whose critical illness is not related to this infection); (e) who died in ICMD, hospital or during the follow-up period (18 months), (f) with terminal disease or comorbidity, which leads to progressive worsening of the general condition and may mislead the assessment of ICU admission sequelae; (g) institutionalized or admitted to other hospital at the moment of data collection, as HRQoL and disability assessment instruments assume that the survivor is at home; (h) that were outside the time window for assessment at the time of data collection (discharged home more than 18 months before assessment); (i) with hearing or communication difficulties or (j) that refused or were unavailable to our telephone contacts.
A formal sample size calculation was not performed due to the post-hoc design.
This study had as ethics approval, consent process, and compliance with the Declaration of Helsinki: The protocol was approved by the Ethics Committee (authorization number 218/2020). Verbal informed consent was obtained from all the participants. Data collection complied with data protection regulations.
Data collectionAn intensive care-trained nurse performed a telephone consultation to all survivors discharged to home, on average 16 months after hospital discharge (P25-P75: 15−17), to assess HRQoL and health and disability status. All consultations were performed by the same nurse, who has extensive experience in intensive care follow-up, using the same instruments and following the instructions of the validated Portuguese versions. Telephone consultations were performed in business days, from 9am to 4pm, in ICMD between 10th February 2022 and 30th April 2023. All survivors were contacted to all the available phone numbers recorded in their clinical process, for a maximum of two times in three different days, at different hours. After these attempts, if it was not possible to reach the patient or family, they were excluded from the assessment and the study. The conversation was performed directly with the patient (77.8%) or, if this was impossible, with the next of kin serving as an intermediary of the patient’s responses.
To assess quality of life, EuroQol Five-Dimensional Five-Level questionnaire (EQ-5D-5 L) was applied, including HRQoL five dimensions “Mobility”, Self-care”, “Usual activities”, “Pain/Discomfort”, “Anxiety/Depression”. In each of the dimensions, responses were grouped into “No problems” and “Some problems” (“Slight problems”, “Moderate problems”, “Severe problems” and “Unable/Extreme problems”), with the five levels responses described in Appendices A.1. This instrument comprises the EuroQol Visual Analog Scale (EQ-VAS), questioned as follow:” We would like to know how good or bad your health is today in a scale numbered from 0 to 100, where 100 means the best health, you can imagine and 0 means the worst health you can imagine”.14 Regarding health and disability status, 12 - Items World Health Organization Disability Assessment Schedule 2.0 (WHODAS 2.0 – 12 Items)15,16 was used, grouped in 6 domains: “Cognition” (understanding and communicating), “Mobility” (moving and getting around), “Self-care” (attending to one’s hygiene, dressing, eating and staying alone), “Getting along” (interacting with other people), “Life activities” (domestic responsibilities, leisure, work and school) and “Participation” (joining in community activities, participating in society).17 Also, in health and disability, the responses to each domain were grouped in “No difficulty” and “Some difficulty” (“Mild”, “Moderate”, “Severe” and “Extreme/cannot do”), with all the responses described in Appendices A.2 and A.3.
Patient demographic and clinical data, including comorbidities, were obtained from clinical records and medical discharge summaries.
Deep sedation was defined as continuous infusion of propofol, or midazolam and delirium was considered if noted in daily clinical records.
Statistical analysisAll analyses were performed in Stata® IC 15.1 (Stata Corp, College Station, Texas, USA). Categorical variables were described as counts and proportions, and continuous variables as medians. The Chi-square test was used for comparison of proportions, while Kruskal-Wallis test was used for comparison of medians. All hypothesis tests were two-sided and a p-value<0.05 was considered statistically significant. Univariate and multivariate analyses were performed using multinomial logistic regression to compute the odds ratio (OR) and corresponding 95% confidence intervals (95%CI) for the association with HRQoL and Disability in groups 1 and 3 compared to group 2. Variables with statistically significant results in univariate analyses were evaluated taking into account their clinical relevance for the outcomes being measured. Those representing the clinical condition of the patient before the evaluation and influencing their physical status at evaluation were used as covariates in adjusted models. Previous history of oncologic disease, destination after hospital discharge (home vs other), APACHE II and hospital LoS were used as covariates in adjusted models.
Primary outcomes were QoL (EQ-5D-5L) and disability (WHODAS 2.0 - Items) domains scores. Co-variates included APACHE II score, comorbidities, ICMD LoS, invasive mechanical ventilation, and destination after hospital discharge.
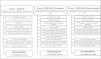
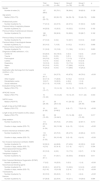
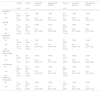
ResultsA total of 1865 patients were enrolled and grouped into the three cohorts according to the inclusion/exclusion criteria (Fig. 1). The baseline characteristics of the three cohorts are described in Table 1, highlighting Group 2 (Non-COVID-19 pandemic) with a higher prevalence of previous oncologic disease (14 patients – 23.7% of the cohort), where 67.8% of the survivors were discharged home from hospital, had a median APACHE II score of 19 (P25-P75: 12−27) and a median hospital LoS of 31 days (P25-P75: 14−58).

Population characteristics: baseline and hospital and ICMD care.
| Total (n = 185) | Group 1 (n = 64) | Group 2 (n = 59) | Group 3 (n = 62) | p | |
|---|---|---|---|---|---|
| Gender | |||||
| Number of males (%) | 127 (68.6) | 50 (78.1) | 38 (64.4) | 39 (62.9) | 0.128 |
| Age (years) | |||||
| Median (P25–P75) | 62 (52−73) | 62 (56−72) | 64 (56−74) | 55 (48−76) | 0.266 |
| Professionally active | |||||
| Number of patients (%) | 77 (41.6) | 24 (37.5) | 22 (37.3) | 31 (50.0) | 0.260 |
| Previous history of respiratory disease | |||||
| Number of patients (%) | 44 (23.8) | 13 (20.3) | 19 (32.2) | 12 (19.4) | 0.182 |
| Previous history of cardiovascular disease | |||||
| Number of patients (%) | 166 (89.7) | 58 (90.6) | 53 (89.8) | 55 (88.7) | 0.182 |
| Previous history of oncological disease | |||||
| Number of patients (%) | 27 (14.6) | 4 (6.2) | 14 (23.7) | 9 (14.5) | 0.023 |
| Previous history of neurological disease | |||||
| Number of patients (%) | 26 (14.0) | 7 (10.9) | 9 (15.2) | 10 (16.1) | 0.668 |
| Previous history of psychiatric disease | |||||
| Number of patients (%) | 31 (16.8) | 10 (15.6) | 11 (18.6) | 10 (16.1) | 0.893 |
| Diagnosis at ICMD admission, n (%) | |||||
| COVID-19 | 64 (34.6) | 64 (100.0) | 0 (0.0) | 0 (0.0) | <0.001 |
| Trauma | 8 (4.3) | 0 (0.0) | 3 (5.1) | 5 (8.1) | |
| Post-surgical | 24 (13.0) | 0 (0.0) | 7 (11.9) | 17 (27.4) | |
| Cardiac | 13 (7.0) | 0 (0.0) | 5 (8.5) | 8 (12.9) | |
| Respiratory | 19 (10.3) | 0 (0.0) | 10 (17.0) | 9 (14.5) | |
| Sepsis | 25 (13.5) | 0 (0.0) | 17 (28.8) | 8 (12.9) | |
| Other | 15 (24.2) | 0 (0.0) | 17 (28.8) | 15 (24.2) | |
| Destination after discharge from the hospital (ULSSJ), n (%) | |||||
| Home | 113 (61.1) | 24 (37.5) | 40 (67.8) | 49 (79.0) | <0.001 |
| Other hospital | 32 (17.3) | 17 (26.6) | 6 (10.2) | 9 (14.5) | |
| Rehabilitation centre | 18 (9.7) | 13 (20.3) | 4 (6.8) | 1 (1.6) | |
| Social institutions | 22 (11.9) | 10 (15.6) | 9 (15.2) | 3 (4.8) | |
| Evaluation timing (months) | |||||
| Median (P25–P75) | 16 (15−17) | 15 (14−16) | 16 (16−17) | 16 (16−17) | <0.001 |
| APACHE II score | |||||
| Median (P25–P75) | 16 (12−22) | 15 (12−20) | 19 (12−27) | 16 (11−22) | 0.040 |
| SAPS II score | |||||
| Median (P25-P75) | 37 (28−48) | 36 (29.5−43) | 41 (28−52) | 37.5 (26−50) | 0.598 |
| Length of stay at the ICMD (days) | |||||
| Median (P25–P75) | 10 (6−26) | 25.5 (9−48.5) | 8 (6−17) | 7.5 (6−13) | <0.001 |
| Length of stay at the hospital (ULSSJ) (days) | |||||
| Median (P25–P75) | 28 (15−53) | 38 (16−64.5) | 31 (14−58) | 22.5 (13−35) | 0.017 |
| Deep sedation | |||||
| Number of patients (%) | 114 (61.6) | 45 (70.3) | 27 (45.8) | 42 (67.7) | 0.010 |
| Duration in days, median (P25−75) | 8.5 (4−24) | 26 (13−38) | 6 (4−10) | 5 (3−6) | <0.001 |
| Invasive mechanical ventilation (IMV) | |||||
| Number of patients (%) | 116 (62.7) | 45 (70.3) | 28 (47.5) | 43 (69.4) | 0.013 |
| Duration in days, median (P25−75) | 10 (5−30) | 36 (16−49) | 9 (5−16) | 6 (4−9) | <0.001 |
| Non-Invasive mechanical ventilation (NIMV) | |||||
| Number of patients (%) | 93 (50.3) | 44 (68.8) | 27 (45.8) | 22 (35.5) | 0.001 |
| Duration in days, median (P25−75) | 4 (2−8) | 5.5 (4−9) | 3 (1−6) | 4 (2−7) | 0.004 |
| Renal replacement therapy (RRT) | |||||
| Number of patients (%) | 20 (10.8) | 4 (6.2) | 10 (17.0) | 6 (9.7) | 0.152 |
| Vasopressor support | |||||
| Number of patients (%) | 113 (61.1) | 41 (64.1) | 33 (55.9) | 39 (62.9) | 0.611 |
| Extra Corporeal Membrane Oxygenation (ECMO) | |||||
| Number of patients (%) | 17 (9.2) | 16 (25.0) | 0 (0.0) | 1 (1.6) | <0.001 |
| Neuromuscular blocking agents | |||||
| Number of patients (%) | 65 (35.1) | 43 (67.2) | 13 (22.0) | 9 (14.5) | <0.001 |
| Duration in days, median (P25−75) | 8 (2−18) | 15 (6−29) | 2 (2−4) | 2 (1−2) | <0.001 |
| Tracheostomy | |||||
| Number of patients (%) | 36 (19.5) | 29 (45.3) | 3 (5.1) | 4 (6.4) | <0.001 |
| Delirium | |||||
| Number of patients (%) | 57 (30.8) | 22 (34.4) | 16 (27.1) | 19 (30.6) | 0.684 |
ICMD – Intensive Care Medicine Department; COVID-19 – Coronavirus Disease 2019; APACHE II – Acute Physiology and Chronic Health Evaluation II; SAPS II – Simplified Acute Physiology Score II; ULSSJ – Unidade Local de Saúde São João; n – Number of patients; P25 – percentile 25; P75 – percentile 75.
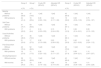
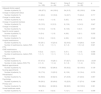
HRQoL assessment, using EuroQoL validated tool EQ-5D-5 L, with answers grouped in “No problems” and “Some problems” is presented in Table 2 and Appendices A.1. After adjustment for confounders, no statistically significant differences across groups were found for “Mobility” and “Pain or Discomfort” dimensions. Group 1 reported less problems in “Self-care” (OR = 0.15, 95%CI: 0.04−0.55), “Usual activities” (OR = 0.20, 95%CI: 0.08−0.0.52), and “Anxiety or Depression” (OR = 0.36, 95%CI: 0.14−0.97) dimensions, compared to Group 2. Group 3 showed no statistically significant differences in HRQoL dimensions in comparison to Group 2.
Health-Related Quality of Life 5 dimensions in the three Groups and comparing Group1 with Group 2 and Group 3 with Group 2 (categorized in “No problems”, “Some Problems”).
| Group 2 | Group 1 | Crude OR (95%CI) | Adjusted OR (95%CI) | Group 3 | Crude OR (95%CI) | Adjusted OR (95%CI) | |
|---|---|---|---|---|---|---|---|
| n (%) | n (%) | n (%) | |||||
| Mobility | |||||||
| Without problems | 34 (58.6) | 47 (74.6) | 1 [ref] | 1 [ref] | 43 (69.4) | 1 [ref] | 1 [ref] |
| With problems | 24 (41.4) | 16 (25.4) | 0.48 (0.22−1.04) | 0.42 (0.17−1.08) | 19 (30.6) | 0.62 (0.30−1.33) | 0.75 (0.34−1.67) |
| Self-Care | |||||||
| Without problems | 41 (70.7) | 59 (93.6) | 1 [ref] | 1 [ref] | 54 (87.1) | 1 [ref] | 1 [ref] |
| With problems | 17 (29.3) | 4 (6.4) | 0.16 (0.05−0.52) | 0.15 (0.04−0.55) | 8 (12.9) | 0.36 (0.14−0.91) | 0.39 (0.15−1.03) |
| Usual Activities | |||||||
| Without problems | 27 (46.5) | 46 (73.0) | 1 [ref] | 1 [ref] | 41 (66.1) | 1 [ref] | 1 [ref] |
| With problems | 31 (53.4) | 17 (27.0) | 0.32 (0.15−0.69) | 0.20 (0.08−0.52) | 21 (33.9) | 0.45 (0.21−0.93) | 0.52 (0.24−1.12) |
| Pain/Discomfort | |||||||
| Without problems | 42 (72.4) | 52 (82.5) | 1 [ref] | 1 [ref] | 45 (72.6) | 1 [ref] | 1 [ref] |
| With problems | 16 (27.6) | 11 (17.5) | 0.56 (0.23−1.32) | 0.46 (0.17−1.27) | 17 (27.4) | 0.99 (0.44−2.21) | 1.10 (0.47−2.57) |
| Anxiety/Depression | |||||||
| Without worries | 38 (65.5) | 51 (80.9) | 1 [ref] | 1 [ref] | 43 (69.4) | 1 [ref] | 1 [ref] |
| With worries | 20 (34.5) | 12 (19.1) | 0.48 (0.19−1.02) | 0.36 (0.14−0.97) | 19 (30.6) | 0.84 (0.39−1.80) | 1.01 (0.45−2.28) |
n – Number of patients; P25 – percentile 25; P75 – percentile 75; OR: Odds ratio; 95% CI – 95% confidence interval; ref - reference.
Health and disability outcomes were assessed by WHODAS 2.0 – 12 Items, grouped in 6 domains and responses categorized in “No difficulty” and “Some difficulty” (Table 3 and Appendices A.2 and A.3). There were no statistically significant differences in “Getting along” and “Participation” comparing the three cohorts. Group 1 had less difficulties in “Cognition” (OR = 0.37, 95%CI: 0.15−0.91), “Mobility” (OR = 0.25, 95%CI: 0.09−0.68), “Self-care” (OR = 0.15, 95%CI: 0.05−0.40) and “Life activities” (OR = 0.32, 95%CI: 0.13−0.76 dimensions compared to Group 2. Group 3 reported less difficulty in “Mobility” (OR = 0.25, 95%CI: 0.10−0.64) and there were no statistically significant differences for other dimensions, in comparison with Group 2.
Health and Disability domains assessment in the three Groups and comparing Group1 with Group 2 and Group 3 with Group 2 (categorized by 6 domains).
| Group 2 | Group 1 | Crude OR (95%CI) | Adjusted OR (95%CI) | Group 3 | Crude OR (95%CI) | Adjusted OR (95%CI) | |
|---|---|---|---|---|---|---|---|
| n (%) | n (%) | n (%) | |||||
| Cognition | |||||||
| No | 32 (55.2) | 47 (74.6) | 1 [ref] | 1 [ref] | 38 (61.3) | 1 [ref] | 1 [ref] |
| Yes | 26 (44.8) | 16 (25.4) | 0.42 (0.19−0.90) | 0.37 (0.15−0.91) | 24 (38.7) | 0.78 (0.38−1.61) | 0.96 (0.44−2.14) |
| Mobility | |||||||
| No | 9 (15.5) | 27 (42.9) | 1 [ref] | 1 [ref] | 28 (45.2) | 1 [ref] | 1 [ref] |
| Yes | 45 (77.6) | 36 (57.1) | 0.27 (0.11−0.64) | 0.25 (0.09−0.68) | 33 (53.2) | 0.24 (0.10−0.56) | 0.25 (0.10−0.64) |
| Not applicable | 4 (6.9) | 0 (0.0) | – | – | 1 (1.6) | – | – |
| Self-care | |||||||
| No | 27 (46.6) | 50 (79.4) | 1 [ref] | 1 [ref] | 39 (62.9) | 1 [ref] | 1 [ref] |
| Yes | 30 (51.7) | 13 (20.6) | 0.23 (0.10−0.52) | 0.15 (0.05−0.40) | 23 (37.1) | 0.53 (0.26−1.10) | 0.61 (0.28−1.32) |
| Not applicable | 1 (1.7) | 0 (0.0) | – | – | 0 (0.0) | – | – |
| Getting along | |||||||
| No | 49 (84.5) | 55 (87.3) | 1 [ref] | 1 [ref] | 48 (77.4) | 1 [ref] | 1 [ref] |
| Yes | 9 (15.5) | 8 (12.7) | 0.79 (0.28−2.21) | 0.53 (0.17−1.67) | 14 (22.6) | 1.59 (0.63−4.01) | 1.76 (0.64−4.85) |
| Life activities | |||||||
| No | 19 (32.8) | 37 (58.7) | 1 [ref] | 1 [ref] | 29 (46.8) | 1 [ref] | 1 [ref] |
| Yes | 36 (62.1) | 26 (41.3) | 0.37 (0.18−0.78) | 0.32 (0.13−0.76) | 31 (50.0) | 0.56 (0.27−1.20) | 0.70 (0.31−1.54) |
| Not applicable | 3 (5.1) | 0 (0.0) | – | – | 2 (3.2) | – | – |
| Participation | |||||||
| No | 11 (19.0) | 23 (36.5) | 1 [ref] | 1 [ref] | 19 (30.6) | 1 [ref] | 1 [ref] |
| Yes | 47 (81.0) | 40 (63.5) | 0.41 (0.18−0.94) | 0.41 (0.16−1.06) | 43 (69.4) | 0.53 (0.23−1.24) | 0.70 (0.29−1.70) |
n – Number of patients; P25 – percentile 25; P75 – percentile 75; OR: Odds ratio; 95% CI – 95% confidence interval; ref - Reference.
After adjustment for confounders, there were no statistically significant differences in “Getting along” and “Participation” comparing the three cohorts. Group 1 had less difficulties in “Cognition” (OR = 0.37, 95%CI: 0.15−0.91), “Mobility” (OR = 0.25, 95%CI: 0.09−0.68), “Self-care” (OR = 0.15, 95%CI: 0.05−0.40) and “Life activities” (OR = 0.32, 95%CI: 0.13−0.76 dimensions compared to Group 2. Group 3 reported less difficulty in “Mobility” (OR = 0.25, 95%CI: 0.10−0.64) and there were no statistically significant differences for other dimensions, in comparison with Group 2.
Post-hospital discharge needsConsidering post hospital discharge needs (Table 4), 97.3% of survivors reported adequate familiar support, with Group 2 showing the lowest percentage (91.5%, P = 0.004). In addition to family support, Group 2 and Group 3 needed external caregivers in 6.8% and 9.7% of the cases, respectively, while no patient in Group 1 needed it (P = 0.048). Although 22.2% of survivors described an impact on their employment status, namely retirement, unemployment, sick leave or adapted working conditions after hospital admission, no statistically significant differences are found among cohorts. The number of patients readmitted to hospital during the 16 months following hospital discharge was significantly higher in Group 2 (54.2%) than in Groups 1 (23.4%) and 3 (29.0%) (P = 0.001). The number of patients that needed emergency care in the same period was also higher in Group 2 (62.7%) than in Group 3 (51.6%) and markedly higher than in Group 1 (28.1%) (P < 0.001). Unmet healthcare needs occurred significantly less often in Group1 than in the other two Groups (P = 0.008).
Post-Hospital discharge data, globally and in the three Groups.
| Total (n = 185) | Group 1 (n = 64) | Group 2 (n = 59) | Group 3 (n = 62) | p | |
|---|---|---|---|---|---|
| Adequate family support | |||||
| Number of patients (%) | 180 (97.3) | 64 (100.0) | 54 (91.5) | 62 (100.0) | 0.004 |
| Change in employment status | |||||
| Number of patients (%) | 41 (22.2) | 12 (18.8) | 14 (23.7) | 15 (24.2) | 0.717 |
| Change in marital status | |||||
| Number of patients (%) | 10 (5.4) | 1 (1.6) | 5 (8.5) | 4 (6.4) | 0.216 |
| Change in household members | |||||
| Number of patients (%) | 25 (13.5) | 8 (12.5) | 8 (13.6) | 9 (14.5) | 0.947 |
| Change in household | |||||
| Number of patients (%) | 19 (10.3) | 5 (7.8) | 8 (13.6) | 6 (9.7) | 0.567 |
| Need for social support | |||||
| Number of patients (%) | 10 (5.4) | 1 (1.6) | 4 (6.8) | 5 (8.1) | 0.232 |
| Need for a caregiver | |||||
| Number of patients (%) | 10 (5.4) | 0 (0.0) | 4 (6.8) | 6 (9.7) | 0.048 |
| Hospital readmissions | |||||
| Number of patients (%) | 65 (35.1) | 15 (23.4) | 32 (54.2) | 18 (29.0) | 0.001 |
| Number of readmissions, median (P25-P75) | 1 (1−2) | 1 (1−1) | 2 (1−3) | 1.5 (1−2) | 0.021 |
| ICMD readmissions | |||||
| Number of patients (%) | 6 (3.2) | 2 (3.1) | 3 (5.1) | 1 (1.6) | 0.558 |
| Number of readmissions, median (P25-P75) | 1 (1−1) | 1 (1−1) | 1 (1−2) | 1 (1−1) | 0.606 |
| Emergency visits | |||||
| Number of patients (%) | 87 (47.0) | 18 (28.1) | 37 (62.7) | 32 (51.6) | <0.001 |
| Number of visits, median (P25-P75) | 2 (1−3) | 1 (1−2) | 3 (1−5) | 1 (1−2) | 0.014 |
| Medical appointments | |||||
| Number of patients (%) | 179 (96.8) | 62 (96.9) | 55 (93.2) | 62 (100.0) | 0.109 |
| Nursing appointments | |||||
| Number of patients (%) | 33 (17.8) | 13 (20.3) | 8 (13.6) | 12 (19.4) | 0.576 |
| Rehabilitation | |||||
| Number of patients (%) | 94 (50.8) | 40 (62.5) | 27 (45.8) | 27 (43.6) | 0.067 |
| Psychology | |||||
| Number of patients (%) | 56 (30.3) | 26 (40.6) | 13 (22.0) | 17 (27.4) | 0.068 |
| Primary care | |||||
| Number of patients (%) | 182 (98.4) | 62 (96.9) | 58 (98.3) | 62 (100.0) | 0.381 |
| Unmet healthcare needs | |||||
| Number of patients (%) | 16 (8.7) | 0 (0.0) | 7 (12.1) | 9 (14.5) | 0.008 |
ICMD – Intensive Care Medicine Department; P25 – percentile 25; P75 – percentile 75.
Our study shows that Group 2 (non-COVID pandemic cohort) patients have significantly lower HRQoL in terms of “Self-care”, “Usual Activities” and “Anxiety/Depression” and worse functional status, in terms of “Mobility”, compared with Group 1 (COVID-19 cohort during the pandemics), and higher post-discharge healthcare needs and healthcare use, namely hospital readmissions, emergency visits and need for caregiver, than Groups 1 and 3 (non-COVID post-pandemic cohort). This occurred despite a significantly longer ICMD and hospital (ULSSJ) LoS, longer sedation, neuromuscular blockade and invasive mechanical ventilation, higher frequency of tracheostomies and more frequent use of Extra Corporeal Membrane Oxygenation (ECMO) in Group 1 patients than in the other two groups.
There are several studies comparing contemporaneous COVID-19 and non-COVID-19 cohorts during the pandemics, therefore exposed to the same context and conditions. In some,18–20 severe COVID-19 survivors are more likely to develop significant sequelae due to longer hospitalization and longer invasive ventilatory support and sedation. However, most published studies comparing critical care survivors with severe COVID-19 and other causes of critical illness show similar long-term outcomes. McPeak et al.21,22 conducted a propensity matched control cohort study, based on a pre-existing ICMD rehabilitation programme (“InSPIRE”) and concluded that patients who have been critically ill due to COVID-19 experience similar problems to other ICU survivors after discharge. Hodgson, et al.5 compared 6-month outcomes of COVID-19 and non-COVID-19 critical patients mechanically ventilated for acute respiratory failure, that showed that survivors in both groups had similar incidence and severity of new disability, HRQoL, psychological and cognitive functions at 6 months. In this study both groups reported new disabilities in all domains, which is in line with our results. HRQoL and autonomy at 6 months post-discharge were also studied by Thiolliere et al.23 in a comparison of two populations of patients aged over 60 admitted to ICMD. They found that critical COVID-19 was not associated with lower HRQoL or autonomy compared to non-COVID-19 related ICMD stay. Rousseau et al.24 compared PICS and HRQoL of COVID-19 acute respiratory distress syndrome and non-COVID-19 survivors referred to a follow-up clinic at 3 months after ICU discharge showing similar alterations in the main PICS domains, despite longer ICU stay in the COVID group.
Our findings are consistent with recent studies on post-ICU outcomes. Gimenez-Esparza Vich et al.25 found that non-COVID-19 patients exhibited worse functional dependence and lower quality of life ate both 3- and 12-months post-discharge compared to COVID-19 survivors, which closely mirrors our results. In our cohort, non-COVID-19 patients admitted during the pandemic period experienced significantly greater long-term disability and worse quality of life in several domains, despite higher ICU resource use among COVID-19 survivors. Importantly, we also identified that non-COVID-19 patients admitted after the pandemic peak have intermediate outcomes, supporting the hypothesis the healthcare system strain and resource allocation during the pandemic contributed to the differences.
Several mechanisms may explain the unfavorable long-term outcomes observed in non-COVID-19 ICU admitted during the pandemic. First the reallocation of ICU beds, staff, and rehabilitation services toward COVID-19 care led to resource constraints for non-COVID-19 cases, resulting in delays in admission, diagnostic imaging, and advanced monitoring therapy – factors known to adversely affect outcomes. In Leafloor et al.26 a large cohort reported increased mortality among COVID-19 ICU patients during pandemic compared to a non-pandemic cohort (13.5% vs 12.5% p < 0.01). Second, structured post-discharge support and rehabilitation programs were disrupted or suspended during pandemic surges, further hindering functional recovery. A recent multicenter study27 reported that 73% of COVID-19 ICU survivors still had substantial impairments at two years, highlighting how even direct pandemic care could prolong disability. A possible explanation for the finding that critical care patients admitted during the pandemic for other causes than SARS-CoV-2 infection reported a lower HRQoL, higher disability and greater healthcare needs and use than the concomitant COVID-19 cohort, in spite of the latter group longer and higher use of intensive care resources, may be that, during the pandemic, the healthcare system has built up a response to COVID-19 at the cost of a reduction of the response to non-COVID-19 patients and diseases.
Third the psychological tool – induced by restricted visitation, mental fatigue of health care teams, and social isolation – may have compounded the physical and cognitive sequelae. The discussion of the determinants of this worse outcome deserves further research.
Non-COVID-19 patients admitted during the pandemic period had a higher prevalence of previous oncological disease (23.7%), a higher prevalence of sepsis (28.8 %) and a higher APACHE II, which could account for a slower rehabilitation process and social integration. Moreover, Group 3 had a higher prevalence of post-surgery patients (27.4%), eventually leading to a faster recovery. Factors like late access to the ICU due to lower bed availability and worse clinical control of comorbidities, not assessed in our study, may also have impacted.
This study has several limitations that should be acknowledged. First, there is a risk of selection bias due to the exclusion of the institutionalized patients and those not reachable for follow-up, which may have led to an underestimation of long-term disability and impaired quality of life. Additionally, patients with an ICU LoS less than four days were excluded, in line with National Institute for Health and Care Excellence (NICE)28 recommendations; however, this cutoff may not capture all relevant cases, and some previous studies have used a shorter duration (i.e. ≥ 12 h), potentially limiting comparability. Second, there is a possible memory bias related to health and disability assessment taking into account that it assesses the difficulty in the performance of daily tasks before hospital admission, (that is, going back 16 months) compared to the last month before our evaluation. Third, sample size was not calculated during the study design, as the three cohorts were defined by the time of ICU admission, related to the pandemic period and the timing of assessment (16 months after discharged home). That said, the sample size could not be expanded recruiting more patients over time. Another possibility could be to include other centers in the study, making it a multicenter study, which, given the special characteristics of our department, could lead to more heterogeneity within the sample. The three cohorts were defined by the time of ICU admission, related to the pandemic period and the timing of assessment (16 months after discharged home). Fourth, we did not have access to pre-ICU baseline HRQoL or disability measures, making it difficult to fully quantify the degree of decline attributable to critical illness and ICU admission. Fifth, the study groups were heterogenous with respect to the etiology of critical illness among non-COVID-19 survivors, which may introduce confounders despite multivariable adjustments. Lastly, the single-center study design may limit generalizability, and unmeasured confounders may persist despite our methodological efforts.
This study has several notable strengths. First it was conducted at a tertiary academic hospital and ECMO reference center, ensuring access to advanced critical care and standardized protocols for both COVID-19 and non-COVID-19 patients. Second, we performed a long-term follow-up at a median of 16 months post-discharge, providing robust data on persisting quality of life and disability. Third, the inclusion of three distinct cohorts – COVID-19 survivors during the pandemic, non-COVID-19 during the pandemic, and non-COVID-19 patients admitted after the pandemic peak – allowed for unique comparable analysis and enable us to disentangle the effects of the disease from the healthcare context. Lastly, the use of validated, standardized instruments (EQ-5D-5L and WHODAS 2.0 - 12 Items) enhances the reliability and external validity of our findings.
ConclusionsIn conclusion, non-COVID-19 patients admitted to the ICU during the pandemic period experienced the greatest burden of long-term disability and impaired quality of life, compared to COVID-19 survivors and non-COVID-19 survivors admitted after the pandemic peak. COVID-19 survivors demonstrated better recovery than their non-COVID-19 counterparts, and outcomes for patients admitted after the pandemic peak were intermediate. The results underscore the substantial impact of healthcare system pressures during the pandemic and the importance of structured follow-up care for all ICU survivors.
Our results suggest that all ICU survivors – whether their critical illness was due to COVID-19 or other causes, and irrespective of when they were admitted – are likely to benefit from structured follow-up and targeted rehabilitation to improve long-term outcomes and facilitate reintegration into daily life.
Further research should focus on standardizing assessment methods for long-term quality of life and disability in ICU survivors, enabling better comparison across studies and settings. Efforts are also needed to expand access to multidisciplinary follow-up clinics, integrating physical, psychological, and social support for survivors and their families. Finally, further studies should explore targeted interventions for high-risk subgroups, including non-COVID-19 patients admitted during periods of health care system strain, to reduce long-term morbidity and optimize recovery.
Ethics approval and consent to participateThis study is included in MAPA - Mental health in critical ill COVID-19 patients: Implementation of an Active Monitoring and Post-Discharge Support Program, a longitudinal project approved by the Ethics Committee of ULSSJ (authorization number 218/2020). In the telephone contact, information was provided about the study objectives and relevance, obtaining verbal consent for the evaluation.
CRediT authorship contribution statementAll authors approved the final version to be submitted.
- –
LF: conception and design of the study, acquisition of data, analysis and interpretation of data, drafting the article and revising it critically for important intellectual content, final approval of the version to be submitted.
- –
BP: conception and design of the study, analysis and interpretation of data, revising the article critically for important intellectual content, final approval of the version to be submitted.
- –
PC: conception and design of the study, revising the article critically for important intellectual content, final approval of the version to be submitted.
- –
JF, TV, AB, SM, AF, IC, LF: interpretation of data, revising the article critically for important intellectual content, final approval of the version to be submitted.
- –
JP: conception and design of the study, analysis and interpretation of data, revising the article critically for important intellectual content, final approval of the version to be submitted.
Not applicable.
Declaration of Generative AI and AI-assisted technologies in the writing processDuring the preparation of this work the author(s) did not use AI tools/services.
FundingThis research did not receive any specific grant from funding agencies in the public, commercial, or not-for-profit sectors.
Availability of data and materialsThe datasets used and/or analyzed during the current study are available from the corresponding author on reasonable request.
The authors have nothing to declare.
The authors thank to César Teixeira Monteiro (RN) for his contribution in Spanish Abstract translation.
The following is Supplementary data to this article: