The incorporation of innovation, both technological and pharmacological, into the world of medicine has substantially modified the diagnostic and therapeutic processes for so many diseases.
With the development of new molecules, the prognosis of many neoplasms has drastically changed in recent years, showing an increase in survival. This situation poses a challenge when considering the admission of these patients to intensive care units. It is necessary to avoid grouping all cancer patients into a single category and start individualizing treatment.1
Regardless of the reason for ICU admission, this subgroup of patients can benefit from the creation of multidisciplinary teams for their management. This involves strengthening ties among different specialties involved in both the acute process at the ICU setting and their subsequent follow-up in conventional hospitalization wards. Indeed, a growing trend is management by multiple professionals in wards, with close monitoring through alert systems.2
We conducted a prospective cohort study was conducted in the ICU of a tertiary referral center. All adult patients with solid organ tumors who experience an acute event (whether medical or surgical) and require assessment by the intensive care service for potential ICU admission were consecutively recruited over a period of 2 years. A total of 215 patients were consecutively recruited, with no losses to follow-up. A total of 173 of these patients were admitted to the ICU and 42 were denied admission as a measure of life support limitation. Within the group of patients who were denied admission, the reasons for ICU admission denial given by the intensivist and their association with the 6-month mortality rate were evaluated. These reasons for rejection were drawn from the ADENI-UCI trial3 since there are no specific studies in this population. The study received approval from Cantabria Research Ethics Committee (CEI). Since no intervention was required, informed consent was deemed unnecessary.
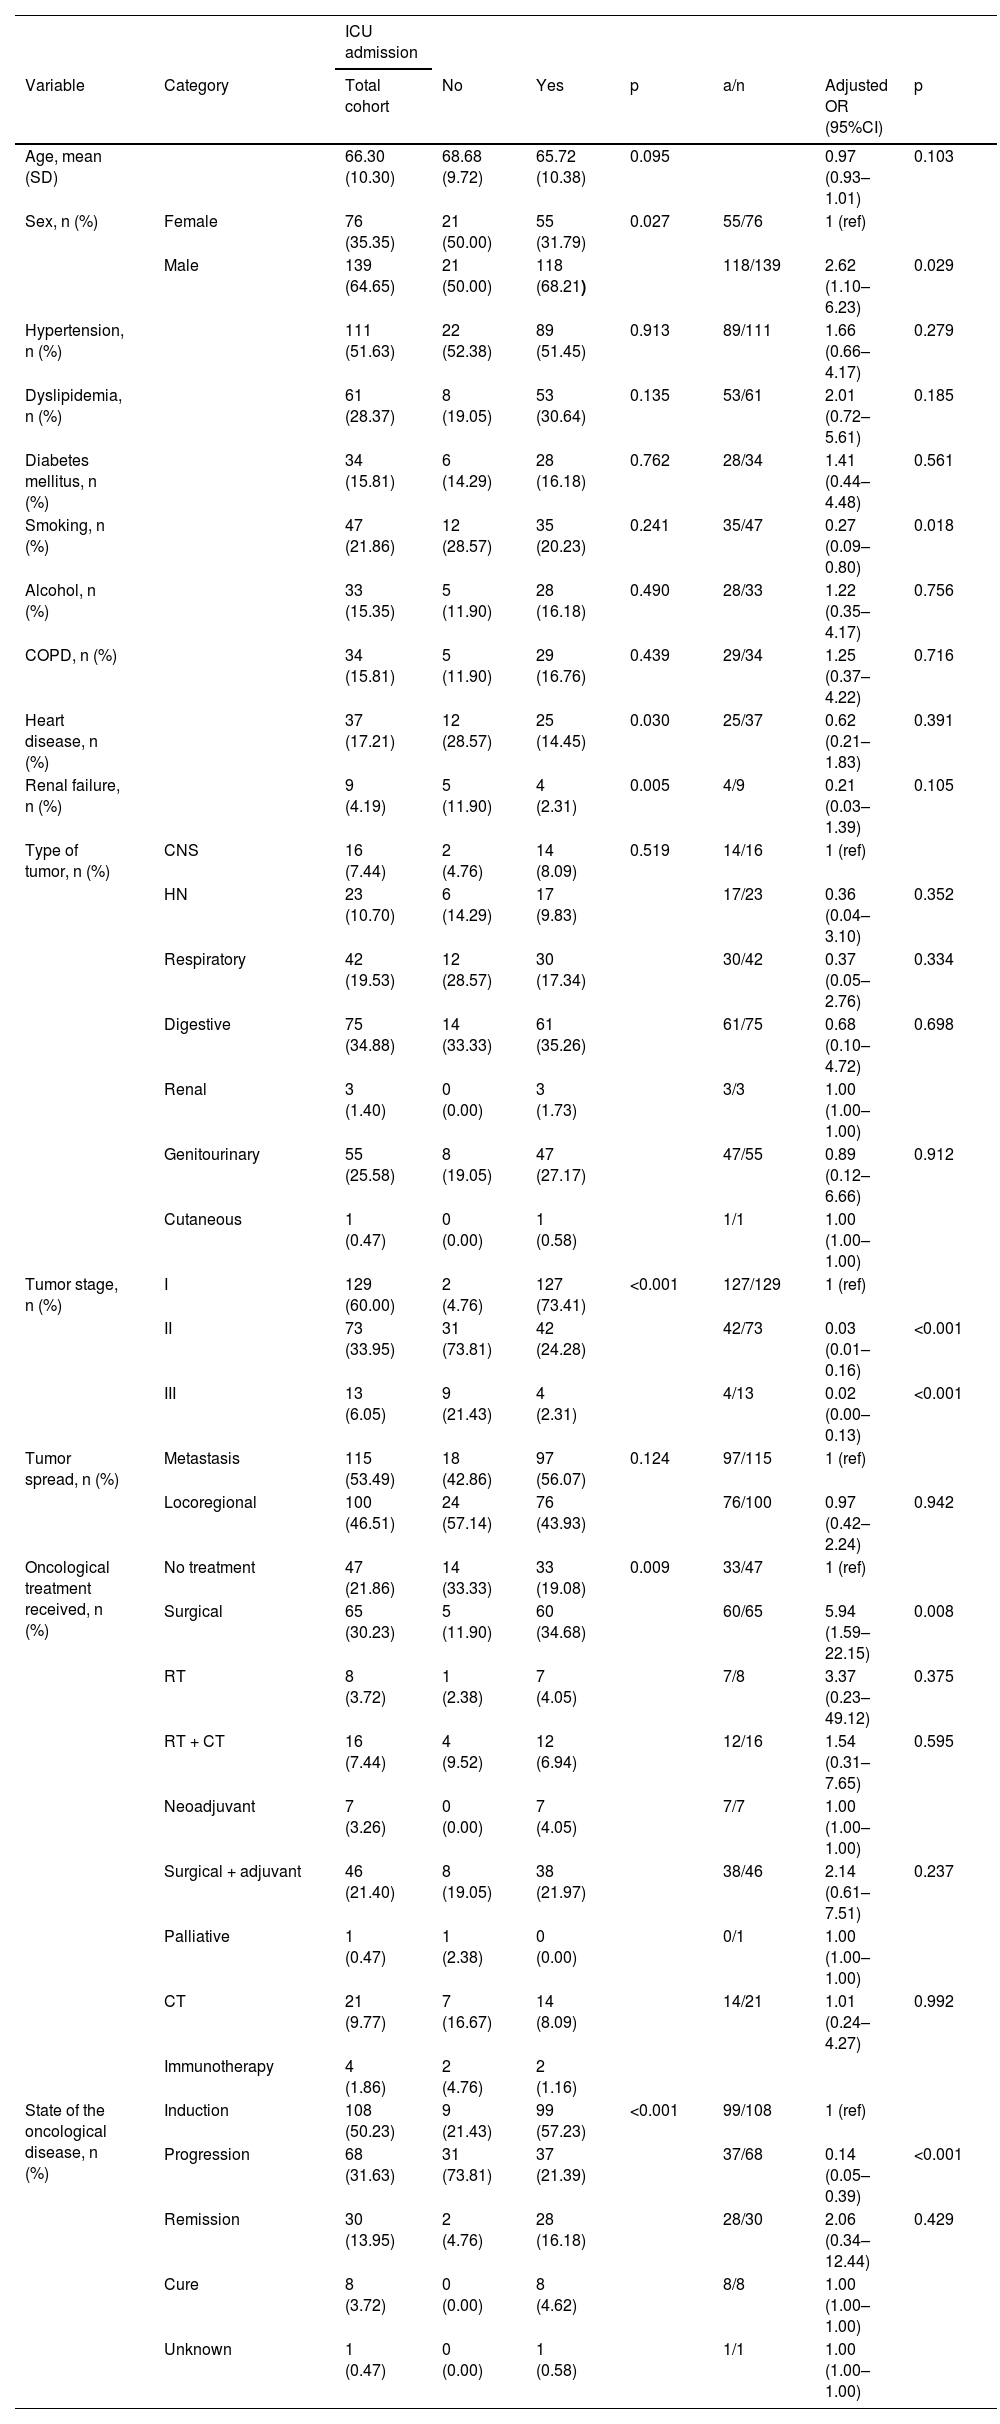
The general characteristics of the sample and their association with ICU admission are detailed in Table 1.
General characteristics and their association with ICU admission.
| ICU admission | ||||||||
|---|---|---|---|---|---|---|---|---|
| Variable | Category | Total cohort | No | Yes | p | a/n | Adjusted OR (95%CI) | p |
| Age, mean (SD) | 66.30 (10.30) | 68.68 (9.72) | 65.72 (10.38) | 0.095 | 0.97 (0.93–1.01) | 0.103 | ||
| Sex, n (%) | Female | 76 (35.35) | 21 (50.00) | 55 (31.79) | 0.027 | 55/76 | 1 (ref) | |
| Male | 139 (64.65) | 21 (50.00) | 118 (68.21) | 118/139 | 2.62 (1.10–6.23) | 0.029 | ||
| Hypertension, n (%) | 111 (51.63) | 22 (52.38) | 89 (51.45) | 0.913 | 89/111 | 1.66 (0.66–4.17) | 0.279 | |
| Dyslipidemia, n (%) | 61 (28.37) | 8 (19.05) | 53 (30.64) | 0.135 | 53/61 | 2.01 (0.72–5.61) | 0.185 | |
| Diabetes mellitus, n (%) | 34 (15.81) | 6 (14.29) | 28 (16.18) | 0.762 | 28/34 | 1.41 (0.44–4.48) | 0.561 | |
| Smoking, n (%) | 47 (21.86) | 12 (28.57) | 35 (20.23) | 0.241 | 35/47 | 0.27 (0.09–0.80) | 0.018 | |
| Alcohol, n (%) | 33 (15.35) | 5 (11.90) | 28 (16.18) | 0.490 | 28/33 | 1.22 (0.35–4.17) | 0.756 | |
| COPD, n (%) | 34 (15.81) | 5 (11.90) | 29 (16.76) | 0.439 | 29/34 | 1.25 (0.37–4.22) | 0.716 | |
| Heart disease, n (%) | 37 (17.21) | 12 (28.57) | 25 (14.45) | 0.030 | 25/37 | 0.62 (0.21–1.83) | 0.391 | |
| Renal failure, n (%) | 9 (4.19) | 5 (11.90) | 4 (2.31) | 0.005 | 4/9 | 0.21 (0.03–1.39) | 0.105 | |
| Type of tumor, n (%) | CNS | 16 (7.44) | 2 (4.76) | 14 (8.09) | 0.519 | 14/16 | 1 (ref) | |
| HN | 23 (10.70) | 6 (14.29) | 17 (9.83) | 17/23 | 0.36 (0.04–3.10) | 0.352 | ||
| Respiratory | 42 (19.53) | 12 (28.57) | 30 (17.34) | 30/42 | 0.37 (0.05–2.76) | 0.334 | ||
| Digestive | 75 (34.88) | 14 (33.33) | 61 (35.26) | 61/75 | 0.68 (0.10–4.72) | 0.698 | ||
| Renal | 3 (1.40) | 0 (0.00) | 3 (1.73) | 3/3 | 1.00 (1.00–1.00) | |||
| Genitourinary | 55 (25.58) | 8 (19.05) | 47 (27.17) | 47/55 | 0.89 (0.12–6.66) | 0.912 | ||
| Cutaneous | 1 (0.47) | 0 (0.00) | 1 (0.58) | 1/1 | 1.00 (1.00–1.00) | |||
| Tumor stage, n (%) | I | 129 (60.00) | 2 (4.76) | 127 (73.41) | <0.001 | 127/129 | 1 (ref) | |
| II | 73 (33.95) | 31 (73.81) | 42 (24.28) | 42/73 | 0.03 (0.01–0.16) | <0.001 | ||
| III | 13 (6.05) | 9 (21.43) | 4 (2.31) | 4/13 | 0.02 (0.00–0.13) | <0.001 | ||
| Tumor spread, n (%) | Metastasis | 115 (53.49) | 18 (42.86) | 97 (56.07) | 0.124 | 97/115 | 1 (ref) | |
| Locoregional | 100 (46.51) | 24 (57.14) | 76 (43.93) | 76/100 | 0.97 (0.42–2.24) | 0.942 | ||
| Oncological treatment received, n (%) | No treatment | 47 (21.86) | 14 (33.33) | 33 (19.08) | 0.009 | 33/47 | 1 (ref) | |
| Surgical | 65 (30.23) | 5 (11.90) | 60 (34.68) | 60/65 | 5.94 (1.59–22.15) | 0.008 | ||
| RT | 8 (3.72) | 1 (2.38) | 7 (4.05) | 7/8 | 3.37 (0.23–49.12) | 0.375 | ||
| RT + CT | 16 (7.44) | 4 (9.52) | 12 (6.94) | 12/16 | 1.54 (0.31–7.65) | 0.595 | ||
| Neoadjuvant | 7 (3.26) | 0 (0.00) | 7 (4.05) | 7/7 | 1.00 (1.00–1.00) | |||
| Surgical + adjuvant | 46 (21.40) | 8 (19.05) | 38 (21.97) | 38/46 | 2.14 (0.61–7.51) | 0.237 | ||
| Palliative | 1 (0.47) | 1 (2.38) | 0 (0.00) | 0/1 | 1.00 (1.00–1.00) | |||
| CT | 21 (9.77) | 7 (16.67) | 14 (8.09) | 14/21 | 1.01 (0.24–4.27) | 0.992 | ||
| Immunotherapy | 4 (1.86) | 2 (4.76) | 2 (1.16) | |||||
| State of the oncological disease, n (%) | Induction | 108 (50.23) | 9 (21.43) | 99 (57.23) | <0.001 | 99/108 | 1 (ref) | |
| Progression | 68 (31.63) | 31 (73.81) | 37 (21.39) | 37/68 | 0.14 (0.05–0.39) | <0.001 | ||
| Remission | 30 (13.95) | 2 (4.76) | 28 (16.18) | 28/30 | 2.06 (0.34–12.44) | 0.429 | ||
| Cure | 8 (3.72) | 0 (0.00) | 8 (4.62) | 8/8 | 1.00 (1.00–1.00) | |||
| Unknown | 1 (0.47) | 0 (0.00) | 1 (0.58) | 1/1 | 1.00 (1.00–1.00) |
CNS: central nervous system, CT, chemotherapy; HN, head and neck, stage I, potential cure, stage II, not curable, stage III, palliative management, RT, radiotherapy.
A total of 173 out of all the patients from our sample were admitted to the ICU, with a mean age of 65.72 years (SD, 10.38) (p = 0.095). A significant correlation was seen between ICU admission and the sex of the patients. We found a higher probability of admission in men vs women (OR, 2.62, [95%CI, 1.10–6.23]) and a lower probability of admission if the patient was a smoker (OR 0.27, [95%CI, 0.09–0.80]).
Among the comorbidities studied, heart disease and renal failure showed different behaviors between patients admitted to the ICU and those who were not. A total of 28.57% (n = 12) of patients with heart disease were not admitted to the ICU, as opposed to 14.45% (n = 25) of those who were actually admitted. Also, the rate of former smokers was not the same, with 11.90% (n = 5) were not admitted to the ICU, while 27.17% (n = 47) were actually admitted.
Regarding the type of primary tumor, a heterogeneous distribution was noted. In the entire cohort, digestive tumors were predominant at 34.88% (n = 75), followed by genitourinary tumors at 25.58% (n = 55).
Regarding the tumor stage, we found that patients in stage II and stage III reduced the risk of ICU admission by 97%–98% vs patients in stage I (OR, 0.03 [95%CI, 0.01–0.16] for stage II) and III (OR 0.02 [95%CI, 0.00–0.13]). Patients in the progression stage were 86% less likely to be admitted to the ICU than those in the induction stage (OR, 0.14, [OR, 5.94, [95%CI, 0.05–0.39]).
All patients on neoadjuvant therapy were admitted to the ICU compared with 0 patients on palliative treatment. Patients who underwent prior surgical treatment were nearly 6 times more likely to be admitted to the ICU vs those with no oncological treatment.
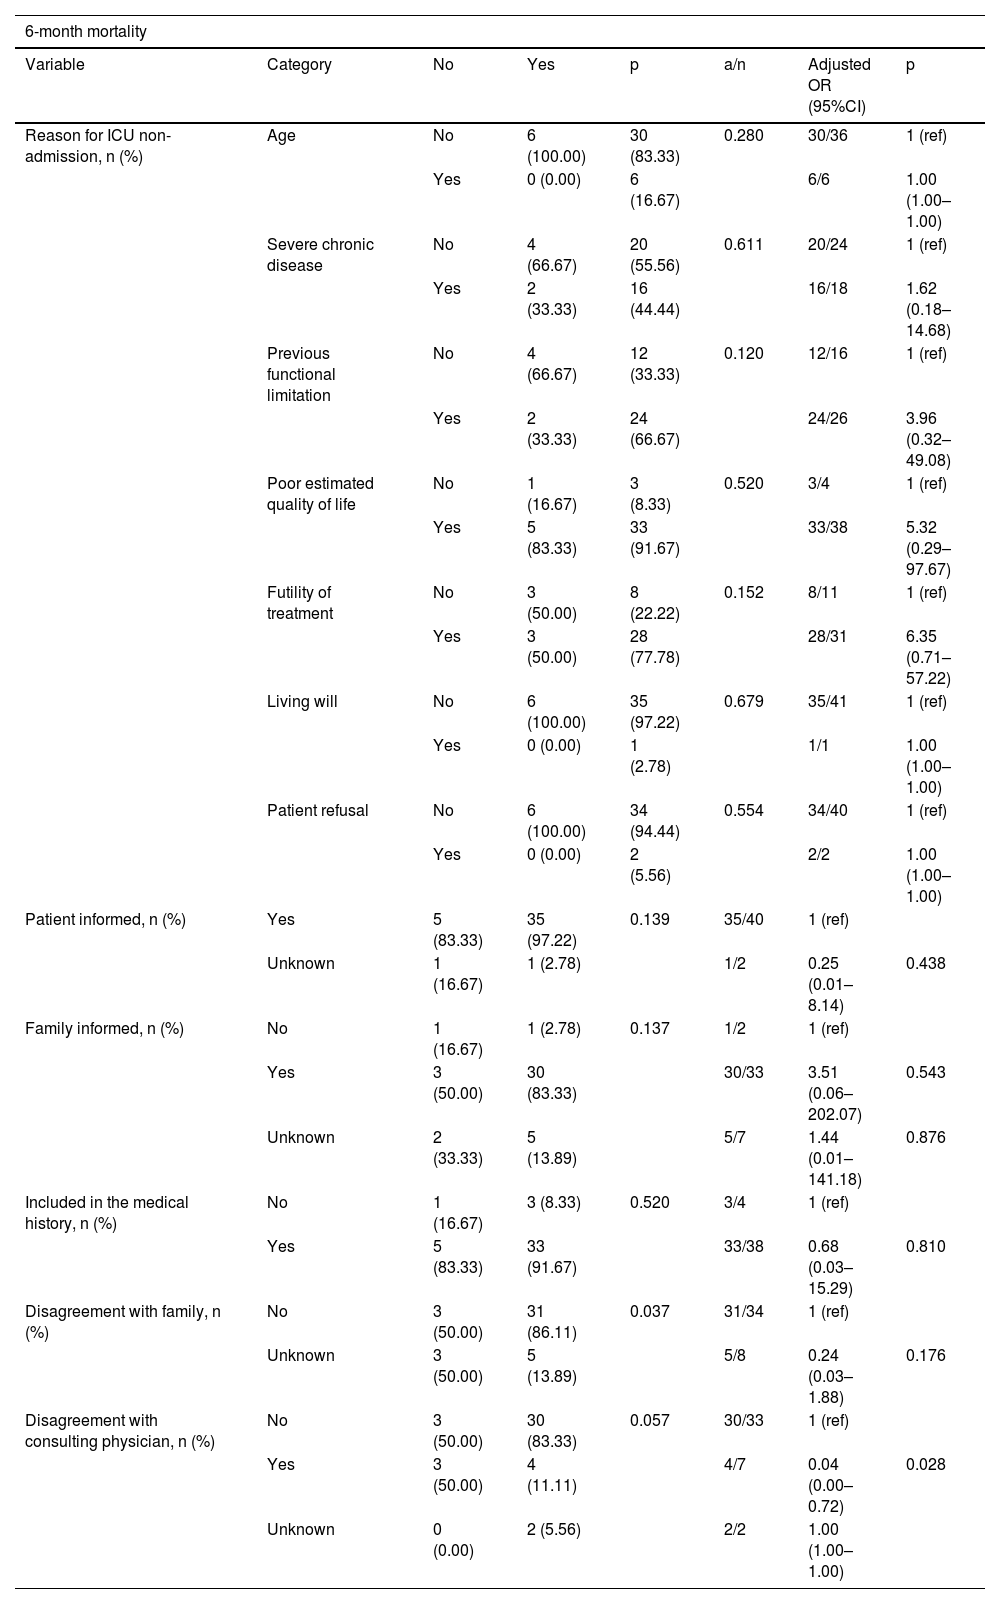
The association between the characteristics associated with ICU admission denial and the 6-month mortality rate is shown inTable 2.
ICU admission denial characteristics associated with 6-month mortality.
| 6-month mortality | |||||||
|---|---|---|---|---|---|---|---|
| Variable | Category | No | Yes | p | a/n | Adjusted OR (95%CI) | p |
| Reason for ICU non-admission, n (%) | Age | No | 6 (100.00) | 30 (83.33) | 0.280 | 30/36 | 1 (ref) |
| Yes | 0 (0.00) | 6 (16.67) | 6/6 | 1.00 (1.00–1.00) | |||
| Severe chronic disease | No | 4 (66.67) | 20 (55.56) | 0.611 | 20/24 | 1 (ref) | |
| Yes | 2 (33.33) | 16 (44.44) | 16/18 | 1.62 (0.18–14.68) | |||
| Previous functional limitation | No | 4 (66.67) | 12 (33.33) | 0.120 | 12/16 | 1 (ref) | |
| Yes | 2 (33.33) | 24 (66.67) | 24/26 | 3.96 (0.32–49.08) | |||
| Poor estimated quality of life | No | 1 (16.67) | 3 (8.33) | 0.520 | 3/4 | 1 (ref) | |
| Yes | 5 (83.33) | 33 (91.67) | 33/38 | 5.32 (0.29–97.67) | |||
| Futility of treatment | No | 3 (50.00) | 8 (22.22) | 0.152 | 8/11 | 1 (ref) | |
| Yes | 3 (50.00) | 28 (77.78) | 28/31 | 6.35 (0.71–57.22) | |||
| Living will | No | 6 (100.00) | 35 (97.22) | 0.679 | 35/41 | 1 (ref) | |
| Yes | 0 (0.00) | 1 (2.78) | 1/1 | 1.00 (1.00–1.00) | |||
| Patient refusal | No | 6 (100.00) | 34 (94.44) | 0.554 | 34/40 | 1 (ref) | |
| Yes | 0 (0.00) | 2 (5.56) | 2/2 | 1.00 (1.00–1.00) | |||
| Patient informed, n (%) | Yes | 5 (83.33) | 35 (97.22) | 0.139 | 35/40 | 1 (ref) | |
| Unknown | 1 (16.67) | 1 (2.78) | 1/2 | 0.25 (0.01–8.14) | 0.438 | ||
| Family informed, n (%) | No | 1 (16.67) | 1 (2.78) | 0.137 | 1/2 | 1 (ref) | |
| Yes | 3 (50.00) | 30 (83.33) | 30/33 | 3.51 (0.06–202.07) | 0.543 | ||
| Unknown | 2 (33.33) | 5 (13.89) | 5/7 | 1.44 (0.01–141.18) | 0.876 | ||
| Included in the medical history, n (%) | No | 1 (16.67) | 3 (8.33) | 0.520 | 3/4 | 1 (ref) | |
| Yes | 5 (83.33) | 33 (91.67) | 33/38 | 0.68 (0.03–15.29) | 0.810 | ||
| Disagreement with family, n (%) | No | 3 (50.00) | 31 (86.11) | 0.037 | 31/34 | 1 (ref) | |
| Unknown | 3 (50.00) | 5 (13.89) | 5/8 | 0.24 (0.03–1.88) | 0.176 | ||
| Disagreement with consulting physician, n (%) | No | 3 (50.00) | 30 (83.33) | 0.057 | 30/33 | 1 (ref) | |
| Yes | 3 (50.00) | 4 (11.11) | 4/7 | 0.04 (0.00–0.72) | 0.028 | ||
| Unknown | 0 (0.00) | 2 (5.56) | 2/2 | 1.00 (1.00–1.00) | |||
No significant differences were found in the 6-month mortality rate and the various reasons for ICU admission denial.
Regarding the information given to the patient, no significant differences were observed. However, it was noted that 86.11% (n = 31) of patients who did not disagree with the family was found died (p = 0.037). Similarly, a total of 83.33% (n = 30) of patients who did not disagree with the consulting physician was found died, although with borderline significance (p = 0.057).
Analyzing the group of patients who were denied access to the ICU, we found that those who disagreed with the consulting physician had fewer chances of dying (OR, 0.04 [95%CI, 0.00–0.72]).
Intensivists are the specialists best trained to address the patient’s life support, but the patient’s regular oncologist or hematologist is the one who best knows the underlying neoplasm and the available therapeutic options. We believe that the creation of multidisciplinary teams4,5 for making these types of decisions is essential. These teams should provide comprehensive knowledge of the patient, balance the benefits and negative aspects of ICU admission, establish effective communication with the patient and family, and ensure continuity of care.
In conclusion, future studies are necessary to analyze the reasons for ICU admission denial in this population and examine the degree of agreement between the consulting physician and the consulted physician.
FundingNo funding has been received.
Conflicts of interestNone declared.


