


We aimed to determine predictors of non-invasive ventilation (NIV) failure and validate a nomogram to identify patients at risk of NIV failure.
DesignObservational, analytical study of a retrospective cohort from a single center, compared with an external cohort (March 2020 to August 2021).
SettingTwo intensive care units (ICUs).
PatientsPatients with pneumonia due to severe acute respiratory syndrome (SARS-CoV-2) and NIV > 24 h (154 and 229 in each cohort).
InterventionsThe training cohort identified NIV failure predictors. A nomogram, created via logistic regression, underwent validation with the Hosmer-Lemeshow (HL), calibration curve and test and area under the curve (AUC). Its external validity was tested using AUC.
Main variables of interestDemographics, comorbidities, severity scores, NIV settings, vital signs, blood gases, and oxygenation at the start and 24 h after NIV, NIV failure.
ResultsNIV failure was 37.6% and 18% in the training and validation cohorts, respectively. Risk factors for NIV failure inluded age, obesity, sequential organ failure assessment (SOFA) score at admission, and heart rate (HR) and heart rate, acidosis, consciousness, oxygenation, respiratory rate (HACOR) 24 h post-NIV. The model's HL test result was 0.861, with an AUC of 0.89 (confidence interval [CI] 0.839–0.942); validation AUC was 0.547 (CI 0.449–0.645).
ConclusionsA predictive model using age, obesity, SOFA score, HR, and HACOR at 24 h predicts NIV failure in our COVID-19 patients but may not apply to other ICUs.
Determinar los predictores de fracaso de ventilación no invasiva (VNI) y validar un nomograma para identificar el riesgo de fracaso de VNI.
DiseñoEstudio observacional, analítico de una cohorte retrospectiva de un centro, comparada con una cohorte externa (marzo 2020 a agosto 2021).
ÁmbitoDos unidades de cuidados intensivos (UCI).
PacientesPacientes con neumonía por síndrome respiratorio agudo grave (SARS-COV-2) y VNI>24 h (154 y 229 en cada cohorte).
IntervencionesRegresión logística para la detección de factores de riesgo de fracaso de VNI en una cohorte de entrenamiento, y elaboración de nomograma para identificar el riesgo de fracaso de VNI. Validación mediante el test de Hosmer-Lemeshow (HL), curva de calibración y área bajo la curva (AUC). Validación externa mediante el AUC.
Variables de interés principalesDemográficas, comorbilidades, scores de severidad, configuración de VNI, constantes vitales, gasométricas y oxigenación al inicio 24 h de VNI, fracaso de VNI.
ResultadosEl fracaso de VNI fue del 37,6% y 18% en la cohorte de entrenamiento y validación respectivamente. Los factores relacionados con el fracaso de VNI fueron edad, obesidad, seguential organ failure assessment (SOFA) al ingreso y, frecuencia cardiaca (FC) y acidosis, consciencia, oxigenación y frecuencia respiratoria (HACOR) 24 h post-VNI. El test HL del modelo resultó de 0.861, con AUC 0.89 (intervalo confianza [IC] 0.839−0.942). AUC de validación externa 0.547 (CI 0.449−0.645)
ConclusionesUn modelo predictivo utilizando edad, obesidad, SOFA score y, FC y HACOR a las 24 h predice el fallo de VNI en nuestros pacientes con COVID-19, pero podría no aplicarse a otras UCIs.
Coronavirus disease 2019 (COVID-19) is caused by the severe acute respiratory syndrome coronavirus 2 (SARS-CoV-2). More than 670 million people suffer from this disease worldwide, of whom nearly seven million are expected to die.1 Intensive care units (ICUs) have been used to manage patients with severe forms of the disease. Initial data from China suggested that between 5% and 32% of infected patients required admission to the ICU,2,3 and 95% received ventilatory support.4
In cases of severe SARS-CoV-2 pneumonia (CAP), the use of non-invasive ventilation (NIV) was initially discouraged in various recommendations.5–8 In contrast, the National Health Service (NHS) of the United Kingdom proposed the use of NIV with continuous positive airway pressure (CPAP) as the first mode of ventilatory support for patients with COVID-19 pneumonia.9 Despite this controversy, several studies on patients with hypoxemia have reported a reduction in orotracheal intubation (OTI) after NIV. These results support the use of NIV during the pandemic.10,11 However, late OTI after NIV failure is associated with increased mortality.12 Therefore, it seems reasonable to identify the correct time at which patients would benefit from safe intubation. However, the parameters to identify patients with high risk of NIV failure is unknown.
Predictive modeling of NIV failure would help in decision-making. This would help avoid excessive exposure to NIV and delay in OTI and its prognostic consequences. The main objective of this study was to develop and validate a predictive model for the risk of NIV failure in patients with severe SARS-CoV-2 CAP admitted to the ICU.
Patients and methodsStudy design and ethical aspectsWe conducted an observational, analytical, and retrospective study in the ICU of two hospitals in Spain (Hospital Universitario Doctor Peset de Valencia and Hospital General Universitario de Castellon) between March 2020 and August 2021. This study was approved by the Ethics Committee of Hospital Universitario Doctor Peset of Valencia (code 66/20). Given the characteristics of this study, the requirement for informed consent was waived.
PatientsPatients with a confirmed final diagnosis of COVID-19 and CAP who received NIV for at least 24 h in the ICU were included. A confirmed case was considered following a positive result in the real-time polymerase chain reaction test for coronavirus in a sample obtained from the nasopharyngeal exudate, tracheal aspirate, and/or bronchoaspirate. CAP was defined as the presence of fever >38 °C, cough, dyspnea or tachypnea (respiratory rate [RR] >30 bpm), and hypoxemia (transcutaneous oxygen saturation [SatO2] <90% or partial pressure of oxygen/inspired fraction of oxygen ratio [PaO2/FiO2] <300) and/or chest radiographic infiltrate.13 The exclusion criteria were as follows: 1) do-not intubate order, 2) diagnosis at the end of admission different from CAP COVID-19; 3) invasive mechanical ventilation (IMV) or high-flow nasal oxygen therapy (HFNC) as first support, and 4) duration of NIV of < 24 h.
At admission, patients were considered for OTI and direct IMV if they were admitted with a low Glasgow coma scale score (GCS) <8, significant respiratory distress, and episodes of apnea or extreme desaturation. For those evaluated for NIV initiation, the first-choice ventilators were the specific BiPAP V60® NIV ventilators (Respironics Inc, Pennsylvania, USA), and the CPAP level considered for the initiation of therapy was 10–15 cmH2O. FiO2 was adjusted to achieve a minimum SatO2 of 92–94%. NIV was administered continuously for the first 24 h, with minimal interruption of oral medication and fluid intake, and was considered successful if OTI was avoided and the patient was discharged to the hospital ward alive and did not require NIV again. Gold-nasal interfaces were used for the most part and were replaced by others depending on the evolution, type of respiratory failure, appearance of skin lesions, and intolerance. If the patient achieved clinical and/or gasometric improvement that allowed FiO2 and CPAP levels lower than 0.5 and 10 cmH2O, the ventilator was withdrawn alternating disconnections from the HFNC, which was progressively increased in duration.
The predictive model was developed for a cohort of patients admitted to Hospital Universitario Doctor Peset, whereas the cohort of patients from Hospital General Universitario de Castellón was used for external validation.
Variables collectedDemographic data, comorbidities, setting, origin, previous chronology, previous respiratory support, severity scores, such as the Sequential Organ Failure Assessment (SOFA) score at admission, and initial NIV configuration were collected. NIV parameters, vital signs, gasometric and oxygenation data were recorded at the start of NIV and 24 h after initiation. The respiratory rate-oxygenation index (iROX) and heart rate, acidosis, conscientiousness, oxygenation, and respiratory rate (HACOR) scores were also calculated during this period.
NIV failure was defined as the need to initiate IMV. The OTI decision was left to the discretion of the attending physician according to the clinical and gasometric criteria.
Statistical analysisFor statistical analysis, the normality of the quantitative variables was assessed using the Kolmogorov–Smirnov test. They were expressed as mean ± standard deviation or median with interquartile range, and their comparison was performed with Student's t-test or Mann–Whitney U test. Qualitative variables were expressed as frequencies (percentages) and compared using the chi-square test or Fisher's exact test. A predictive model was constructed using a multivariate binary logistic regression analysis. Initially, univariate analysis was performed on the training cohort to detect variables that had a relevant clinical association with NIV failure. Variables with p < 0.1 were finally included in the multivariate logistic regression model. Variables without statistical significance were manually eliminated by using a stepwise backward procedure until the best possible model was obtained. The relationship was expressed as odds ratio (OR) and 95% confidence interval (95% CI) and was calculated by one unit increment of each continuous variable and by the presence of a factor corresponding to a qualitative variable. The final model was expressed by a predictive equation: f (x) = 1/1 + exp (β1 × 1 + β2 × 2….), where β is the regression coefficient and X is the value of the variable that showed association in the logistic regression. The model was evaluated using the Hosmer–Lemeshow goodness-of-fit test. To analise the agreement between model predictions and real observations in the training cohort, bootstrap of 1000 resamples were set and calibration curve was created. Predictive capacity was evaluated using a receiver operating curve (ROC). Subsequently, a nomogram was constructed for decision support, using the training cohort as a reference, including the total score and percentage risk of failure. For external validation, an ROC curve was constructed by calculating the area under the curve (AUC) and 95% CI, taking as the state variable the actual NIV failure of the validation cohort and, as a contrast variable, the probability of NIV failure at 24 h, calculated using our nomogram for each of the patients in the validation cohort. The SPSS® 20.0.0 software package (Chicago, IL, USA) and RStudio software (version 1.2.5019) were used, and a p-value < 0.05 was considered statistically significant.
ResultsA total of 154 patients were included in the training cohort during the study period. Fig. 1 shows the flowchart of these patients. The NIV failure rate in the study population was 37.6% (N = 58).

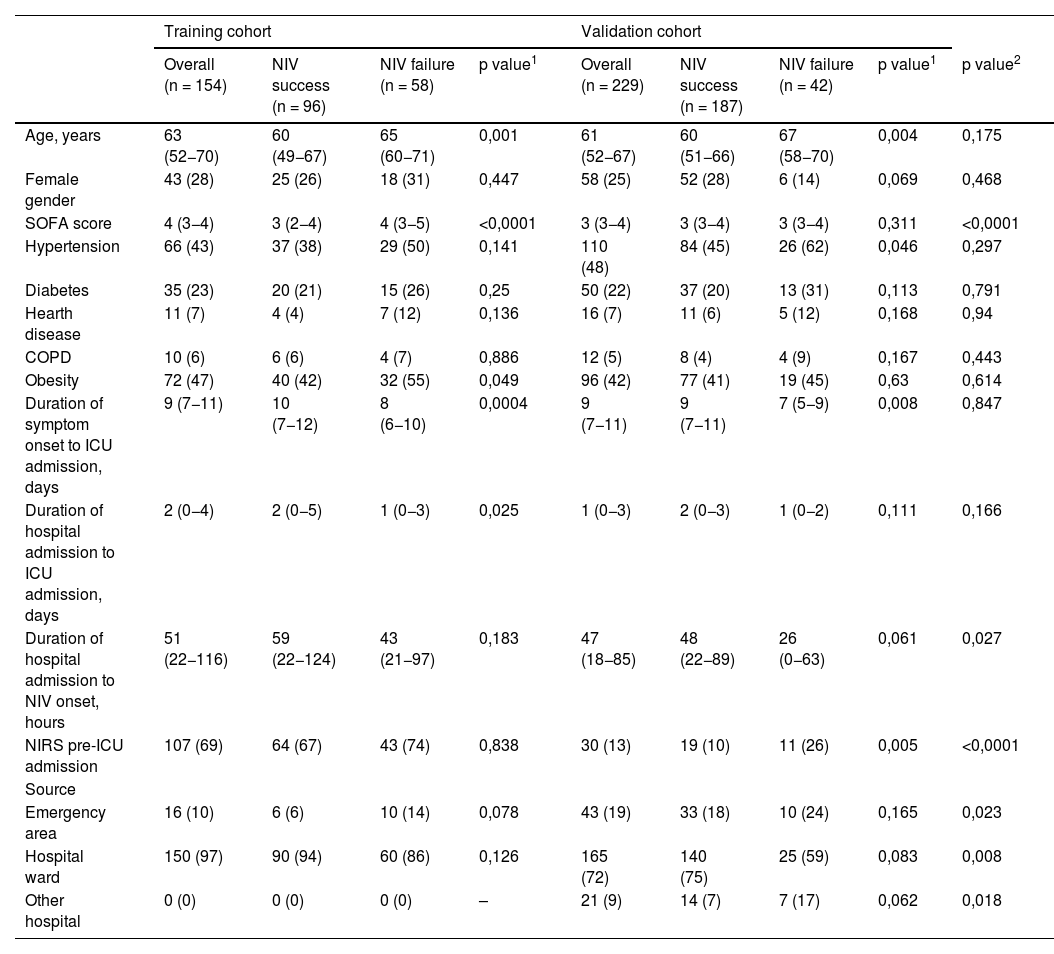
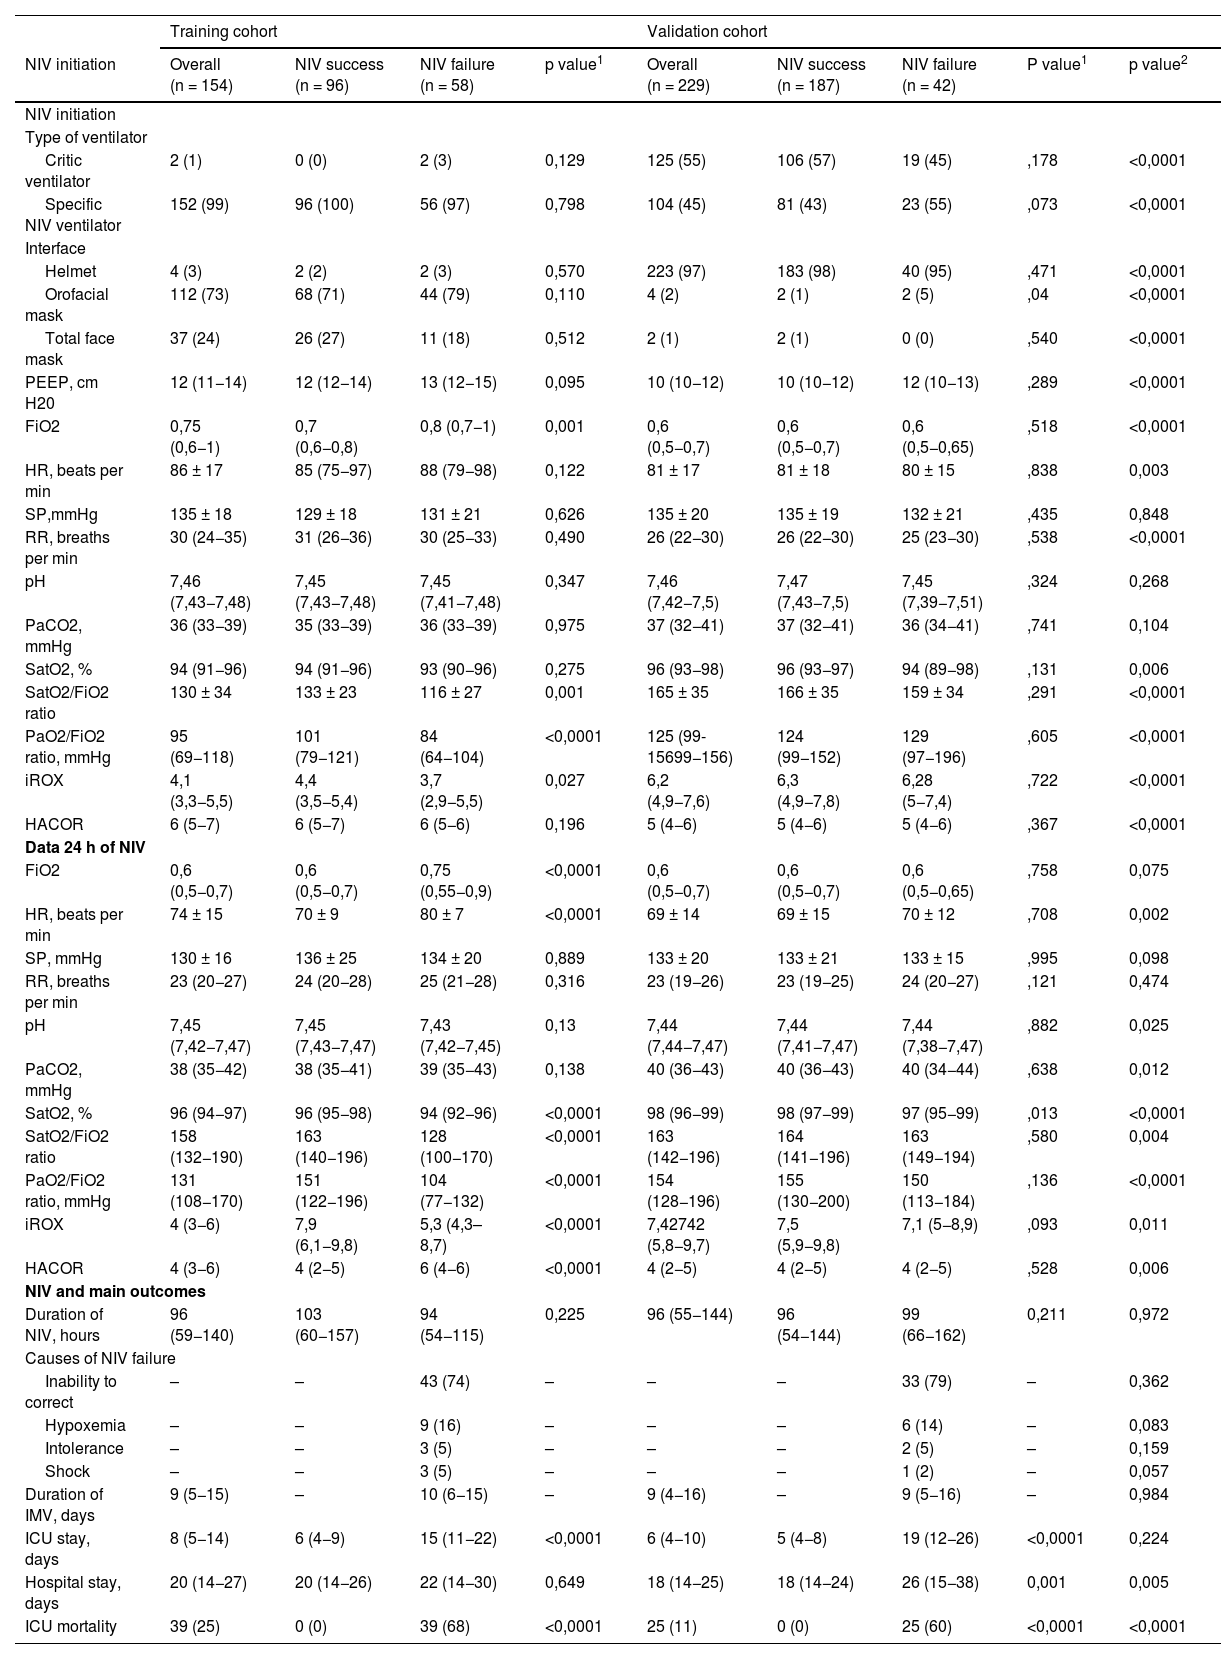
In the training cohort, the failure group presented with higher age, SOFA score, percentage of patients with obesity, days from symptom onset to ICU admission, and days from hospital admission to ICU admission (Table 1). In the NIV setting, no differences were observed between interfaces (Table 2). Upon ICU admission, the failure group required a higher FiO2 and presented more deteriorated SatO2/FiO2, PaO2/FiO2, and iROX values than did the success group (Table 2); moreover, at 24 h, they presented with a higher heart rate (HR), greater need for FiO2, and lower values of SatO2, SatO2/FiO2, PaO2/FiO2, iROX, and HACOR scores (Table 2).
Chracteristics of patients with successful or failed NIV and group differences.
| Training cohort | Validation cohort | ||||||||
|---|---|---|---|---|---|---|---|---|---|
| Overall (n = 154) | NIV success (n = 96) | NIV failure (n = 58) | p value1 | Overall (n = 229) | NIV success (n = 187) | NIV failure (n = 42) | p value1 | p value2 | |
| Age, years | 63 (52−70) | 60 (49−67) | 65 (60−71) | 0,001 | 61 (52−67) | 60 (51−66) | 67 (58−70) | 0,004 | 0,175 |
| Female gender | 43 (28) | 25 (26) | 18 (31) | 0,447 | 58 (25) | 52 (28) | 6 (14) | 0,069 | 0,468 |
| SOFA score | 4 (3−4) | 3 (2−4) | 4 (3−5) | <0,0001 | 3 (3−4) | 3 (3−4) | 3 (3−4) | 0,311 | <0,0001 |
| Hypertension | 66 (43) | 37 (38) | 29 (50) | 0,141 | 110 (48) | 84 (45) | 26 (62) | 0,046 | 0,297 |
| Diabetes | 35 (23) | 20 (21) | 15 (26) | 0,25 | 50 (22) | 37 (20) | 13 (31) | 0,113 | 0,791 |
| Hearth disease | 11 (7) | 4 (4) | 7 (12) | 0,136 | 16 (7) | 11 (6) | 5 (12) | 0,168 | 0,94 |
| COPD | 10 (6) | 6 (6) | 4 (7) | 0,886 | 12 (5) | 8 (4) | 4 (9) | 0,167 | 0,443 |
| Obesity | 72 (47) | 40 (42) | 32 (55) | 0,049 | 96 (42) | 77 (41) | 19 (45) | 0,63 | 0,614 |
| Duration of symptom onset to ICU admission, days | 9 (7−11) | 10 (7−12) | 8 (6−10) | 0,0004 | 9 (7−11) | 9 (7−11) | 7 (5−9) | 0,008 | 0,847 |
| Duration of hospital admission to ICU admission, days | 2 (0−4) | 2 (0−5) | 1 (0−3) | 0,025 | 1 (0−3) | 2 (0−3) | 1 (0−2) | 0,111 | 0,166 |
| Duration of hospital admission to NIV onset, hours | 51 (22−116) | 59 (22−124) | 43 (21−97) | 0,183 | 47 (18−85) | 48 (22−89) | 26 (0−63) | 0,061 | 0,027 |
| NIRS pre-ICU admission | 107 (69) | 64 (67) | 43 (74) | 0,838 | 30 (13) | 19 (10) | 11 (26) | 0,005 | <0,0001 |
| Source | |||||||||
| Emergency area | 16 (10) | 6 (6) | 10 (14) | 0,078 | 43 (19) | 33 (18) | 10 (24) | 0,165 | 0,023 |
| Hospital ward | 150 (97) | 90 (94) | 60 (86) | 0,126 | 165 (72) | 140 (75) | 25 (59) | 0,083 | 0,008 |
| Other hospital | 0 (0) | 0 (0) | 0 (0) | – | 21 (9) | 14 (7) | 7 (17) | 0,062 | 0,018 |
Data summarised as number (%) or median (interquartile range).
COPD: chronic obstructive pulmonary disease; ICU: intensive care unit; NIRS: non-invasive respiratory support; NIV: non-invasive ventilation; SOFA score: sequential organ failure assessment score.
Vital signs, arterial blood gas parameters, treatment variables at baseline and 24 h after NIV initiation, and main variables in patients with successful or failed NIV in both cohorts.
| Training cohort | Validation cohort | ||||||||
|---|---|---|---|---|---|---|---|---|---|
| NIV initiation | Overall (n = 154) | NIV success (n = 96) | NIV failure (n = 58) | p value1 | Overall (n = 229) | NIV success (n = 187) | NIV failure (n = 42) | P value1 | p value2 |
| NIV initiation | |||||||||
| Type of ventilator | |||||||||
| Critic ventilator | 2 (1) | 0 (0) | 2 (3) | 0,129 | 125 (55) | 106 (57) | 19 (45) | ,178 | <0,0001 |
| Specific NIV ventilator | 152 (99) | 96 (100) | 56 (97) | 0,798 | 104 (45) | 81 (43) | 23 (55) | ,073 | <0,0001 |
| Interface | |||||||||
| Helmet | 4 (3) | 2 (2) | 2 (3) | 0,570 | 223 (97) | 183 (98) | 40 (95) | ,471 | <0,0001 |
| Orofacial mask | 112 (73) | 68 (71) | 44 (79) | 0,110 | 4 (2) | 2 (1) | 2 (5) | ,04 | <0,0001 |
| Total face mask | 37 (24) | 26 (27) | 11 (18) | 0,512 | 2 (1) | 2 (1) | 0 (0) | ,540 | <0,0001 |
| PEEP, cm H20 | 12 (11−14) | 12 (12−14) | 13 (12−15) | 0,095 | 10 (10−12) | 10 (10−12) | 12 (10−13) | ,289 | <0,0001 |
| FiO2 | 0,75 (0,6−1) | 0,7 (0,6−0,8) | 0,8 (0,7−1) | 0,001 | 0,6 (0,5−0,7) | 0,6 (0,5−0,7) | 0,6 (0,5−0,65) | ,518 | <0,0001 |
| HR, beats per min | 86 ± 17 | 85 (75−97) | 88 (79−98) | 0,122 | 81 ± 17 | 81 ± 18 | 80 ± 15 | ,838 | 0,003 |
| SP,mmHg | 135 ± 18 | 129 ± 18 | 131 ± 21 | 0,626 | 135 ± 20 | 135 ± 19 | 132 ± 21 | ,435 | 0,848 |
| RR, breaths per min | 30 (24−35) | 31 (26−36) | 30 (25−33) | 0,490 | 26 (22−30) | 26 (22−30) | 25 (23−30) | ,538 | <0,0001 |
| pH | 7,46 (7,43−7,48) | 7,45 (7,43−7,48) | 7,45 (7,41−7,48) | 0,347 | 7,46 (7,42−7,5) | 7,47 (7,43−7,5) | 7,45 (7,39−7,51) | ,324 | 0,268 |
| PaCO2, mmHg | 36 (33−39) | 35 (33−39) | 36 (33−39) | 0,975 | 37 (32−41) | 37 (32−41) | 36 (34−41) | ,741 | 0,104 |
| SatO2, % | 94 (91−96) | 94 (91−96) | 93 (90−96) | 0,275 | 96 (93−98) | 96 (93−97) | 94 (89−98) | ,131 | 0,006 |
| SatO2/FiO2 ratio | 130 ± 34 | 133 ± 23 | 116 ± 27 | 0,001 | 165 ± 35 | 166 ± 35 | 159 ± 34 | ,291 | <0,0001 |
| PaO2/FiO2 ratio, mmHg | 95 (69−118) | 101 (79−121) | 84 (64−104) | <0,0001 | 125 (99-15699−156) | 124 (99−152) | 129 (97−196) | ,605 | <0,0001 |
| iROX | 4,1 (3,3−5,5) | 4,4 (3,5−5,4) | 3,7 (2,9−5,5) | 0,027 | 6,2 (4,9−7,6) | 6,3 (4,9−7,8) | 6,28 (5−7,4) | ,722 | <0,0001 |
| HACOR | 6 (5−7) | 6 (5−7) | 6 (5−6) | 0,196 | 5 (4−6) | 5 (4−6) | 5 (4−6) | ,367 | <0,0001 |
| Data 24 h of NIV | |||||||||
| FiO2 | 0,6 (0,5−0,7) | 0,6 (0,5−0,7) | 0,75 (0,55−0,9) | <0,0001 | 0,6 (0,5−0,7) | 0,6 (0,5−0,7) | 0,6 (0,5−0,65) | ,758 | 0,075 |
| HR, beats per min | 74 ± 15 | 70 ± 9 | 80 ± 7 | <0,0001 | 69 ± 14 | 69 ± 15 | 70 ± 12 | ,708 | 0,002 |
| SP, mmHg | 130 ± 16 | 136 ± 25 | 134 ± 20 | 0,889 | 133 ± 20 | 133 ± 21 | 133 ± 15 | ,995 | 0,098 |
| RR, breaths per min | 23 (20−27) | 24 (20−28) | 25 (21−28) | 0,316 | 23 (19−26) | 23 (19−25) | 24 (20−27) | ,121 | 0,474 |
| pH | 7,45 (7,42−7,47) | 7,45 (7,43−7,47) | 7,43 (7,42−7,45) | 0,13 | 7,44 (7,44−7,47) | 7,44 (7,41−7,47) | 7,44 (7,38−7,47) | ,882 | 0,025 |
| PaCO2, mmHg | 38 (35−42) | 38 (35−41) | 39 (35−43) | 0,138 | 40 (36−43) | 40 (36−43) | 40 (34−44) | ,638 | 0,012 |
| SatO2, % | 96 (94−97) | 96 (95−98) | 94 (92−96) | <0,0001 | 98 (96−99) | 98 (97−99) | 97 (95−99) | ,013 | <0,0001 |
| SatO2/FiO2 ratio | 158 (132−190) | 163 (140−196) | 128 (100−170) | <0,0001 | 163 (142−196) | 164 (141−196) | 163 (149−194) | ,580 | 0,004 |
| PaO2/FiO2 ratio, mmHg | 131 (108−170) | 151 (122−196) | 104 (77−132) | <0,0001 | 154 (128−196) | 155 (130−200) | 150 (113−184) | ,136 | <0,0001 |
| iROX | 4 (3−6) | 7,9 (6,1−9,8) | 5,3 (4,3–8,7) | <0,0001 | 7,42742 (5,8−9,7) | 7,5 (5,9−9,8) | 7,1 (5−8,9) | ,093 | 0,011 |
| HACOR | 4 (3−6) | 4 (2−5) | 6 (4−6) | <0,0001 | 4 (2−5) | 4 (2−5) | 4 (2−5) | ,528 | 0,006 |
| NIV and main outcomes | |||||||||
| Duration of NIV, hours | 96 (59−140) | 103 (60−157) | 94 (54−115) | 0,225 | 96 (55−144) | 96 (54−144) | 99 (66−162) | 0,211 | 0,972 |
| Causes of NIV failure | |||||||||
| Inability to correct | – | – | 43 (74) | – | – | – | 33 (79) | – | 0,362 |
| Hypoxemia | – | – | 9 (16) | – | – | – | 6 (14) | – | 0,083 |
| Intolerance | – | – | 3 (5) | – | – | – | 2 (5) | – | 0,159 |
| Shock | – | – | 3 (5) | – | – | – | 1 (2) | – | 0,057 |
| Duration of IMV, days | 9 (5−15) | – | 10 (6−15) | – | 9 (4−16) | – | 9 (5−16) | – | 0,984 |
| ICU stay, days | 8 (5−14) | 6 (4−9) | 15 (11−22) | <0,0001 | 6 (4−10) | 5 (4−8) | 19 (12−26) | <0,0001 | 0,224 |
| Hospital stay, days | 20 (14−27) | 20 (14−26) | 22 (14−30) | 0,649 | 18 (14−25) | 18 (14−24) | 26 (15−38) | 0,001 | 0,005 |
| ICU mortality | 39 (25) | 0 (0) | 39 (68) | <0,0001 | 25 (11) | 0 (0) | 25 (60) | <0,0001 | <0,0001 |
Data summarised as number (%), mean ± standard deviation or median (interquartile range).
FiO2: fraction of inspired oxygen; HR: heart rate; HACOR: heart rate, acidosis, conscienciousness, oxygenation and respiratory rate score; ICU: intensive care unit; IMV: invasive mechanical ventilation; iROX: respiratory rate-oxygenation index; NIV: non-invasive vetilation; PaCO2: partial pressure of arterial carbon dioxide; PaO2: partial pressure of arterial oxygen; PEEP: positive end-expiratory pressure; RR: respiratory rate; SatO2: blood oxygen saturation; SP sistolic pressure.
In total, 229 patients who met the inclusion criteria during the study period were included in the validation cohort. NIV failure occurred in 42(18%) patients. A comparison of the two cohorts revealed that the validation cohort had a lower SOFA score, shorter time from hospital admission to the initiation of NIV, less use of non-invasive respiratory therapy (NIRT) prior to ICU admission, and a higher proportion of patients admitted to the emergency department (Table 1). Critical ventilators and helmets were frequently used (Table 2). Regarding oxygenation status, it should be noted that patients in the validation cohort were less hypoxemic, as measured by SatO2, SatO2/FiO2, PaO2/FiO2, iROX, and HACOR both on admission and at 24 h (Table 2). ICU mortality in the training and validation cohorts occurred in 39(25%) and 25(11%) patients, respectively, and was higher in the NIV failure group than in the NIV success group in both cohorts ([68% vs. 0%; p < 0.0001] and [60% vs. 0%; p < 0.0001, respectively]) (Table 2).
Multivariate logistic regression analysis revealed that the factors independently associated with NIV failure were higher age, high SOFA score at admission, obesity, elevated HR at 24 h, and high HACOR score at 24 h (Appendix A; Table A1). The model explained 58.7% (Nagelkerke R-squared) of the variation in failure outcomes. A goodness-of-fit test was performed to compare the observed and expected data with the model, demonstrating that there were no differences, with a Hosmer–Lemeshow test result of chi-square = 1.97 and p = 0.961. Calibration curve shows a good fit between the actual and predicted probability shows the curve calibration of our predictive model (Appendix A, Fig. A2).
Based on the final model, a nomogram was constructed using the weights of each model variable associated with NIV failure (Fig. 2). The probability of NIV failure was calculated using equation (1):
.")
Nomogram to predict NIV failure in patients with SARS-CoV-2 pneumonia. (HR: heart rate; HACOR: heart rate, acidosis, conscienciousness, oxygenation and respiratory rate score; ICU: intensive care unit; NIV: non-invasive ventilation; SOFA: sequential organ failure assessment score).
The Supplementary Material (Appendix A, Fig. A1) describes how the nomogram can be used to determine the probability of NIV failure.
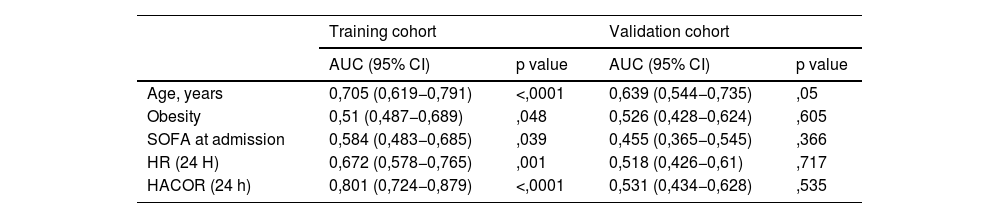
The predictive ability of the model was satisfactory in the training cohort, with an AUC of 0.89 (95% CI: 0.839–0.942, p < 0.0001) (Fig. 3A), which was superior to that of each of the model variables separately (Table 3). However, the AUC of the validation cohort was 0.547 (0.449–0.645, p = 0.346) (Fig. 3B).

AUC for variables model in the training and validation model.
| Training cohort | Validation cohort | |||
|---|---|---|---|---|
| AUC (95% CI) | p value | AUC (95% CI) | p value | |
| Age, years | 0,705 (0,619−0,791) | <,0001 | 0,639 (0,544−0,735) | ,05 |
| Obesity | 0,51 (0,487−0,689) | ,048 | 0,526 (0,428−0,624) | ,605 |
| SOFA at admission | 0,584 (0,483−0,685) | ,039 | 0,455 (0,365−0,545) | ,366 |
| HR (24 H) | 0,672 (0,578−0,765) | ,001 | 0,518 (0,426−0,61) | ,717 |
| HACOR (24 h) | 0,801 (0,724−0,879) | <,0001 | 0,531 (0,434−0,628) | ,535 |
Data summarised as odds ratio (OR) and 95% confidence interval (CI).
HACOR: heart rate, acidosis, conscienciousness, oxygenation and respiratory rate score; HR: heart rate; SOFA: sequential organ failure assessment score.
In this study, a nomogram was developed to predict the failure of NIV in patients with COVID-19. It is based on age, obesity, SOFA score at admission, and HR and HACOR scores at 24 h. Patients who failed NIV had higher mortality; therefore, it is important to recognize an early failure of NIV and select those who would benefit from escalating ventilatory support. To simplify and quickly apply the model, analytical variables were not included. The predictive capacity of the model was assessed with the Hosmer–Lemeshow test, the calibration curve and by calculating the AUC on an ROC curve, which reinforces the internal strength of our model.
The training cohort presented an NIV failure rate of 37.6%, which is within the range of 29%–53% reported in different studies.14–16 However, the rate of failure in the validation cohort was 18%, which was lower than that reported for patients with COVID-19 in the ICU. This difference could be attributed to the lower severity level in the validation cohort and patients being admitted at earlier disease stages, thus requiring less prior NIRT. Moreover, majority of patients in the validation cohort were administered NIV via a Helmet, an interface linked to lower NIV failure and mortality rates compared with that of the oronasal mask.17
A retrospective observational study conducted across 23 Chinese hospitals, including non-ICU patients treated with NIV or HFNC, developed a predictive model for NIRT failure risk.18 This model incorporated age, comorbidity count, oxygenation index, the GCS score, and vasopressor usage; however, unlike ours, it only included variables at ICU admission. The value of our model lies in its utility for patients who have completed 24 h of support with NIV, suggesting an evaluation after a longer trial period than initially recommended in the early stages of the pandemic.5 We believe that this aspect fills a gap in the available literature.
Age determines the prognosis of these patients19 and is a risk factor for NIV failure in both patients with COVID-1915,20–22 and acute respiratory distress syndrome (ARDS).23,24
Obesity is associated with NIV failure in patients with COVID-1920 and influenza.25 It is assumed that patients with obesity tolerate higher levels of positive end-expiratory pressure (PEEP), with an improvement in the expiratory flow limitation experienced by these patients.26 Although we could not measure the transpulmonary pressure (Ptp), we managed the undetected elevated Ptp, indicating the need for high levels of PEEP. However, there was likely incorrect adherence to the sitting position, related to reducing the diaphragmatic load on the lungs and airflow limitation.26
The SOFA score on admission is a risk factor for NIV failure in patients with ARDS of any etiology or COVID-19.21,27 The training cohort was conditioned by the respiratory component since most patients had no other organ failure. This parameter allowed us to consider that patients with only respiratory failure would be candidates for initiating support with NIV, as suggested for patients with influenza.25
The fourth risk factor identified was HR at 24 h. The nomogram by Liu et al. showed the same result as ours in the univariate analysis, without confirmation in the multivariate analysis.18 We hypothesized that patients with a higher HR have higher tissue O2 demand and consumption.
The last factor included in our model was the HACOR score, which incorporated HR, GCS, RR, PaO2/FiO2, and Ph.28 Its usefulness has been demonstrated in the prediction of NIV failure (cutoff point of 5) in patients with acute respiratory failure.29–31 The novelty of the results from the training cohort is that the HACOR score was identified as a risk factor at a more advanced stage (24 h). It can be concluded that the HACOR score is a reference scale for the detection of possible NIV failure, extending its usefulness up to 24 h after initiation.
Regarding the equipment used in the training cohort, no risk factors were identified in the univariate analysis. It is important to focus on two issues. First, the small number of patients in whom a helmet was used in our series, despite the results of the study by Grieco et al.14 Considering that patients undergo prolonged periods of NIV and that the helmet is better tolerated with fewer lesions on the bridge of the nose,32 it serves as a viable starting point. In favor of this position is the low failure rate of the validation cohort, in which helmets were widely used. Second, not all data were available to analyze the use of active humidification as a risk factor. This is listed as optional during NIV in the humidification guidelines for IMV and NIV, discouraging the use of heat-humidity exchangers during NIV.33 The use of a heated humidifier (HH) improves adaptation and secretion clearance, compared with a heat and moisture exchanger.34 In addition, Esquinas et al. found that 50% of the patients who were labeled as having difficult OTI after NIV failure did not receive HH, resulting in thick and dry secretions which were a probable reason for failure.35 Although this was not a part of our analysis, it could be suggested that HH use be started at the beginning of NIV support.
The nomogram did not have a good predictive capacity in the validation cohort. This result is striking given that both cohorts were managed in units with a clear preference for the use of NIRT as initial support. There are different reasons why an external validation process can be difficult: differences between participating clinicians, populations included, and interventions performed,36 an issue that seems to be observed in our training and validation cohorts (lower severity and greater use of helmets). This reflection should be more profound, but it highlights the importance of validating the proposed predictive model at a local level.
We think it would be questionable the usefulness of external validation of a predictive model for NIV failure. The decision for OTI is complex, arbitrary, individualized, intuitive, and the criteria for patients with hypoxemia have not been clearly established, with great variability between different studies.37 This leads us to believe that the same patient could receive OTI at different times (and even avoid OTI), depending on the department to which the patient is admitted. Furthermore, in a review of 14 studies, it was observed that the protocol for the initiation of IMV after NIV did not affect the intubation rate,38 questioning the usefulness of establishing criteria for NIV failure in hypoxemic patients. In addition, only a small percentage of patients received OTI within 3 h of meeting the previously established NIV failure criteria,39 and even when these criteria were met, a high percentage of patients avoided OTI.40 The criteria for OTI likely differed between the two cohorts. This supports the idea that, in establishing a predictive model, it is possible that this would not be a representation of patient status but rather reflect the decision of the responsible clinicians.
Limitations of the studyOur study has some important limitations. First, given the retrospective nature of the study and the workload during the pandemic, some important variables were not collected and analyzed for inclusion in the model. Esophageal pressure changes were not monitored, and the tidal volume developed during NIV, which could be related to the occurrence of self-inflicted lung injury in patients, was not collected. Second, the training cohort was from a single center and included a relatively small number of patients. The validity of the model should be evaluated in a larger population. It is important to note, our results preclude conclusions about the benefit of early IOT in patients under NIV. The study was conducted during the pandemic, when the availability of ICU beds varied over time, which may have influenced the criteria for ICU admission and the selection of patients to receive OTI. Finally, our nomogram would only be useful for assessing NIV failure at 24 h. It may not be used for later stages of the disease.
Our nomogram is a simple tool that can be used to predict the risk of NIV failure in patients with COVID-19. These patients may benefit from close monitoring. However, extrapolation of our findings to patients managed in other ICUs may not be useful. The study findings open avenues for further research and adaptation in diverse clinical environments.
CRediT authorship contribution statementHéctor Hernández: Conceptualization, Methodology, Formal analysis, Investigation, Data curation, Writing-original draft, Writing-review & editing, Visutalization, Project administration. Alberto Belenguer: Conceptualization, Methodology, Investigation, Data curation, Writing-review & editing, Formal analysis. Francisco Bernal: Investigation, Writing-original draft, Data curation. Irina Hermosilla: Investigation, Writing-original draft, Data curation. Lluis Tormo: Investigation, Writing-original draft, Data curation. Estefanía Granero: Investigation, Writing-original draft, Data curation. Clara Viana: Investigation, Writing-original draft, Data curation. Rafael Zaragoza: Conceptualization, Methodology, Writing-review & editing, Visualization, SUupervision.
FundingThis research did not receive any specific grant from funding agencies in the public, commercial, or not-for-profit sectors.
The following are Supplementary data to this article: