

To compare the measurement of antimicrobial consumption by defined daily dose (DDD) versus by days of therapy (DOT).
DesignRetrospective analysis of clinical and administrative data from patients admitted to a polyvalent ICU.
SettingICU at a University Hospital in Spain.
PatientsAll patients admitted to the ICU.
InterventionsNone.
Main variables of interestFor the DDD method, the World Health Organization (WHO)-assigned DDD was determined for the all the prescribed antimicrobials. For the DOT method, one DOT represented the administration of a single agent on a given day regardless of the number of doses administered. To express aggregate use, total DDDs and total DOTs were normalized to 100 patient-days.
ResultsDuring the study period, 2393 adult patients were admitted to the ICU. Total median antimicrobial drugs measured by DDDs was 535.3 (IQR 319.8–845.5) vs. 344.0 (IQR 117.2–544.5) when measured by DOTs, p<0.001. When antimicrobial consumption was normalized to 100 patient-days, median antimicrobial consumption was also higher when measured by DDDs [2.98/100 patient-days (IQR 1.76–5.25) vs. 1.89/100 patient-days (IQR 0.64–3.0) when measured by DOTs, p<0.001].
ConclusionsFor most antibacterial and antifungal drugs used in critically ill patients, estimates of aggregate antibiotic use by DDDs per 100 patient-days and DOTs per 100 patient-days are discordant because the administered dose is dissimilar from the WHO-assigned DDD. DOT methods should be recommended to avoid the overestimation that occurs with DDDs in adult critically ill patients.
Comparar la medición del consumo de antimicrobianos por dosis diarias definidas (DDD) y por días de tratamiento (DOT).
DiseñoAnálisis retrospectivo de datos clínicos y administrativos de los pacientes ingresados en una unidad de cuidados intensivos (UCI) polivalente.
ÁmbitoLa UCI de un hospital universitario de España.
PacientesTodos los pacientes ingresados en la UCI.
IntervencionesNinguna.
Principales variables de interésSe determinó la DDD asignada por la Organización Mundial de la Salud (OMS) para todos los antimicrobianos prescritos. La DOT representó los días de utilización de cada antimicrobiano independientemente del número de dosis administradas cada día. Las DDD totales y los DOT totales se normalizaron por cada 100 estancias.
ResultadosDurante el período de estudio, 2.393 pacientes adultos ingresaron en la UCI. La mediana de los antimicrobianos medidos por DDD fue de 535,3 (RIQ: 319,8-845,5) frente a 344,0 (RIQ: 117,2-544,5) cuando se midió mediante DOT; p<0,001. Cuando el consumo de antimicrobianos se normalizó por 100 estancias, el consumo de antimicrobianos también fue mayor cuando se midió con DDD (2,98/100 estancias [RIQ: 1,76-5,25] vs. 1,89/100 estancias [RIQ: 0,64-3,0] cuando se midió por DOT; p<0,001).
ConclusionesPara la mayoría de los antimicrobianos utilizados en la UCI, el consumo global y medido por DDD/100 estancias y DOT/100 estancias son discordantes porque la dosis administrada es diferente de la DDD asignada por la OMS. Se debe recomendar la utilización de las DOT para evitar la sobreestimación que se produce con las DDD en pacientes adultos críticamente enfermos.
The use of antimicrobials is frequently associated with the appearance of resistant strains of microorganisms.1,2 Therefore, it is important to use antibiotics appropriately to avoid increases in antimicrobial resistance and improve patient outcomes.3–6 In order to promote rational use, antimicrobial consumption must to be measured and trends in consumption must also be monitored.7 Hospitals need reliable methods to determine their consumption of antibiotics and to compare it with consumption at other centers.8–12 Knowledge of the consumption of antibiotics in hospitals and in the ICU is one of the main pillars in the guidelines to enhance antimicrobial stewardship programs.13,14
The best method to quantify the use of antibiotics has yet to be defined. Antibiotic consumption is usually measured by calculating aggregated ratios on their use with the aim of enabling comparative evaluations. These ratios mainly include one of two reference units: the defined daily dose (DDD) or the days of therapy (DOT). Currently there is also other method to measure the consumption of antibiotics that is the prescribed daily dose (PDD) but that has the difficult to measure without a computerized system at the patient level.7
The DDD of a determinate antimicrobial is determined annually by the World Organization of Health (WHO); this unit represents the assumed average maintenance dose per day for a drug used for its main indication in adults.15 On the other hand, the DOT represents the days of antibiotic therapy administered to a patient, regardless of the number of doses administered or dosage strength.16
Using the DDD to measure the consumption of antimicrobials in hospitals is problematic. For many, but not all, parenteral drugs, the WHO sets the DDD at relatively low doses that often do not reflect dosages usually prescribed for hospitalized adults. Different studies found that the DDD format overestimated true prescription practice by 40–53%.17–19 Moreover, the DDD may be especially inappropriate in intensive care units (ICU). In critically ill patients, drastic derangements in physiological parameters can have large effects on the pharmacokinetics of antimicrobials, often requiring modify the doses administered.20 Therefore, using the DDD will lead to errors in the measurement of the consumption of antibiotics in ICUs.
The other recommended method to measure the consumption of antimicrobials, the DOT is easy to apply in settings where prescriptions are recorded at the individual level.17,21–23 Nevertheless, DOTs also have limitations, mainly derived from the calculations in patients undergoing therapy with more than one antibiotic.
Our hypothesis is that, given the differences between DDD and the doses of antimicrobials used in critical patients, the DDD method overestimates the consumption of antibiotics, especially in these patients, and for this reason we designed this study with the objective of measuring aggregate consumption of antibiotics in an ICU of a university hospital with DDD and DOT methods, to contrast these measures and confirm the differences between both methods.
Patients and methodsStudy populationThis was a retrospective analysis of clinical and administrative data from all adult patients admitted to a polyvalent ICU at a university hospital in Spain between 1 February 2013 and 30 September 2016. The hospital's ethics committee approved the study and waived the need for informed consent due to the observational nature of the study (2019/536).
Data abstraction and definitionsTrained research physicians collected data, patients’ severity at admission (measured by the APACHE II score24), and the administered antimicrobial drugs (obtained from pharmacy unit-dose records for individual patients admitted between 1 February 2013 and 30 September 2016). We analyzed the pharmacy department's daily record of the consumption of antibiotics and antifungals and the daily admission and ICU stays of included patients. When an antimicrobial was available in both oral and parenteral forms, the sum for both routes of administration was recorded. Aggregated annualized data included the route of administration, the number of patients treated, the total DOTs, the number of doses administered, and the total grams administered.
DDD method. To estimate antimicrobial use using the DDD method, the total number of grams of each drug used during the period of study were summed and divided by the WHO-assigned DDD. Dividing total grams of use by the DDD (grams/day) yields an estimate of the number of days of antimicrobial therapy. All DDDs were based on the 2016 version of the Anatomical Therapeutic Chemical Classification System and the DDD index.15 To express aggregate use, total DDDs were normalized per 100 patient-days.
DOT method. To estimate antibiotic use using the DOT method, one DOT represented the administration of a single agent on a given day, regardless of the number of doses administered or dosage strength. A single patient receiving two antimicrobial drugs would be recorded as receiving 2 DOTs (1 for each drug administered) and so on according to the number of antimicrobials received daily. To express aggregate use, total DOTs were normalized to 100 patient-days.
Statistical analysisContinuous data are expressed as median (interquartile range; IQR). To compare DDD vs. DOT values, we used the Wilcoxon signed-rank test on absolute values and values normalized to 100 patient-days because these variables were not normally distributed. p-Values<0.05 were considered statistically significant. We used correlation analysis to graphically examine the relationship between DDDs per 100 patient-days and DOTs per 100 patient-days for total antimicrobial drug use. The null hypothesis was that there is no difference in estimates of antimicrobial drug use by DDD and DOT. The difference between mean DDD and DOT was calculated by the following expression: (DDD−DOT)/DDD×100. We classified the magnitude of the differences between mean DDDs per 100 patient-days and DOTs per 100 patient-days as “major” (>25% difference), “moderate” (≥5% and <25% difference), or “minor” (<5% difference).16 SPSS 25.0 (IBM Corp; Armonk, NY, USA) was used for all statistical analyses.
ResultsDuring the study period, 2393 adult patients (mean age, 62±15 years; mean APACHE II score at admission, 14±2) were admitted to the ICU, representing 18,126 patients-days. The diagnosis of admission was acute respiratory failure (22.5%), neurological diseases (21.7%), sepsis/septic shock (18.6%), cardiovascular diseases (16.5%), polytrauma (12.8%), and others (7.9%).
Total median antimicrobial drug use measured by DDDs was 535.3 (IQR 319.8–845.5) vs. 344.0 (IQR 117.2–544.5) when measured by DOTs, p<0.001. Global antimicrobial use was 36.7% higher when measured by DDD than by DOT. Median consumption normalized to 100 patient-days was higher when calculated by DDD [2.98 (IQR 1.76–5.25)/100 patient-days] vs. [1.89 (IQR 0.64–3.0)/100 patient-days] when calculated by DOT, p<0.001. The correlation analysis of antimicrobial drug use per 100 patient-days found these two measures were significantly different (p<0.001) (Fig. 1).
 per 100 patient-days and days of therapy (DOTs) per 100 patient-days (p<0.001).")
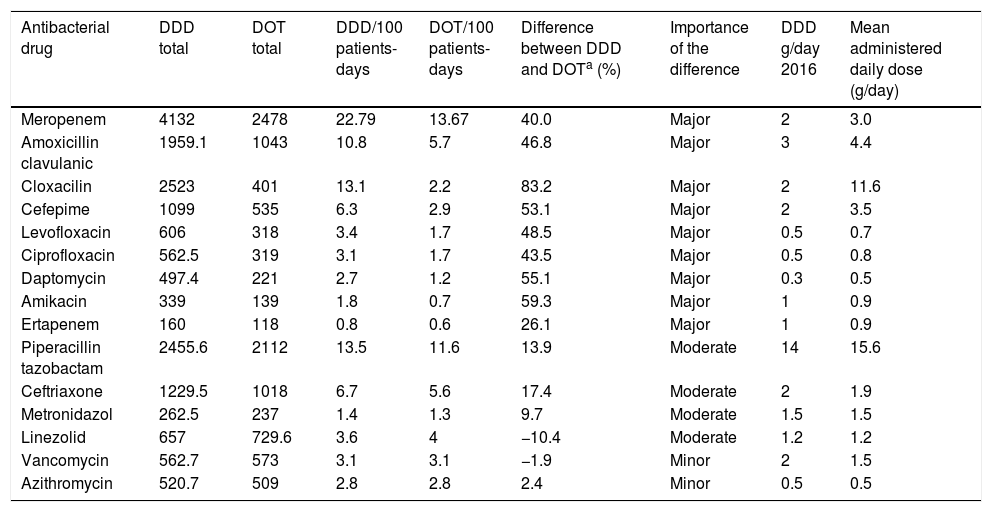
In the 15 most commonly used antibacterial drugs, the difference between DDDs and DOTs was major in 9 (60%), moderate in 4 (26.6%), and minor in 2 (13.3%) (Table 1). The mean administered daily doses for 46.6% of these drugs were higher than the WHO's DDD recommendations. The greatest differences between DDDs and DOTs were found for cloxacillin, amikacin, cefepime, and daptomycin. The smallest differences between DDDs and DOTs were found for antibacterial drugs usually administered once or twice per day that have limited ranges of daily dosage, such as azithromycin and vancomycin.
Comparison between DDD and DOT and aggregate drug use by DDD per 100 patient-days and DOT per 100 patient-days for 15 common antibacterial drugs.
| Antibacterial drug | DDD total | DOT total | DDD/100 patients-days | DOT/100 patients-days | Difference between DDD and DOTa (%) | Importance of the difference | DDD g/day 2016 | Mean administered daily dose (g/day) |
|---|---|---|---|---|---|---|---|---|
| Meropenem | 4132 | 2478 | 22.79 | 13.67 | 40.0 | Major | 2 | 3.0 |
| Amoxicillin clavulanic | 1959.1 | 1043 | 10.8 | 5.7 | 46.8 | Major | 3 | 4.4 |
| Cloxacilin | 2523 | 401 | 13.1 | 2.2 | 83.2 | Major | 2 | 11.6 |
| Cefepime | 1099 | 535 | 6.3 | 2.9 | 53.1 | Major | 2 | 3.5 |
| Levofloxacin | 606 | 318 | 3.4 | 1.7 | 48.5 | Major | 0.5 | 0.7 |
| Ciprofloxacin | 562.5 | 319 | 3.1 | 1.7 | 43.5 | Major | 0.5 | 0.8 |
| Daptomycin | 497.4 | 221 | 2.7 | 1.2 | 55.1 | Major | 0.3 | 0.5 |
| Amikacin | 339 | 139 | 1.8 | 0.7 | 59.3 | Major | 1 | 0.9 |
| Ertapenem | 160 | 118 | 0.8 | 0.6 | 26.1 | Major | 1 | 0.9 |
| Piperacillin tazobactam | 2455.6 | 2112 | 13.5 | 11.6 | 13.9 | Moderate | 14 | 15.6 |
| Ceftriaxone | 1229.5 | 1018 | 6.7 | 5.6 | 17.4 | Moderate | 2 | 1.9 |
| Metronidazol | 262.5 | 237 | 1.4 | 1.3 | 9.7 | Moderate | 1.5 | 1.5 |
| Linezolid | 657 | 729.6 | 3.6 | 4 | −10.4 | Moderate | 1.2 | 1.2 |
| Vancomycin | 562.7 | 573 | 3.1 | 3.1 | −1.9 | Minor | 2 | 1.5 |
| Azithromycin | 520.7 | 509 | 2.8 | 2.8 | 2.4 | Minor | 0.5 | 0.5 |
Major (>25% difference), moderate (>5% and ≤25% difference), and minor (<5% difference) importance.
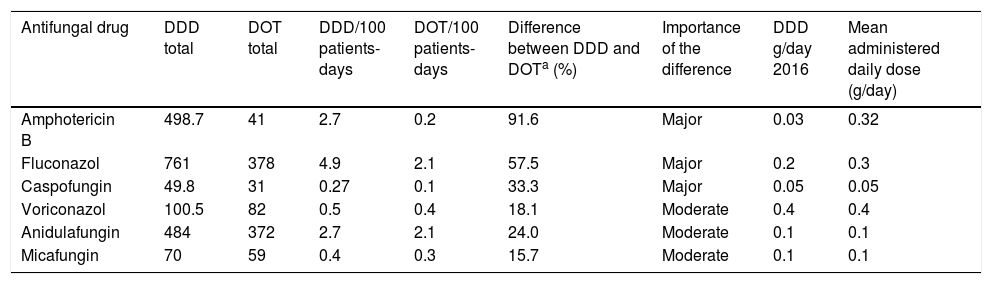
In the six antifungal drugs analyzed, the difference between DDDs and DOTs was major in 3 (50%) (Table 2), and the mean administered daily doses were 34.4% higher than the WHO's DDD recommendations. The greatest differences between DDDs and DOTs were found for amphotericin B (91.6%) and fluconazole (57.5%).
Comparison between DDDs and DOTs and aggregate drug use by DDDs per 100 patient-days and DOTs per 100 patient-days for 6 common antifungal drugs.
| Antifungal drug | DDD total | DOT total | DDD/100 patients-days | DOT/100 patients-days | Difference between DDD and DOTa (%) | Importance of the difference | DDD g/day 2016 | Mean administered daily dose (g/day) |
|---|---|---|---|---|---|---|---|---|
| Amphotericin B | 498.7 | 41 | 2.7 | 0.2 | 91.6 | Major | 0.03 | 0.32 |
| Fluconazol | 761 | 378 | 4.9 | 2.1 | 57.5 | Major | 0.2 | 0.3 |
| Caspofungin | 49.8 | 31 | 0.27 | 0.1 | 33.3 | Major | 0.05 | 0.05 |
| Voriconazol | 100.5 | 82 | 0.5 | 0.4 | 18.1 | Moderate | 0.4 | 0.4 |
| Anidulafungin | 484 | 372 | 2.7 | 2.1 | 24.0 | Moderate | 0.1 | 0.1 |
| Micafungin | 70 | 59 | 0.4 | 0.3 | 15.7 | Moderate | 0.1 | 0.1 |
Major (>25% difference), moderate (>5% and ≤25% difference), and minor (<5% difference) importance.
To our knowledge, this is the first analysis of different methods to measure antimicrobial drug use in critically ill adult patients. As in studies done in other hospital populations,17–19 the DDD system of measuring antimicrobial use overestimated the actual consumption of most antimicrobial drugs.
The main advantages of the DDD method are that it enables antimicrobial use to be compared using standardized methods across a wide number of healthcare settings and countries, because it can be used with relative ease where administrative records are less developed and where it is more feasible to count packages and vials that have been purchased or dispensed than to measure the number of days of antimicrobial therapy. The most important limitation of DDD methods is discrepancies between administered daily doses and the WHO-assigned DDD.16
The main advantages of the DOT method are that it is not influenced by changes in the DDD or by discrepancies between the administered daily doses and DDD. The most important limitation of DOT methods results is the difficulty of measurement when computerized pharmacy records are not available.16
Our results agree with those of a study in 130 American hospitals,16 where the measurements of aggregate hospital antibiotic use by DDDs per 1000 patient-days and DOTs per 1000 patient-days were discordant for many frequently used antimicrobial drugs due to differences between the administered dose and the WHO-assigned DDD. The authors concluded that DDD methods are useful for benchmarking purposes, but for many antimicrobial drugs cannot be used to make inferences about the number of DOTs or relative use.
Following this article, an editorial25 suggested that the DOT method was a good alternative to the DDD method and that the WHO International Working Group for Drug Statistics Methodology needs to revise the DDDs for many antimicrobials. It is also obvious that, DOT methods would be useful for other purposes, such as measuring antimicrobial use in other populations (e.g., pediatric or critical patients) in which the doses used are very different from the currently recommended DDDs. In this sense, the latest IDSA/SHEA guidelines for implementing an antibiotic stewardship program already suggest using the DOT method for monitoring antibiotic in preference to the DDD method.26
Our study in critical care patients found that the global antimicrobial use was 36.7% higher when measured by DDDs than when measured by DOTs, and the mean administered daily doses were greater than the DDDs in more than 40% of the antibiotics and more than 30% of the antifungals.
Although the DOT method is becoming the standard measure of antimicrobial use in the USA, there are some limitations regarding its use as a representation of drug exposure. For example, for an antimicrobial administered every other day as adjusted for renal function, the DOTs are not counted for the days between the days when the drug is administered. Thus, the DOT can underrepresent true drug exposure. Kubin et al.27 assessed the impact of accounting for drug exposure on days in- between administered renal-adjusted doses for five antibacterial drugs (ceftriaxone, piperacillin/tazobactam, vancomycin, tobramycin, and levofloxacin) for all patients, including ICU and non-ICU patients, comparing three different DOT methods: (1) the standard DOT method, counting only the actual days when antibiotics were administered; (2) counting DOT in between administered doses if the antibacterial was stopped and restored within 2 days; and (3) a custom-exposure method they developed to take into account variability in the exposure time between administered doses, depending on the specific drug-dosing guideline. When all patients were considered, the results obtained with the three approaches were similar for ceftriaxone, piperacillin/tazobactam, and levofloxacin; however, for vancomycin and tobramycin, the approaches that took in-between dosing days into account yielded higher DOTs than the standard method. When only ICU patients were considered, the differences were larger. Nevertheless, the differences between the three methods were not statistically significant.
In our study, most of the antimicrobial drugs were administered at a dosage that exceeded the WHO-assigned DDD. Our data concord with those reported by Polk et al.,16 who found a downward deviation of the correlation curve for the antibiotics that had higher DDD than DOT measures, as in our study; for example, they found that the mean dose of cefepime used was 50% greater that WHO-assigned DDD, similar to our study, where the cefepime dose measured by DOT was 53% higher than the WHO-assigned DDD.
The main limitations of our study are its retrospective design and the fact that it was done at a single center. Thus, our results should not be extrapolated to other populations admitted to hospitals with different characteristics. Nevertheless, although recommended daily doses may differ among hospitals, our local practice guidelines are similar to those applied in most ICUs and in many other areas of acute care hospitals. It should also be considered as a limitation of our study, the fact that we have only analyzed the global consumption of antimicrobials during the study period, without considering the variations in the doses due to different organic dysfunctions or the use of renal replacement techniques.
We conclude that, for most antibacterial and antifungal drugs used in critically ill patients, the measurement of aggregate antimicrobial use by DDDs per 100 patient-days and DOTs per 100 patient-days is discordant because the administered dose is dissimilar from the WHO-assigned DDD. Although not all ICUs have the pharmacy unit-dose records necessary for DOTs, DOT methods should be recommended to ensure more realistic measurement of antibacterial drug consumption and avoid the overestimation that occurs with the DDD method in adult critically ill patients.
Authors’ contributionsJordi Vallès was responsible for the design of the study, review of patient data and preparation of the article.
Samuel Fernández and Edgar Cortés contributed to the acquisition of patient data included in the study.
Anisi Morón was responsible for the pharmacy data of the patients included in the study.
Esther Fondevilla and Emili Diaz were involved in review and elaboration of the document.
Joan Carles Oliva contributed to the review and statistical analysis of the study.
FundingThis research did not receive any specific grant from funding agencies in the public, commercial, or not-for-profit sectors.
Conflict of interest statementThe authors declare no conflict of interests.

