


To determine the prevalence of elevated mechanical power (MP) values (>17J/min) used in routine clinical practice.
DesignObservational, descriptive, cross-sectional, analytical, multicenter, international study conducted on November 21, 2019, from 8:00 AM to 3:00 PM. NCT03936231.
SettingOne hundred thirty-three Critical Care Units.
PatientsPatients receiving invasive mechanical ventilation for any cause.
InterventionsNone.
Main variables of interestMechanical power.
ResultsA population of 372 patients was analyzed. PM was significantly higher in patients under pressure-controlled ventilation (PC) compared to volume-controlled ventilation (VC) (19.20±8.44J/min vs. 16.01±6.88J/min; p<0.001), but the percentage of patients with PM>17J/min was not different (41% vs. 35%, respectively; p=0.382). The best models according to AICcw expressing PM for patients in VC are described as follows: Surrogate Strain (Driving Pressure) + PEEP+Surrogate Strain Rate (PEEP/Flow Ratio) + Respiratory Rate. For patients in PC, it is defined as: Surrogate Strain (Expiratory Tidal Volume/PEEP) + PEEP+Surrogate Strain Rate (Surrogate Strain/Ti) + Respiratory Rate+Expiratory Tidal Volume+Ti.
ConclusionsA substantial proportion of mechanically ventilated patients may be at risk of experiencing elevated levels of mechanical power. Despite observed differences in mechanical power values between VC and PC ventilation, they did not result in a significant disparity in the prevalence of high mechanical power values.
Determinar la prevalencia de valores elevados de potencia mecánica (PM) (>17J/min) utilizados en la práctica clínica habitual.
Diseñoestudio observacional, descriptivo de corte transversal, analítico, multicéntrico e internacional, realizado el 21 de noviembre de 2019 en horario de 8 a 15 horas. NCT03936231.
ÁmbitoCiento treinta y tres Unidad de Cuidados Críticos.
Pacientespacientes que recibirán ventilación mecánica por cualquier causa.
Intervencionesninguna
Variables de interés principalesPotencia mecánica.
Resultadosse analizaron 372 enfermos. La PM fue significativamente mayor en pacientes en ventilación controlada por presión (PC) que en ventilación controlada por volumen (VC) (19,20+8,44J/min frente a 16,01+6,88J/min; p<0,001), pero el porcentaje de pacientes con PM>17J/min no fue diferente (41% frente a 35% respectivamente; p=0,382). Los mejores modelos según AICcw que expresan la PM para los enfermos en VC se decribe como: Strain subrogante (Presión de conducción) + PEEP+Strain Rate subrogante (PEEP/cociente de flujo) + Frecuencia respiratoria. Para los enfermos en PC se define como: Strain subrogante (Volumen tidal expiratorio/PEEP) + PEEP+Strain Rate subrogante (Strain subrogante/Ti) + Frecuencia respiratoria+Expiratory Tidal Volumen+Ti.
ConclusionesGran parte de los pacientes en ventilación mecánica en condiciones de práctica clínica habitual reciben niveles de potencia mecánica peligrosos. A pesar de las diferencias observadas en los valores de potencia mecánica entre la ventilación VC y PC, este porcentaje de riesgo fue similar en PC y VC.
In terms of materialscience, mechanical power refers to the ability of a material or component to withstand loads and transmit energy without undergoing deformation.1 In mechanical ventilation, the term Mechanical Power (MP) defines the amount of energy delivered to the respiratory system (rather than the lung) in a minute (rather than 1 cycle).2 Gattinoni proposed a formula for calculating MP obtained by geometric transformation of the pressure-volume loop and based on the main ventilator parameters in volume-controlled (VC) mode: tidal volume (Vt), driving pressure (DP), flow, respiratory rate (RR), and positive end-expiratory pressure (PEEP).3 Several simplified versions of the same formula have been developed.4–6 Becher and van der Meijden have also proposed formulas for calculating MP in pressure control (PC).7,8
Several prospective studies have linked MP to developing ventilator-induced lung injury9 (VILI), and even death10–12 of mechanically ventilated patients.13 Recent clinical studies have suggested that MP levels above 18−20J/min are associated with an increased risk of death in patients undergoing mechanical ventilation.14,15
The primary objective of this study is to determine the prevalence of elevated MP values (>17J/min) utilized in routine clinical practice. This will be achieved through the application of established formulas described in existing literature, specifically focusing on patients undergoing controlled ventilation. As a secondary objective, the study aims to investigate the weight of distinct components of mechanical power in both volume-controlled (VCV) and pressure-controlled (PCV) ventilation modes.
MethodsThis observational, descriptive, cross-sectional, analytical, multi-centre, and international study was conducted on November 21st, 2019, from 8 a.m. to 3pm (Supplementary material 1). Eligible patients were all those who on November 21, 2019, during the specified time, met the inclusion criteria: being admitted to a critical care area and receiving mechanical ventilation for any cause.
Exclusion criteria included patients admitted to critical care areas who were not receiving invasive mechanical ventilation at the time during the time specified, receiving invasive mechanical ventilation for less than 6h, tracheotomized patients, patients ventilated with APRV (Airway Pressure Release Ventilation) y BiLEVEL (BiLevel Positive Airway Pressure) modes, non-invasive ventilation, selective ventilation, ventilation through nasotracheal intubation, and patients undergoing extracorporeal circulatory and respiratory support (ECMO-VV, ECMO-VA, and external carbon dioxide removal devices).
Clinical-demographic patient variables, variables related to mechanical ventilation, and analytical variables were recorded (Supplementary material 1).
The formula used to calculate MP in VC modes was the "simplified" formula proposed by Gattinoni et al.: MP=0.098 × Vt × RR × PIP − [(Pplat − PEEP)/2]. In the PC mode, the "simplified" formula proposed by Becher et al. was: MP=0.098 × Vt × RR × (ΔPins+PEEP). Based on recent publications, a threshold of high mechanical power was established at 17J/min.14–16
The study received approval from the Clinical Research Ethics Committee of Marqués de Valdecilla University Hospital, Santander, Spain. Informed consent was required. Subsequently, the necessary documentation was provided to each participating centre to obtain approval from their respective Clinical Research Ethics Committess, ensuring that all participating centres had the necessary approvals before starting the study.
The study was registered in the ClinicalTrials.gov database: NCT03936231.
Statistical analysisA descriptive analysis of the sample was conducted. Results are presented as percentages for categorical variables, and as mean±standard deviation for continuous quantitative variables that followed a normal distribution (Kolmogorov-Smirnov).
Chi-square tests (Z test) were used for bivariate comparisons of categorical variables. For continuous variables with normal distribution, parametric tests (Welch) and their non-parametric equivalents were used for those that did not present a normal distribution.
Multivariable regression models were adjusted using the general linear model. The fit of each model was evaluated with the analysis of its studentized residuals and with normal QQ plots (supplementary material 2).17 The variables were selected for each model using the Akaike Information Criterion (AIC).
Theoretical concepts of material science indicate that the total stress which supports a viscoelastic body when deformed comes from the combination of the stress induced by the elastic behaviour and the stress induced by the viscous behaviour. To explore the respiratory variables most possibly related to the energy transmitted to the lungs, we carried out a process of algorithmic selection of regression models. For the adjustment of each model, the MP was used as the dependent variable and other different variables, depending on the ventilatory mode, were used as independent variables. In the selection of variables to develop the different models, we considered those that we believe best represented the viscoelastic component of the lung: Thus, in VC modes, in which the ventilator administers a fixed Vt, the independent variable that represented the elastic behaviour (surrogate of strain) was the DP and the one that represented the viscous behavior (surrogate of the strain rate) was the quotient Flow/PEEP. In PC modes, in which the ventilator tries to maintain the peak presssure (and subsequentely the DP), the elastic behaviour of the parenchyma was represented with VTe/PEEP (as a surrogate of the strain; where VTe=volume tidal expiratory and PEEP: positive end-expiratory pressure), and the viscous behaviour of the parenchyma (surrogate of the strain rate) was represented with the surrogate of the strain divided by the inspiratory time ((VTe/PEEP)/Ti).18 For both modes PEEP was used as a surrogate for FRC.
For model comparison, information entropy measures of predictive accuracy were used, removing the cases with missing values at the start to fit the models to the same observations. This procedure reflects our interest in the models' relative performance, not their absolute information values. The Akaike's Information Criterion with the finite sample correction (AICc) was used to decide what the "best" model (of the candidates set, and in the sense of the expected Kullback-Leibler discrepancy) was. Then, for each model, the Akaike Weights19–21 and the Turing-Good Weights of Evidence (WOE) against every model relative to "best" model were computed.22
For every model we computed the Likelihood of the Model (relative to the "best" one) given the data. Using every model AICc, the model with the minimum AICc was selected as the "best" one (in the expected Kullbach-Leibler discrepancy sense). Then, the relative model likelihoods are normalized (i.e., divided by the sum of the likelihoods of all models) to obtain Akaike weights (the probability of every model in this set to be the "best" one). And in the last step, the WOE against (in decibans), relative to the "best" one, of all models were computed. Weight of Evidence in deciBans (WOEagaBM) refers to a numerical measure that utilizes deciBans to express the "weight of evidence" or the strength of an argument or set of data in a specific context. DeciBans are a relative unit used in various disciplines to quantify the relationship between two quantities, typically in terms of a difference in intensity or proportion.
All the additional analysis was done in R 3.6.3.
ResultsA total of 664 critically ill patients from 133 intensive care units in 15 countries (Argentina, Brazil, Chile, China, Colombia, Ecuador, Spain, Honduras, Italy, Morocco, Mexico, Peru, Poland, Portugal, and Uruguay) were registered. Fifty-seven records were in pediatric patients, 196 in non-ventilated patients in controlled mode. Out of the 411 patients enrolled in controlled mode, 36 were excluded due to errors in the record or having incomplete records (Flowchart in Fig. 1).

Spain led the participation with 188 patients, followed by Ecuador with 54 and Argentina with 34. Colombia and Mexico also made significant contributions with 18 and 30 patients, respectively. Regarding the collaboration of ICUs, Spain led once again with 56 participating ICUs. Ecuador contributed 8 ICUs, while Argentina and Colombia provided 10 and 4 ICUs, respectively. Other countries like Italy, Chile, and Uruguay also participated in the study, standing out for the number of patients and ICUs involved (Fig. 2).

Of the 372 patients who were ventilated in controlled the main cause of orotracheal intubation was respiratory failure (33%; 95%CI: 12–63), followed by neurological impairment (31%; 95%CI: 11–60). Table 1 shows the main clinical-demographic, gasometric, and ventilatory variables analyzed in the total sample and the main differences between the compared groups are shown in Table 2.
Characteristics of the cohort of 372 patients ventilated in controlled mode.
| Values | ||
|---|---|---|
| Demographic variables | ||
| Age (years), mean (SD) | 58.18 | (17.96) |
| Height (cm), mean (SD) | 166.51 | (8.94) |
| Weight (Kg), mean (SD) | 75.71 | (16.75) |
| SexMen, n (%) | 237 | (64.1%) |
| Personal history | ||
| Smoker, n (%) | 98 | (26.3%) |
| COPD, n (%) | 46 | (12.4%) |
| COPD GOLD c–d, n (%) | 11 | (3%) |
| Asthma, n (%) | 8 | (2.2%) |
| History of lung neoplasia, n (%) | 6 | (1.6%) |
| Previous radiotherapy, n (%) | 5 | (1.3%) |
| Lobectomy, n (%) | 8 | (2.2%) |
| Reason for respiratory admission | 112 | (30.1%) |
| Cause of intubation | ||
| Weaning failure, n (%) | 1 | (0.3%) |
| Hemodynamic instability, n (%) | 51 | (13.7%) |
| Respiratory failure, n (%) | 126 | (33.9%) |
| Neurological disorder, n (%) | 127 | (34.1%) |
| Other, n (%) | 1 | (0.3%) |
| Presence of ARDS (The Berlin classification)a | ||
| No ARDS, n (%) | 301 | (80.9%) |
| Mild ARDS, n (%) | 21 | (5.6%) |
| Moderate ARDS, n (%) | 23 | (6.2%) |
| Severe ARDS, n (%) | 22 | (5.9%) |
| Continuous iv sedation, n (%) | 296 | (79.6%) |
| Continuous iv analgesia, n (%) | 322 | (86.6%) |
| Continuous iv muscle relaxation, n (%) | 36 | (9.7%) |
| Gasometric data | ||
| pH, mean (SD) | 7.39 | (0.95) |
| PO2 (mmHg), mean (SD) | 98.68 | (51.46) |
| PCO2 (mmHg), mean (SD) | 39.6 | (8.42) |
| HCO3 (mmol/L), mean (SD) | 23.82 | (5.28) |
| EB (mEq/L), mean (SD) | −0.63 | (6.58) |
| Lactate (mmol/L), mean (SD) | 2.98 | (4.94) |
COPD: Chronic Obstructive Pulmonary Disease; ARDS: Acute Respiratory Distres Syndrome.
The Berlin classification: Clinical criteria of acute lung injury within one week of a known clinical insult or new or worsening respiratory symptoms and bilateral opacities on chest imaging. Mild ARDS: PaO2/FiO2 (arterial oxygen tension/fraction of inspired oxygen) ratio between 200 and 300mm Hg on PEEP≥5cm H2O or CPAP; Moderate ARDS: PaO2/FiO2 ratio between 100 and 200mm Hg on PEEP≥5cm H2O or CPAP; Severe ARDS: PaO2/FiO2 ratio of ≤100mm Hg on PEEP≥5cm H2O or CPAP.
Main differences between patients ventilated under pressure control and patients ventilated under volume control.
| Pressure Controln=174 | Volumen Controln=198 | p | |
|---|---|---|---|
| Demographic variables | |||
| Age (years), mean (SD) | 58 (18) | 58 (17) | 0.879 |
| Height (cm), mean (SD) | 165 (9) | 167 (9) | 0.022 |
| Weight (Kg), mean (SD) | 74 (17) | 76 (16) | 0.186 |
| SexMen, n (%) | 103 (59%) | 134 (68%) | 0.06 |
| Personal history | |||
| Smoker, n (%) | 35 (20%) | 63 (32%) | 0.007 |
| COPD, n (%) | 14 (8%) | 32 (16%) | 0.021 |
| COPD GOLD c-d, n (%) | 3 (1.8%) | 8 (4.1%) | 0.219 |
| Asthma, n (%) | 6 (3.5%) | 2 (1%) | 0.110 |
| History of lung neoplasia, n (%) | 2 (1.1%) | 4 (2%) | 0.509 |
| Previous radiotherapy, n (%) | 3 (1.78%) | 2 (1%) | 0.532 |
| Lobectomy, n (%) | 3 (1.8%) | 5 (2.5%) | 0.639 |
| Reason for respiratory admission | 49 (29%) | 63 (32%) | 0.449 |
| Cause of intubation | 0 (0%) | 1 (0.5%) | 0.431 |
| Weaning failure, n (%) | 23 (13%) | 28 (14%) | |
| Hemodynamic instability, n (%) | 56 (32%) | 70 (35%) | |
| Respiratory failure, n (%) | 67 (39%) | 60 (30%) | |
| Neurological disorder, n (%) | 26 (15%) | 38 (19%) | |
| Other, n (%) | 0 (0%) | 1 (0.5%) | |
| Presence of ARDS (The Berlin classification)* | 0.684 | ||
| No ARDS, n (%) | 141 (82%) | 160 (82%) | |
| Mild ARDS, n (%) | 11 (6.3%) | 10 (5%) | |
| Moderate ARDS, n (%) | 12 (7%) | 11 (5.5%) | |
| Severe ARDS, n (%) | 8 (4.5%) | 14 (7%) | |
| Continuous iv sedation, n (%) | 126 (72%) | 170 (86%) | 0.001 |
| Continuous iv analgesia, n (%) | 143 (82%) | 179 (90%) | 0.064 |
| Continuous iv muscle relaxation, n (%) | 8 (4.5%) | 28 (14%) | 0.006 |
| Gasometric data | |||
| pH, mean (SD) | 7.39 (0.08) | 7.38 (0.09) | 0.384 |
| PO2 (mmHg), mean (SD) | 107 (48) | 109 (46) | 0.619 |
| PCO2 (mmHg), mean (SD) | 36 (11) | 37 (14) | 0.433 |
| HCO3 (mmol/L), mean (SD) | 22 (7) | 22 (8) | 0.950 |
| EB (mEq/L), mean (SD) | −0.8 (5.5) | −0.14 (6.3) | 0.276 |
| Lactate (mmol/L), mean (SD) | 2.6 (5) | 2.3 (4) | 0.537 |
COPD: Chronic Obstructive Pulmonary Disease; ARDS: Acute Respiratory Distres Syndrome. *The Berlin classification: Clinical criteria of acute lung injury within one week of a known clinical insult or new or worsening respiratory symptoms and bilateral opacities on chest imaging. Mild ARDS: PaO2/FiO2 (arterial oxygen tension/fraction of inspired oxygen) ratio between 200 and 300mm Hg on PEEP≥5cm H2O or CPAP; Moderate ARDS: PaO2/FiO2 ratio between 100 and 200mm Hg on PEEP≥5cm H2O or CPAP; Severe ARDS: PaO2/FiO2 ratio of ≤100mm Hg on PEEP≥5cm H2O or CPAP.
The MP value in the patients under VC ventilation sample was 16 (7) J/min. For patients under PC ventilation, it was 19 (8) J/min. The difference in MP values was 3J/min (95%CI: 1–5; p<0.001) higher in the pressure-controlled group. In 38% of the analyzed subjects, the mechanical power value was greater than 17J/min. The prevalence of high MP (number of patients with MP>17J/min / number of ventilated patients) was 38%. The values of the different variables of the MP formula in VC and PC are shown in Table 3; no significant difference was found in the prevalence of mechanical power exceeding 17J/min between the two groups (p=0.382).
Main differences in mechanical power values and ventilatory parameters between patients undergoing pressure-controlled ventilation and patients undergoing volume-controlled ventilation.
| Variables | Pressurecontroln=174 | Volumen controln=198 | p | ||
|---|---|---|---|---|---|
| Mechanical power, J/min | 19.20 | (8.44) | 16.01 | (6.88) | <0.001 |
| Mechanical power >17J/min, n (%) | 72 | (41%) | 69 | (35%) | 0.382 |
| PEEP, cmH2O | 7.03 | (2.07) | 7.29 | (2.68) | 0.279 |
| Plateau pressure, cmH20 | 18.94 | (4.84) | 18.65 | (4.77) | 0.589 |
| PIP, cmH2O | 23.53 | (6.19) | 24.98 | (6.69) | 0.034 |
| Compliance, mL/cmH2O | 49.52 | (36.91) | 44.64 | (21.52) | 0.157 |
| Raw, cmH2O/(L/seg) | 18.09 | (47.61) | 11.85 | (5.83) | 0.162 |
| Tidal Volumen set, mL | 464.95 | (74.52) | 458.55a | (64.78)a | 0.395 |
| Vte, mL | 464.69 | (91.18) | 454.26 | (83.19) | 0.294 |
| Respiratory rate | 17.23 | (3.38) | 17.86 | (4.37) | 0.116 |
| FiO2 | 41.90 | (15.84) | 44.84 | (16.87) | 0.085 |
| ETCO2, mmHg | 36.32 | (12.39) | 34.32 | (8.53) | 0.381 |
| P/F | 282.56 | (164.01) | 267.02 | (38.57) | 0.325 |
Variable values are reported as mean and standard deviation (in parentheses).
PEEP: positive end-expiratory pressure; PIP: Peak inspiratory pressure; Raw: Airway resistance; Vte: Tidal Volumen expiratory measured; FiO2: Fraction of Inspired Oxygen; ETCO2: End-tidal CO2; P/F: PaO2/FiO2 ratio.
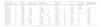
The Table 4 presents the information for nine different models of patients under VC, numbered from 1 to 9. The "best" model is Model 7 (DP+PEEP+StrainRate.Subr+RR), as it has the lowest AICc value. The other models are compared to this best model. The Delta_AICc column shows the difference between the AICc value of each model and the AICc value of Model 7. The data less well support models with larger Delta_AICc values. The Akaike weight of evidence (AICcWt) column shows the weight of evidence in favor of each model, with higher values indicating stronger support. The weight of evidence in deciBans, calculated as 10*log10(AICcWt/max(AICcWt) (WOEagaBM) column presents the weight of evidence in deciBans, with positive values indicating support for a given model and negative values indicating evidence against it.
Model weights of evidence against the best one (in deciBans), for patients under volume control.
| Modnames | K | AICc | Delta_AICc | ModelLik | AICWt | LL | Cum.Wt | WOEagaBM |
|---|---|---|---|---|---|---|---|---|
| Model 7 | 6 | 1083 | 0 | 1e+0 | 6.67e−1 | −535 | 0.667 | 0 |
| Model 9 | 7 | 1085 | 2.16 | 3.40e−1 | 2.27e−1 | −535 | 0.894 | −4.69 |
| Model 5 | 6 | 1086 | 3.68 | 1.59e−1 | 1.06e−1 | −537 | 1 | −7.99 |
| Model 3 | 5 | 1122 | 39.5 | 2.65e−9 | 1.77e−9 | −556 | 1 | −85.8 |
| Model 6 | 5 | 1153 | 70.5 | 5e−16 | 3.34e−16 | −571 | 1 | −153 |
| Model 8 | 6 | 1155 | 72 | 2.28e−16 | 1.52e−16 | −571 | 1 | −156 |
| Model 4 | 5 | 1179 | 96.2 | 1.28e−21 | 8.56e−22 | −584 | 1 | −209 |
| Model 2 | 4 | 1222 | 139 | 6.06e−31 | 4.04e−31 | −607 | 1 | −302 |
| Model 1 | 3 | 1232 | 149 | 3.69e−33 | 2.46e−33 | −613 | 1 | −324 |
Modnames: Model names; K: Number of parameters in the model; AICc: Akaike Information Criterion corrected for small sample sizes; Delta_AICc: Difference between the AICc value of each model and the AICc value of the best model; ModelLik: Model likelihood; AICcWt: Akaike weight of evidence; LL: Log-likelihood; Cum.Wt: Cumulative weight of evidence; WOEagaBM: Weight of evidence in deciBans, calculated as 10*log10(AICcWt/max(AICcWt)).
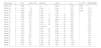
Based on Table 5, the model with the highest WOEagaBM in patients under pressure control ventilation is Model 16 (Strain_subr_PC+eVT+PEEP+StrainRate_subr_PC+RR), with a WOEagaBM value of 0. Model 16 has a K value of 7, an AICc value of 1652, a Delta_AICc of 0, a ModelLik value of 1e+0, an AICcWt value of 4.55e−1, an LL value of −819, and a Cum.Wt value of 0.455. The WOEagaBM values for the other models range from −975 to 0, with the models having higher values being less supported by the evidence. Therefore, Model 16 is the best supported model according to the weight of evidence analysis provided.
Model weights of evidence against the best one (in deciBans), for patients under pressure control.
| Modnames | K | AICc | Delta_AICc | ModelLik | AICWt | LL | Cum.Wt | WOEagaBM |
|---|---|---|---|---|---|---|---|---|
| Model 16 | 7 | 1652 | 0 | 1e+0 | 4.55e−1 | −819 | 0.455 | 0 |
| Model 18 | 8 | 1653 | 1.16 | 5.59e−1 | 2.54e−1 | −818 | 0.709 | −2.53 |
| Model 13 | 6 | 1654 | 1.78 | 4.10e−1 | 1.86e−1 | −821 | 0.896 | −3.87 |
| Model 15 | 7 | 1655 | 2.95 | 2.29e−1 | 1.04e−1 | −820 | 1 | −6.40 |
| Model 9 | 6 | 1694 | 42.2 | 6.94e−10 | 3.16e−10 | −841 | 1 | −91.6 |
| Model 11 | 7 | 1695 | 43.3 | 4.05e−10 | 1.84e−10 | −840 | 1 | −93.9 |
| Model 17 | 7 | 1766 | 114 | 1.47e−25 | 6.69e−26 | −876 | 1 | −248 |
| Model 14 | 6 | 1777 | 125 | 7.94e−28 | 3.61e−28 | −882 | 1 | −271 |
| Model 5 | 5 | 1780 | 128 | 1.67e−28 | 7.60e−29 | −885 | 1 | −278 |
| Model 7 | 6 | 1781 | 129 | 1.00e-28 | 4.56e−29 | −884 | 1 | −280 |
| Model 10 | 6 | 1781 | 129 | 9.98e−29 | 4.54e−29 | −884 | 1 | −280 |
| Model 12 | 6 | 1787 | 135 | 4.40e−30 | 2.00e−30 | −887 | 1 | −294 |
| Model 8 | 5 | 1799 | 147 | 1.24e−32 | 5.65e−33 | −894 | 1 | −319 |
| Model 6 | 5 | 1861 | 209 | 3.73e−46 | 1.70e−46 | −925 | 1 | −454 |
| Model 4 | 4 | 1879 | 227 | 4.75e−50 | 2.16e−50 | −935 | 1 | −493 |
| Model 2 | 3 | 2033 | 381 | 2.16e−83 | 9.84e−84 | −1013 | 1 | −827 |
| Model 3 | 3 | 2046 | 394 | 2.63e−86 | 1.20e−86 | −1020 | 1 | −856 |
| Model 1 | 3 | 2101 | 449 | 3.29e−98 | 1.50e−98 | −1047 | 1 | −975 |
Modnames: Model names; K: Number of parameters in the model; AICc: Akaike Information Criterion corrected for small sample sizes; Delta_AICc: Difference between the AICc value of each model and the AICc value of the best model; ModelLik: Model likelihood; AICcWt: Akaike weight of evidence; LL: Log-likelihood; Cum.Wt: Cumulative weight of evidence; WOEagaBM: Weight of evidence in deciBans, calculated as 10*log10(AICcWt/max(AICcWt)).
The algorithmic selection of models for each ventilatory mode is detailed in Supplementary Material 3 and 4.
DiscussionIn the studied population, nearly two-fifths of subjects undergoing controlled mechanical ventilation exceeded the 17J/min mechanical power threshold. Despite variations in mechanical power values between patients undergoing volume-controlled (VC) and pressure-controlled (PC) ventilation, no significant differences were observed in the prevalence of elevated mechanical power values.
The calculation of MP in mechanical ventilation is a complex topic that is still evolving. There are various formulas and methods for calculating MP, and often a large amount of detailed information and precise measurements are required for its application.23,24 There are numerous formulas and approaches to calculate MP in mechanical ventilation, and MP values can vary significantly. Simplified formulas – validated in previous studies – such as those proposed by Gattinoni et al.25 and Becher et al.26 are simple and practical approaches for MP calculation in VC and PC modes, respectively.
In this context, the specific MP values described in the literature for VC and PC are heterogeneous. Protti et al.27 found that MP values in VC varied between 4 and 43J/min, depending on the formula used for MP calculation. In a study by Amato et al.28 MP values in VC varied between 10.6 and 16.4J/min, depending on the formula used. Regarding MP values in PC, a study by Costa et al.29 found that MP values varied between 8.8 and 17.3J/min, depending on the formula used. In another study by Bellani et al.,30 MP values in PC varied between 8.7 and 13.2J/min, depending on the formula used.
Our results reveal a significant difference in MP values between patients ventilated in VC and PC modes. This finding is consistent with the data obtained by Rietveld et al.,31 who found that in 46 mechanically ventilated patients without spontaneous breathing, the mean MP in VC was significantly lower than in PC (absolute difference of 1.26J/min; SD 0.14J/min; p<0.00001).These results contradict the hypothesis that PC modes produce less MP than VC, based on the the idea that the maximum peak pressure is equivalent to Pplat.32
In general, the use of surrogates is a commonly employed strategy in modelling complex systems, including the human respiratory system. Surrogates represent lung tissue's response to different ventilation modes, allowing for the evaluation of how mechanical ventilation affects lung tissue. In the literature, several studies have utilized surrogates for respiratory system evaluation. For example, in a 2016 study, Bellani et al.33 used strain and strain rate surrogates to evaluate the relationship between MP and clinical outcomes in acute respiratory distress syndrome (ARDS) patients treated with mechanical ventilation. In another 2018 study, Sinderby et al.34 used volume and pressure surrogates to evaluate different ventilation modes in patients with acute respiratory failure.
The correlation between PEEP and FRC in the context of mechanical ventilation is grounded in the principles of alveolar structure and lung elastic properties. The application of PEEP in mechanical ventilation involves maintaining a constant positive pressure in the airways, with effects on maintaining alveolar patency. Consequently, this resembles the condition of the FRC (the amount of air that remains in the lungs after a normal expiration, preventing collapse of smaller alveoli and providing a foundation of air for the next inspiration). Since applying PEEP during mechanical ventilation has a similar effect to maintaining the FRC, it can be postulated that PEEP could serve as an indirect indicator of FRC in patients under ventilatory support. However, it is important to recognize that PEEP and FRC are not equivalent, and there are physiological and clinical differences between them. PEEP can influence alveolar distension and transpulmonary pressures, whereas FRC is related to functional reserve and preventing alveolar collapse.35
The presence of "strain" and "strain rate" surrogates in the AIC-established models of MP in our results may be related to the viscoelastic behaviour of the lung.36 Lung tissue has viscoelastic behaviour, which means it can deform and recover its original shape in response to applied forces. Still, the deformation and recovery may have different speeds and characteristics depending on the viscoelastic properties of the tissue.37 In a study by Gattinoni et al., it was demonstrated that using Driving Pressure (as a surrogate for strain) and Flow/PEEP (as a surrogate for strain rate) in patients on controlled ventilation was associated with a reduction in mortality compared to using plateau pressure as an adjustment parameter.38 A study by Talmor et al. found that using strain and strain rate surrogates for adjusting mechanical ventilation parameters in patients with ALI was associated with improved arterial oxygenation and reduced mechanical ventilation time.39
We consider that the main strengths of the study encompass its multicenter and international design, the inclusion of a diverse sample of critically ill patients, the utilization of rigorous statistical methodologies, and the incorporation of sophisticated analyses and measures for model selection and comparison. Furthermore, the study's transparency and detailed presentation of the employed procedures contribute to its robustness.
As for the weaknesses of the study, first: the analysis of variables with "significance" which are included in the calculi for the mechanical power has potential statistical collinearity, as a circular argument. Second: it is an observational study, which means that a controlled and randomized intervention was not performed. Consequently, causal relationships between mechanical ventilation modes and measured outcomes cannot be established. Additionally, although multivariable regression models were adjusted using the AIC, and the fit of each model was evaluated with the analysis of their standardized residuals and with QQ plots for normality, it is possible that other fitting models could have been used, which could affect the results. In other hand, the patient sample per hospital and the single-day period may raise concerns regarding the representativeness and robustness of the results.
With the presented data, we can conclude that a substantial portion of patients undergoing mechanical ventilation may be at risk of experiencing elevated mechanical power levels, potentially contributing to complications associated with ventilator-induced lung injury. Despite the observed differences in mechanical power values between VC and PC ventilation, no statistically significant difference was found in the prevalence of mechanical power exceeding 17J/min between the two groups. This indicates that while mechanical power levels differed, they did not result in a significant disparity in the prevalence of elevated mechanical power values.
Contribución de los autoresAlejandro González-Castro: Initial study design, study promotion, data refinement, manuscript writing.
Patricia Escudero-Acha: Initial study design, study promotion, data refinement.
Alberto Medina Villanueva: Initial study design, manuscript writing and translation correction.
Aurio Fajardo Campoverdi: Corrección de la versión final del manuscrito, Promoción del estudio, Análisis estadístico.
Federico Gordo Vidal: Initial study design, study promotion, final manuscript version correction.
Ignacio Martin-Loeches: Initial study design, study promotion, final manuscript version correction.
Angelo Roncalli Rocha: Initial study design, study promotion, final manuscript version correction.
Marta Costa Romero: Initial study design, study promotion, final manuscript version correction.
Marianela Hernández López: Initial study design, study promotion, final manuscript version correction.
Carlos Ferrando: Initial study design, study promotion, final manuscript version correction.
Alessandro Protti: Initial study design, study promotion, final manuscript version correction.
Vicent Modesto i Alapont: Initial study design, study promotion, final manuscript version correction, statistical analysis.
Mechanical Power Day Group*: Variable collection.
The following are Supplementary data to this article:


