


Edited by: Ana Ochagavía - Hospital Universitario de Bellvitge. L'Hospitalet de Llobregat. Barcelona. Spain.
Last update: March 2024
More infoThe use of ultrasound while caring for critically ill patients has been increasing exponentially in the last two decades and now is an essential component of intensive care practice. Abdominal ultrasound is an established technique in other specialties, but its use in intensive care has lagged behind other ultrasound modalities. However, its potential role in the diagnosis and management of patients will make it an invaluable tool for intensivists.
The main use of abdominal ultrasound at the bedside is for free fluid detection in trauma patients. But abdominal ultrasound can also help us diagnose patients with abdominal pain, hypovolemia or anuria, and it can guide us during procedures such as paracentesis or bladder catheter and gastric tube placement.
El uso de la ecografía en las unidades de críticos se ha extendido de forma exponencial en las últimas dos décadas y se ha convertido en una parte esencial de nuestra práctica clínica. La ecografía abdominal es una técnica ampliamente establecida en otras especialidades, pero su uso en cuidados intensivos ha quedado rezagado respecto a otras modalidades de ecografía. Sin embargo, su potencial papel en el diagnóstico y manejo de los pacientes lo convertirá en una herramienta invaluable para los intensivistas.
El uso más extendido de la ecografía abdominal a pie de cama es para la valoración de la presencia de líquido libre en el paciente traumático. No obstante, la ecografía abdominal también puede ayudarnos a diagnosticar pacientes con dolor abdominal, hipovolemia o anuria, y puede guiarnos en procedimientos como la paracentesis o el sondaje vesical o gástrico.
Ultrasound is a diagnostic and therapeutic tool that can be used at the patient’s bedside. Integrated within the clinical context, it allows intensivists to perform a fast and reliable assessment of the abdomen in critically ill patients.1 Abdominal ultrasound in critical care was already contemplated by the first national and international consensuses as an essential element in the management of the critically ill, and the recent guidelines continue to recommend it in view of its great usefulness.2–5
Free intraperitoneal fluidThe detection of free fluid in the peritoneal cavity in patients with non-traumatic acute abdomen, and the application of the FAST (Focused Assessment with Sonography for Trauma) protocol in severe trauma, are regarded as basic skills for intensivists.3–5
FAST (Focused Assessment with Sonography for Trauma) protocolThe FAST protocol is used for the detection of free fluid, which manifests as a hypoechoic or anechoic collection, and is performed in trauma patients. It has been shown to be useful as a triage tool to shorten the time to definitive care.6 The FAST protocol includes evaluations of the pericardium to identify hemopericardium and tamponade, and of the abdomen and thorax to detect free intraperitoneal fluid and hemothorax. The term “extended-FAST” is used when an extended exploration of the thorax is made in search of pneumothorax. Its only contraindication is the need for emergent surgery.7
According to the Advanced Trauma Life Support (ATLS) algorithm, FAST is generally applied in case of hemodynamic instability to identify possible bleeding points in the thorax and abdomen in the “C” part of the primary examination.8 The exploration is reported as positive, negative or indeterminate if some point cannot be adequately evaluated.
The exploration is rapid (less than 5 min) and involves the use of a low-frequency (2.5−5 MHz) sector or convex probe in standardized ultrasound views (subcostal, right upper quatrant, left upper quadrant and suprapubic) (Fig. 1). Following this order allows us to first diagnose cardiac tamponade – the most acute and potentially fatal lesion. However, the order of the exploration may vary according to the mechanism of the lesion.
, right upper quadrant (B), left upper quadrant (C) and suprapubic (D). +: Bladder catheter balloon. *: Free fluid.")
The probe is placed at epigastric level with the indicator aimed towards the left shoulder and at an inclination of almost 0°. It is important not to confuse the epicardial adipose tissue with effusion (the former is adhered to the heart and is seen to move with it).
Right upper quadrant, periheaptic or Morison pouch viewThe probe is placed with the indicator aimed towards the head, between the mid-clavicular and posterior axillary lines at intercostal space 10−11. We evaluate four spaces: pleural, subphrenic, hepatorenal (Morison’s pouch) and the lower pole of the right kidney. Here the presence of free fluid can be identified with greater sensitivity.
Left upper quadrant or periesplenic viewThe probe is placed with the indicator aimed towards the head, over the posterior axillary line at intercostal space 8−9. We evaluate four spaces: pleural, subphrenic, perisplenic and the lower pole of the left kidney. This zone is more difficult to explore due to the presence of the stomach and because the spleen presents a poorer acoustic window than the liver, as it is located more posterior and higher up.
Suprapubic or pelvic viewThe probe is placed with a sagittal orientation immediately above the pubic symphysis, searching for fluid accumulations behind the bladder in males and behind the uterus in females. The bladder is used as a sonographic window; an empty bladder does not allow the visualization of small volumes of free fluid. If a bladder catheter has been placed, the bladder can be partially filled with saline solution to create an acoustic window.
The FAST exploration is more useful when it proves positive and the patient is hemodynamically unstable, since it warrants immediate action. However, when the patient is hemodynamically stable, the standard of care is to perform awhole-body computed tomography (CT).9,10
The FAST protocol has several limitations, including low sensitivity. Some studies have reported sensitivities of between 63 and 100% in detecting hemoperitoneum.11–13 Therefore, if the exploration proves negative in a hemodynamically stable patient, further imaging studies will be needed. The sensitivity is so variable because the detection of free intraperitoneal fluid depends on several factors such as the location of the lesion, the time elapsed from the occurrence of the injury, the volume of fluid, the presence of intraabdominal adherences, intestinal gas patterns, and the quality of the exploration. Several studies have explored ways to improve the sensitivity of the technique, such as combining it with the clinical and laboratory test findings,14 or performing serial examinations.15 Another limitation is the inability to detect lesions such as subtle fluid collections (<200 ml), hollow organ lesions manifesting as free gas and not as hemoperitoneum, or damage affecting retroperitoneal structures. Lastly, ultrasound is also limited by patient comorbidities such as obesity or chronic obstructive pulmonary disease (COPD). Furthermore, in special populations such as women of fertile age, the technique is limited by the fact that a small amount of free fluid in the pelvis is associated with the ovulation phase.
Renal and genitourinary ultrasoundUltrasound is very useful in the diagnosis of renal and genitourinary diseases. The kidneys and bladder are easily accessible from the ultrasound perspective, and obtaining images is relatively simple. Ultrasound is, therefore, an important element in the diagnosis of structural problems of the urinary tract, and in the identification and prognosis of acute renal failure.
Bladder ultrasoundIn adults, the bladder is usually located on the midline.16,17 We find it beneath the rectus abdominis muscles in the suprapubic region, anterior to the uterus in women, and it is easier to identify when distended. Under normal conditions, the bladder is an anechoic structure with a well-defined hyperechoic muscle wall showing posterior enhancement.
The bladder is explored with a convex probe in a transverse position, just above the pubic symphysis for the transverse plane, and if the probe is rotated 90 ° in the cranial direction we obtain the longitudinal plane. Based on these two planes we can assess the presence of bladder distension, calculating the bladder volume with the formula: height × width × length × 0.52 (Fig. 2).18
, and the superior-inferior dimension or height is measured in the longitudinal plane (C).")
Color Doppler ultrasound can identify the presence or absence of ureteral jets, which reflect the normal and periodic passage of urine through the ureter towards the bladder. The presence of urine jets entering the bladder from the bladder trigone discards the existence of obstructive urological disorders (Supplementary Video 1).
Renal ultrasoundThe kidneys are retroperitoneal organs and are usually explored with a low-frequency curved probe. The latter is positioned on the axillary midline and posterior line at the intercostal spaces in both the longitudinal and transverse axes, with the patient in the supine position or lateral position contralateral to the explored kidney.
The convex portion corresponds to the parenchyma, composed of the cortex and the medulla – the latter being hypoechogenic and lying more central with respect to the cortex. At the center, we find the sinus, which appears hyperechogenic due to the presence of adipose tissue, and contains the urine collector system and blood vessels. Kidney size is variable but normally ranges between 10−12 × 5 × 3 cm. The collector system is usually not visualized except in the presence of hydronephrosis or obstruction.
There may be modifications in kidney morphology. In case of acute renal failure the cortical layer is thin and lacks corticomedullary differentiation. However, in patients with chronic renal failure, the cortical component shows increased echogenicity. In case of hydronephrosis, we observe anechoic zones in the sinus with confluence towards the major calyces of the renal pelvis. A classification has been proposed in which hydronephrosis is defined as mild, moderate or severe. Mild hydronephrosis is characterized by a preserved parenchyma, and the calyces measure less than 1 cm in size, while moderate hydronephrosis is characterized by more dilated calyces and the parenchyma is preserved or slightly atrophic (cortex >8 mm). Lastly, severe hydronephrosis is characterized by almost complete parenchymal atrophy and a modified renal anatomy, with central anechoic formations separated by septae.19
Ultrasound is also very useful for evaluating the etiology of renal failure, and spectral analysis based on renal Doppler ultrasound is particularly interesting in this regard.20 The most significant parameters of this analysis are the resistance index (RI) and acceleration time. The RI is the Systolic peak – Diastolic peak/Systolic peak ratio, and its normal value is 0.58 ± 0.1 (>0.7 and particularly >0.8 are indicative of abnormality). The acceleration time should not exceed 0.1 s. The systolic-diastolic curve normally has a long diastolic component indicating low flow resistance.21 In the case of acute renal damage due to sepsis with hypotension, we observe low systolic peaks and a decrease in diastolic velocity. In contrast, if vasoconstriction predominates, the amplitude of the systolic peak willincrease with a nearly absent diastolic flow and an RI of almost 1. RI values >1 are indicative of acute tubular necrosis, with already established kidney damage, renal replacement therpies therefore should be considered. The recovery of diastolic flow indicates that renal function is about to improve.
Abdominal aortic aneurysmThe possible presence of an abdominal aortic aneurysm (AAA) should be investigated in all patients presenting hypotension with no apparent cause and is to be considered in individuals with abdominal pain, back pain or unilateral hydronephrosis. The risk of rupture is directly proportional to the diameter of the aorta, and proves considerable if the diameter exceeds 5.5 cm. Many studies have shown ultrasound to have a sensitivity of 94–99% and a specificity of 98–100% in diagnosing the disorder,22 though its sensitivity is low in detecting bleeding associated with rupture, since this typically occurs at the retroperitoneal space.
Adequate assessment of the aorta requires us to explore as much of its trajectory as possible. Exploration starts at the epigastric level, immediately below the xiphoid process, placing the probe perpendicular to the abdominal wall, with the indicator towards the right side of the patient. By applying a little pressure in order to displace the air within the bowel loops, we can visualize the aorta to the left of the lumbar spine and slightly more superficial with respect to the latter. The diameter of the aorta should be measured from the outer zone of both walls, and we should look for areas of thickening, parietal hematomas, luminal thrombi or signs of dissection. Then, we should extend the exploration, repeating the same measurements in different zones, from rostral to caudal, beyond the root of the celiac trunk, the roots of the renal arteries, and before the iliac bifurcation. If we moreover use color Doppler, we can evaluate flow within the aneurysm, and in the case of aortic dissection, the technique can help visualize the intimal flap with great specificity.23
Ultrasound evaluation of venous congestion. The VExUS scoreVenous congestion, which received little attention in the past, has now been recognized for its importance. If such congestion exceeds certain limits, we lose the potential benefit of increasing cardiac output and adversely affect organ perfusion, which is dependent upon a narrow pre- and post-capillary pressure range.24
The classical clinical signs and symptoms of venous congestion have very limited sensitivity, and volemia is only adequately identified in 50% of the cases. In this context, ultrasound is very useful for assessing volemia and congestion, based on three main strategies: (1) Echocardiography, with the assessment of ventricular function and the estimation of pressures; (2) Pulmonary ultrasound (B lines, pleural effusion); and (3) The assessment of organ congestion, with particular emphasis on VExUS (Venous Excess Ultrasound Score) protocol. The integration of these strategies requires specific training which all intensivists should have.25
The recognition of the relationship between organ congestion and the development of renal failure (especially after heart surgery) has served as an alert to recommend more widespread use of VExUS in the critically ill. The VExUS protocol was recently described and employs the flow values in the hepatic veins, portal vein and intra-renal veins to assess and score venous congestion.26–28
Methodology of the VExUS protocol. Flow patternsBased on an inferior vena cava (IVC) with a diameter of at least 2 cm, we evaluate the venous flow pattern in the liver and kidney territories, classifying it as normal, moderately congested, or severely congested (Fig. 3).
- 1
The first step is to determine the maximum diameter of the IVC in its intrahepatic segment close to the junction with the suprahepatic vein, at a distance of approximately 2 cm. Measurement will be more reliable when made from an orthogonal plane that allows us to evaluate its true dimension, avoiding oblique or non-diametric sections. An IVC diameter of less than 2 cm in principle should discard vascular congestion.
- 2
Then, we use a pulsed doppler to record flow in the portal vein and the suprahepatic vein at the mid-axillary line, aligning the probe with the vessels. A convex probe is preferred, with a vascular renal/hepatic profile. The flows are recorded in expiration, avoiding displacement of the sample volume, of a minimum of 2–3 continuous beats to secure a reliable examination, with electrocardiographic (ECG) recording.24,29
- 2.1
Flow in the suprahepatic veins is normally pulsatile, reflecting the pressure in the right atrium. It includes two anterograde waves – a larger systolic wave (S) and a smaller diastolic wave (D) – and a retrograde A wave (atrial systole). These three waves correspond to the jugular pulse’s A, X and Y waves. When the pressures increase in the right atrium, the A wave becomes more prominent and the S wave decreases in amplitude, to the point where in patients with severe congestion the S wave inverts its flow and merges with the A wave.
- 2.2
The flow in the portal vein is normally continuous or slightly fluctuating and hepatopetal, with velocities of 20−30 cm/s. Since it is separated and buffered by the hepatic sinusoids of the venous system, its flow becomes altered with increased levels of congestion, constituting a more specific marker. In the presence of increased venous pressure or moderate to severe tricuspid valve insufficiency, portal vein flow is seen to be pulsatile, becoming biphasic and even oscillating. We measure the peak and nadir velocities to calculate the pulsatility fraction (PF) as follows: PF(%) = 100·(Vmax−Vmin)/Vmax. A PF over 30% corresponds to mild congestion, while fractions over 50% are indicative of severe congestion.
- 3
Renal flow is usually more difficult to obtain and poses a greater risk of ambiguous results. We search for an interlobar vein as parallel as possible to the ultrasound beam. This flow is normally continuous but becomes pulsatile in the presence of increased congestion. It initially becomes discontinuous until two waves are distinguished (S and D, biphasic discontinuous pattern). In the presence of severe congestion, the S wave decreases to the point of disappearing, and we observe a monophasic discontinuous pattern with only the D wave. These venous flow patterns are more closely related to renal congestion than the intrarenal arterial resistive index.
 for the classification of venous congestion. IVC: Inferior vena cava; PI: Pulsatility index; S: Systole; D: Diastole. Grade 0: IVC < 2 cm, normal patterns; Grade 1: IVC > 2 cm and mild congestion pattern; Grade 2: IVC > 2 cm and one organ with severe congestion pattern; Grade 3: at least two organs with severe congestion pattern. Renal flow often includes the artery (positive, always pulsatile) and vein (under zero line), as they run parallel.")
Venous excess ultrasound score (VExUS) for the classification of venous congestion.
IVC: Inferior vena cava; PI: Pulsatility index; S: Systole; D: Diastole.
Grade 0: IVC < 2 cm, normal patterns; Grade 1: IVC > 2 cm and mild congestion pattern; Grade 2: IVC > 2 cm and one organ with severe congestion pattern; Grade 3: at least two organs with severe congestion pattern. Renal flow often includes the artery (positive, always pulsatile) and vein (under zero line), as they run parallel.
It is important to differentiate between an isolated positive balance and venous congestion with organ dysfunction. The scenarios with the greatest evidence of negative effects of venous congestion are heart surgery, heart failure (HF) and the critically ill patient, these being associated with increased morbidity-mortality and the development of renal failure, congestive hepatopathy and even encephalopathy and delirium.24,26,27,30–34 Over one-half of all patients with HF may present congestion without hypoperfusion, with this being the main hemodynamic determinant of worsened renal function. Patients with venous congestion have poorer survival, longer hospital stay and more readmissions. Experimentally, volume expansion in patients with HF worsens the renal venous pattern and reduces diuretic efficiency.35 On the other hand, depletion guided by these ultrasound patterns allows for individualization in a more agile and objective manner, and appears to be associated with improved renal recovery.25,36 These patterns could indicate displaceable volume in the context of congestion, since critical patients with high portal vein pulsatility and a poorer renal venous pattern exhibit an improved response to diuretics.37 In routine practice, effective negative balances result in changes in these congestion patterns and scores.
Caution in interpretationMany factors can influence venous patterns, with complex interrelations and physiological characteristics.
The diameter of the IVC alone does not necessarily differentiate the degree of congestion, as it is influenced by several factors. In fact, dilatation of the IVC may reflect an increase in volemia or venous return difficulties and heart failure (tamponade, right-side dysfunction, tricuspid valve insufficiency, pulmonary hypertension, mechanical ventilation, etc.). Under such circumstances, the data must be interpreted with caution, since some patients might need a high preload. Also, the IVC may be compressed due to elevations in intraabdominal pressure. Measurement of the IVC must be made carefully: there may be confusion in relation to the long axis of the vessel, due to incorrect alignment or differences in transverse diameters conditioned by pressure or volemia.38 Although this is formally the first step of the VExUS protocol, we can find patients with an IVC diameter of less than 2 cm and organ congestion. Likewise, we can find organ congestion without central venous hypertension, due to obstruction between the IVC and its tributaries.
In patients with liver cirrhosis, pressure transmission is buffered, portal flow is less reliable, and pulsatility may be absent even with important venous congestion and vice versa.39,40 We occasionally can observe portal pulsatility in thin athletes.
Evaluation of the degree of congestion is complex when liver and heart disease, chronic congestion and acute elevations coincide. While the IVC and suprahepatic veins are more sensitive to cardiac conditions and thoracoabdominal interactions, portal pulsatility better reflects elevated volemia, being more suggestive of organ congestion.
Without neglecting these limitations, the main strength of the VExUS protocol is that it systematizes the venous study and integrates different parameters, improving prediction with respect to venous pressure or an isolated ultrasound parameter, and affords a simple view of venous physiology. As always in clinical practice, we finally must perform a global assessment and interpret all these venous flow patterns and their modifying circumstances jointly and in context.
Ultrasound in abdominal solid organ transplantationAbdominal solid organ transplantation is a highly complex procedure with outcomes that have improved over the years thanks to multiple factors (surgical, immunosuppressive), including advances in postoperative care. In this respect, doppler ultrasound is a fundamental tool, since it allows monitoring of the graft and the detection of possible complications in the immediate postoperative period.5,41,42
General explorationFollowing surgery, and once the patient’s hemodynamic and respiratory situation has been controlled, we should perform an abdominal ultrasound, with an evaluation of the graft. For this, we will need to know the anatomical (implantation site, vascular anomalies, etc.) and surgical aspects (anastomosis, stents, etc.) to do a correct interpretation.42
Initially, an assessment of the organ characteristics is made based on conventional insonation planes. The graft normally presents homogeneous contours with adequate differentiation of its parts (parenchyma and hilum), and the walls of the excretory tract are thin. The echogenicity of the organ is evaluated by comparing it with the ipsilateral kidney or spleen. we Moreover, we assess the possible presence of focal lesions (hematomas, simple cysts, etc.). In the case of the liver, we also evaluate signs of diffuse alterations indicating the degree of perfusion or the presence of infiltration (steatosis).
We then examine the relationship of the liver (right hypochondrium) or kidney (iliac fossa) with the adjacent inter-visceral spaces (subphrenic, subhepatic, Morison, Douglas, hemidiaphragm) in search of fluid, hematomas or collections.42
Lastly, since vascular anastomoses are made, we use 2D exploration to evaluate the morphology and characteristics of the vessels, Color Doppler to observe the distribution and patterns of blood flow, and pulsed Doppler to analyze the velocity and derived indices of the main vessels.43
In liver transplantation, we identify the main hepatic artery and its bifurcation, the portal vein and the suprahepatic veins. The portal vein runs parallel and posterior to the biliary tract, measuring 10 mm in thickness and containing no internal echogenicity. Its flow is hepatopetal, continuous and monophasic, with small respiratory variations and a velocity of no more than 40 cm/s.44 The hepatic artery is located anterior and to the left of the portal vein, with a thickness of less than 5 mm.It has hepatopetal flow characterized by a rapid systolic rise and continuous diastolic flow, a resistive index (RI) of 0.5–0.8 (RI = maximum systolic velocity − maximum diastolic velocity/maximum systolic velocity) and anacceleration time <80 ms. A high RI, often seen in the early post-transplantation stage, may be due to multiple factors that do not imply disease (hypovolemia, vasoactive drugs, anastomotic edema), though due correction is required. In addition, in cases of isolated systolic waves with decreased velocity or the absence of wave, we should consider angioCT and/or emergent revascularization. The suprahepatic veins are anechogenic tubular structures that extend to the IVC, with continuous hepatofugal flow, a velocity of 10−15 cm/s and a pattern that is usually triphasic (Supplementary Video 2).
In kidney grafts, we evaluate the distribution of the renal artery and vein at both hilar level and within the organ parenchyma, using color Doppler to assess the degree of perfusion. The arterial flow approaches the graft with a biphasic wave and a mean RI of 0.5−0.8, while the venous flow is a continuous monophasic wave that moves away from the graft. The velocities are variable and can be affected by several factors just like in the liver, so evolutive exploration over time is useful, and other perfusion tests may be considered if changes occur.45
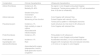
Liver complicationsAlthough ultrasound can help detect different complications (biliomas or biliary tract dilatation, hematomas or seromas, or even rejection), vascular problems are the most relevant complications in the immediate postoperative period (Table 1 and Fig. 4). Since the viability of the graft depends on the rapid detection of these problems, which are associated with high morbidity-mortality, ultrasound is necessary for screening and evolutive monitoring.46–48
Vascular complications of liver transplantation.
| Complication | Clinical characteristics | Ultrasound characteristics |
|---|---|---|
| Arterial thrombosis | Incidence 2−9% | No signal in color Doppler and pulsed Doppler. |
| Mortality 20−60% | Occasional: Tardus-parvus pattern (RI < 0.5 with acceleration time >0.8) due to collaterality | |
| Greater biliary tract involvement | ||
| Arterial stenosis | Incidence 1−8% | Color Doppler with turbulent flow. |
| Worsening of liver function | Pulsed Doppler with velocity >2 m/s | |
| Tardus-parvus pattern in intrahepatic branches | ||
| Pseudoaneurysm | Incidence <1% | Cystic structure at a hilar level in 2D ultrasound |
| High mortality in case of rupture | Color Doppler with turbulent flow | |
| Associated with infection/sepsis | ||
| Portal thrombosis | Incidence <3% | Filling defect in 2D ultrasound |
| No signal in color Doppler and pulsed Doppler | ||
| Portal stenosis | Incidence <1% | Accelerated velocities (×3−4) at anastomotic level |
| Suprahepatic vein stenosis/thrombosis | Rare | Doppler with monophasic flow and reduced velocities (<10 cm/s) or no signal in color Doppler |
| Associated with surgery (disproportion, torsion) | ||
| Graft dysfunction due to congestion |
 and post-stenotic tardus-parvus pattern (B).")
In kidney transplantation, vascular complications (arterial thrombosis/stenosis or venous thrombosis) are the most common problems, and ultrasound is the key tool for detecting them.49 In patients with arterial thrombosis (incidence 1–5%), we observe a hypoechogenic graft with the absence of both arterial and venous flow. In case of venous thrombosis, there is an absence of venous flow with high resistance arterial flow (RI 0.9–1) and high resistance patterns (systolic peaks, diastolic inversion of flow). Stenosis of the renal artery (incidence 1–23%) has the same ultrasound characteristics as stenosis of the hepatic artery, and is usually diagnosed in later controls.
ProceduresParacentesisParacentesis is normally performed in the lower left quadrant at the junction between the external third and the two internal thirds of an imaginary line joining the anterosuperior iliac spine and the navel.6 Ultrasound confirms the presence of fluid and the absence of organs or vessels within the puncture range. The procedure is carried out by placing the patient in the supine position, and the probe is used to locate ascites as an anechoic material above the bowel loops. It is important to visualize the inferior epigastric artery with color Doppler, since it has many anatomical variants and its trajectory may be modified in patients with severe ascites.
Bladder catheterizationUnder normal conditions, we observe an empty bladder with an insufflated cuff (Fig. 1D). If the catheter does not function correctly or has been clamped, we see the catheter at an intravesical level but with a distended bladder. It is advisable to check the position of the catheter in patients with oliguria, since urine output may be a consequence of overflow (catheter pseudo-obstruction).
Nasogastric tubeThere is no standard procedure for the ultrasound assessment of nasogastric tube placement. Some authors only use abdominal ultrasound, while others complement the procedure with cervical ultrasound to visualize the passage of the tube through the esophagus.50
The ultrasound probe is positioned in the epigastric zone, searching for the tube or the metal guide (if any). If the tube is not identified in this zone, we displace the probe towards the left hypochondrium, in search of the stomach, where the digestive tract is identified with the tube and metal guide located in the lumen. If the tube lacks a guide, we can administer 50 ml of ultrasound contrast51 (Supplementary Video 3).
ConclusionsAbdominal ultrasound has innumerable uses in critical patients. Its inclusion in the daily practice of intensivists is of help in the diagnosis, monitoring and treatment of the critically ill, thereby avoiding the need for patient transfers and more invasive tests.
Author contributionsAll the authors have made a substantial contribution to the study conception and design, drafting of the manuscript and critical review of the intellectual content, and have approved the final version of the submitted article.

