
The present study compares the clinical, functional and oncological characteristics of cancer patients assessed for admission to the Intensive Care Unit (ICU), with the aim of identifying factors associated with admission and of developing specific predictive models.
DesignA prospective, multicenter observational study was conducted.
SettingThirty-three ICUs across Spain.
Patients or participantsPatients aged 18 years or older with solid tumors or hematological malignancies who were assessed for ICU admission between January and June 2024 were included.
InterventionsNone.
Main variables of interestDemographic, clinical, functional, oncological, and severity variables were collected. Differences between admitted and non-admitted patients were analyzed using multivariate logistic regression and LASSO-type predictive models.
ResultsA total of 1341 patients were included, of whom 1177 (87.8%) were admitted to the ICU. Neutropenia, younger age, and recent oncologic treatment, among other factors, were associated with a higher likelihood of ICU admission. Patients with metastasis or progression of the hematological disease were less likely to be admitted. The predictive models demonstrated high discriminative capacity for both solid tumors (AUC 0.79) and hematological malignancies (AUC 0.82).
ConclusionsPrognostic models for ICU admission were developed by applying a multivariate approach and selecting variables based on their joint contribution to overall predictive accuracy rather than their isolated contribution. The full model (Model 1) demonstrated the best predictive capacity, with an AUC of 0.79 (95%CI: 0.75−0.84) for solid and an AUC of 0.82 (95%CI: 0.76−0.88) for hematological tumors.
Este estudio analiza comparativamente las características clínicas, funcionales y oncológicas de los pacientes con cáncer, valorados para ingreso en la UCI, con el objetivo de identificar factores asociados a la admisión y desarrollar modelos predictivos específicos.
DiseñoSe realizó un estudio prospectivo, observacional y multicéntrico.
ÁmbitoTreinta y tres servicios de medicina intensiva de España.
Pacientes o participantesSe incluyeron pacientes con edad ≥ 18 años con tumores sólidos o neoplasias hematológicas valorados para ingreso en la UCI entre enero y junio de 2024.
IntervencionesNo hay intervención.
Variables de interés principalesSe recogieron variables demográficas, clínicas, funcionales, oncológicas y de gravedad, analizando diferencias entre los pacientes ingresados y no ingresados mediante regresión logística multivariante y modelos predictivos tipo LASSO.
ResultadosSe incluyeron 1.341 pacientes, ingresando en la UCI 1.177 (87,8%). La neutropenia, una edad menor o haber recibido un tratamiento oncológico reciente, entre otras, se asociaron a una mayor probabilidad de ingreso en la UCI. Los pacientes con metástasis o progresión de enfermedad hematológica presentaron menor probabilidad de ingreso. Los modelos predictivos mostraron una alta capacidad discriminativa tanto para tumores sólidos (con un área bajo la curva [AUC]: 0,79) como hematológicos (AUC: 0,82).
ConclusionesSe han desarrollado modelos predictivos de ingreso en la UCI seleccionando las variables no de forma aislada, sino en función de su contribución conjunta al poder predictivo global. El modelo denominado completo (Modelo 1) mostró la mejor capacidad predictiva, con un AUC: 0,79 (IC 95%: 0,75−0,84) para tumores sólidos y de 0,82 (IC 95%: 0,76−0,88) para tumores hematológicos.
Cancer is one of the leading causes of morbidity and mortality worldwide. It is projected that there will be 21.9 million new cases by 2025.1 Advances in oncological diagnosis and treatment have considerably improved patient prognosis, allowing the implementation of more precise and personalized therapies.2 However, the clinical course of these patients remains heterogeneous, especially in cases of acute decompensation.
Deciding to admit cancer patients to an Intensive Care Unit (ICU) is a significant clinical challenge, particularly when it comes to identifying those patients who would benefit from an ICU stay.3 Traditionally, ICU admission criteria have been restrictive for oncology patients due to the high mortality rates reported in some studies and significant resource consumption.4 However, recent research suggests that in-hospital mortality for this group is not greater than for other groups with severe comorbidities.5 Likewise, ICU admission does not necessarily imply the application of aggressive therapeutic measures. In this regard, multiple admission policies focused on individualized assessment of the patient's condition upon admission have been developed — the most widespread protocol being the time-limited trial (ICU-TLT).6,7
Currently, there is a lack of studies that comprehensively address the factors that determine the admission of cancer patients to the ICU. Most of the available research focuses on specific cohorts or has limitations in the analysis of the interaction between performance status, comorbidities, and recent cancer treatments.8,9 Furthermore, predicting ICU mortality in these patients remains challenging,10 and there is scant literature on why critical oncological patients are rejected for ICU admission, even though the percentage has traditionally been siginificant.11 This gap in the literature prevents the establishment of more objective and standardized criteria for ICU admission decisions, which may affect equity in access to intensive care for these patients.
The present study aimed to analyze and compare the clinical, functional and oncological characteristics of ICU-admitted and non-admitted cancer patients, identify factors associated with admission decisions, and to develop predictive models to estimate ICU admission probability. We hope these findings will contribute to a better understanding of the ICU patient selection process and provide tools to facilitate more objective, evidence-based decision-making.
Material and methodsStudy designThis prospective, multicenter, observational study was registered in ClinicalTrials.gov (NCT06113601) and involved 33 departments of critical care medicine (DICMs) in Spain. Patients were included during a consecutive six-month period, from January 1 to July 1, 2024.
Inclusion and exclusion criteriaPatients aged 18 years or older who were assessed for admission to the DICM and had solid organ tumors or hematological malignancies that were not considered to be cured by the supervising oncologist or hematologist were included in the study. Patients admitted to the DICM and patients whose admission was rejected were both included.
Patients who failed to sign the informed consent form, did not meet the admission severity criteria for the ICU, or had cancer that was considered cured by the referring oncologist or hematologist were excluded from the study.
Sample size and ethical approvalAn estimated sample size of 1000 patients allowed the study characteristics to be calculated with a 95% confidence level and a margin of error of ±3%.
The study was approved by the Clinical Research Ethics Committee (CREC) of the sponsoring center (registry code: 2023/414), and each participating site obtained authorization from its respective CREC. This study has been endorsed by the Spanish Society of Intensive Care Medicine and Coronary Units (SEMICYUC).
Data collection and definitionsThe study included the following variables: demographic data, comorbidities, tumor disease information, ECOG-PS scale,12 Karnofsky index,13 the Clinical Frailty Scale,14 the APACHE-II and SOFA scores at ICU admission, information related to ICU admission, the reason for ICU admission rejection, and ICU and in-hospital mortality variables.
Neutropenia was defined as a neutrophil count of less than 1500/mm3. Hemodynamic instability was defined as the presence of clinical signs suggestive of hypoperfusion.15 The variable "ventilatory support" included the use of high-flow nasal cannulas, noninvasive mechanical ventilation (NIV), and invasive mechanical ventilation. The variable "drug-related complication" in turn referred to a complication derived from onco-hematological treatment that was unrelated to CAR-T cell treatment, which was collected independently.
Statistical analysisQualitative variables were reported as absolute and relative frequencies (%), while quantitative variables were expressed as the mean and standard deviation (SD).
To compare differences between the groups of patients who were and were not admitted to the ICU, parametric or nonparametric tests were used according to the data distribution: Student’s t-test was used for normally distributed continuous variables, and the Mann-Whitney U test was used for non-normally distributed variables. In the case of categorical variables, the chi-square test or Fisher's exact test was used, depending on the magnitude of the expected frequencies. Statistical significance was considered for p < 0.05.
Associations between the study variables and ICU admission were evaluated using multivariate logistic regression models, adjusted for age, sex, ECOG score, and the Karnofsky index due to their potential confounding roles. The results are expressed as odds ratios (ORs) with their respective 95% confidence intervals (95%CIs).
Additionally, we developed predictive models of ICU admission using logistic regression with a LASSO penalty. This method does not select variables according to individual values of statistical significance (e.g., p < 0.05), but rather according to how much they improve the model’s overall accuracy.
The optimal selection of the regularization parameter λ was determined by cross-validation with 10 iterations. Four progressively more complex models were generated, incorporating clinically relevant and statistically significant variables, including initial ECOG score, smoking status, age, neutropenia, alcohol consumption, radiotherapy, and recent cancer treatment.
We evaluated the predictive capacity of each model using the area under the ROC curve (AUROC), with bootstrap-adjusted estimates from 1000 repetitions, and the calculation of 95% confidence intervals. Additionally, analyses were performed in specific subgroups of patients with solid tumors and hematological malignancies to develop differentiated predictive models for each population.
All statistical analyses were performed using the STATA 18/SE® package (StataCorp, College Station, TX, USA).
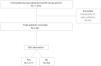
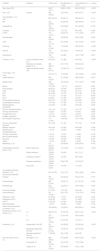
ResultsFig. 1 shows the patient selection process. During the study period, a total of 1375 patients were recruited. Of those patients, 34 were excluded due to an inability to collect their data. A total of 1341 patients were analyzed; 1177 (87.8%) were admitted to the ICU, while 164 (12.2%) were rejected. Table 1 shows the general characteristics of the patients, including those admitted to the ICU and those rejected for admission. Admitted patients had a mean age of 66.2 years (SD: 12.2), whereas non-admitted patients had a mean age of 69.8 years (SD: 10.8). The most frequent tumors were those of gastrointestinal origin (22.6%), followed by genitourinary (14.9%) and pulmonary tumors (12.7%). Hodgkin lymphoma frequently resulted in ICU admission (11.6%). Analyzing the status of the hematological disease revealed that 36.5% of the patients had a recent diagnosis, and 26.47% were experiencing progression.
General characteristics of the patients admitted to the ICU and of those not admitted to the ICU.
| Variable | Category | Total cohort | No admission (n = 164) | Yes admission (n = 1177) | p-value |
|---|---|---|---|---|---|
| Age, mean (SD) | 66.67 (12.11) | 69.83 (10.82) | 66.23 (12.22) | <0.001 | |
| Sex, n (%) | Female | 483 (36.02) | 62 (37.80) | 421 (35.77) | <0.001 |
| Comorbidities, n (%) | 683 (50.93) | 93 (56.71) | 590 (50.13) | 0.114 | |
| AHT | |||||
| DM | 340 (25.35) | 50 (30.49) | 290 (24.64) | 0.107 | |
| Dyslipidemia | 516 (38.48) | 65 (39.63) | 451 (38.32) | 0.745 | |
| Cirrhosis | 60 (4.47) | 12 (7.32) | 48 (4.08) | 0.060 | |
| COPD | 184 (13.72) | 33 (20.12) | 151 (12.83) | 0.011 | |
| Heart disease | 269 (20.06) | 43 (26.22) | 226 (19.20) | 0.035 | |
| CKD | 150 (11.19) | 25 (15.24) | 125 (10.62) | 0.078 | |
| Smoking | 374 (27.89) | 71 (43.29) | 303 (25.74) | <0.001 | |
| Alcohol | 140 (10.44) | 32 (19.51) | 108 (9.18) | <0.001 | |
| Neutropenia | 148 (11.04) | 8 (4.88) | 140 (11.89) | 0.007 | |
| Charlson, n (%) | Low comorbidity burden (0−1) | 56 (4.20) | 3 (1.86) | 53 (4.52) | <0.001 |
| Moderate comorbidity burden (2−3) | 383 (28.73) | 28 (17.39) | 355 (30.29) | ||
| High comorbidity burden (≥4) | 894 (67.07) | 130 (80.75) | 764 (65.19) | ||
| Tumor type, n (%) | 190 (14.17) | 41 (25.00) | 149 (12.66) | <0.001 | |
| Lung | |||||
| Gastrointestinal | 293 (21.85) | 27 (16.46) | 266 (22.60) | 0.075 | |
| Genitourinary | 205 (15.29) | 30 (18.29) | 175 (14.87) | 0.254 | |
| Breast | 70 (5.22) | 11 (6.71) | 59 (5.01) | 0.361 | |
| Gynecological | 39 (2.91) | 4 (2.44) | 35 (2.97) | 0.703 | |
| CNS | 41 (3.06) | 4 (2.44) | 37 (3.14) | 0.623 | |
| ENT | 95 (7.08) | 7 (4.27) | 87 (7.48) | 0.134 | |
| Skin | 17 (1.27) | 2 (1.22) | 15 (1.27) | 0.953 | |
| Bone | 8 (0.60) | 3 (1.83) | 5 (0.42) | 0.029 | |
| Acute myeloid leukemia | 60 (4.47) | 2 (1.22) | 58 (4.93) | 0.031 | |
| Lymphoblastic leukemia | 19 (1.42) | 2 (1.22) | 17 (1.44) | 0.819 | |
| Myelodysplastic syndromes | 32 (2.39) | 3 (1.83) | 29 (2.46) | 0.618 | |
| Chronic myeloid leukemia | 15 (1.12) | 2 (1.22) | 13 (1.10) | 0.896 | |
| Primary myelofibrosis | 4 (0.30) | 0 (0.00) | 4 (0.34) | 0.455 | |
| Polycythemia vera | 1 (0.07) | 1 (0.61) | 0 (0.00) | 0.007 | |
| Hodgkin lymphoma | 25 (1.86) | 0 (0.00) | 25 (2.12) | 0.060 | |
| Non-Hodgkin lymphoma | 151 (11.26) | 14 (8.54) | 137 (11.64) | 0.239 | |
| Chronic lymphocytic leukemia | 20 (1.49) | 2 (1.22) | 18 (1.53) | 0.759 | |
| Multiple myeloma | 54 (4.03) | 6 (3.66) | 48 (4.08) | 0.798 | |
| Waldenstrom’s macroglobulinemia | 1 (0.07) | 0 (0.00) | 1 (0.08) | 0.709 | |
| Primary amyloidosis | 2 (0.15) | 1 (0.61) | 1 (0.08) | 0.103 | |
| Bone marrow aplasia | 1 (0.07) | 0 (0.00) | 1 (0.08) | 0.709 | |
| Sarcoma | 3 (0.22) | 0 (0.00) | 3 (0.25) | 0.517 | |
| Others | 1 (0.07) | 0 (0.00) | 1 (0.08) | 0.709 | |
| Metastasis, n (%) | 311 (36.72) | 62 (48.44) | 249 (34.63) | 0.003 | |
| Hematological disease status, n (%) | Recent diagnosis | 223/641 (34.79) | 12 (19.05) | 211 (36.51) | <0.001 |
| Partial remission | 103/641 (16.07) | 4 (6.35) | 99 (17.13) | ||
| Complete remission | 102/641 (15.91) | 4 (6.35) | 98 (16.96) | ||
| Disease progression | 192/641 (29.95) | 39 (61.90) | 153 (26.47) | ||
| Not known | 21/641 (3.28) | 4 (6.35) | 17 (2.94) | ||
| Oncological treatment received, n (%) | 251 (18.72) | 28 (17.07) | 223 (18.95) | 0.564 | |
| No previous treatment | |||||
| Surgical | 497 (37.06) | 53 (32.32) | 444 (37.72) | 0.179 | |
| Chemotherapy | 690 (51.45) | 79 (48.17) | 611 (51.91) | 0.369 | |
| Radiotherapy | 240 (17.90) | 42 (25.61) | 198 (16.82) | 0.006 | |
| Hormonal therapy | 61 (4.55) | 13 (7.93) | 48 (4.08) | 0.027 | |
| Immunotherapy | 201 (14.99) | 28 (17.07) | 173 (14.70) | 0.425 | |
| Allogeneic HSCT | 34 (2.54) | 1 (0.61) | 33 (2.80) | 0.094 | |
| Autologous HSCT | 32 (2.39) | 1 (0.61) | 31 (2.63) | 0.112 | |
| CAR-T | 34 (2.54) | 0 (0.00) | 34 (2.89) | 0.027 | |
| Other treatments | 1 (0.07) | 0 (0.00) | 1 (0.08) | 0.709 | |
| Recent cancer treatment | 726 (56.94) | 74 (49.01) | 652 (58.01) | 0.036 | |
| (3 months), n (%) | |||||
| Performance status, n (%) | 0−1 | 900 (67.37) | 57 (35.19) | 843 (71.81) | <0.001 |
| ECOG, n (%) | |||||
| 2 | 275 (20.58) | 51 (31.48) | 224 (19.08) | ||
| 3−4 | 161 (12.05) | 54 (33.33) | 107 (9.11) | ||
| Karnofsky, n (%) | Independent (100−80) | 811 (62.34) | 56 (35.90) | 755 (65.94) | <0.001 |
| Moderately dependent (79−50) | 416 (31.98) | 72 (46.15) | 344 (30.04) | ||
| Severely dependent (49−10) | 74 (5.69) | 28 (17.95) | 46 (4.02) | ||
| Clinical Frailty Scale, n (%) | Not fragile (1−3) | 869 (68.64) | 67 (42.95) | 802 (72.25) | <0.001 |
| Vulnerable (4) | 202 (15.96) | 26 (16.67) | 176 (15.86) | ||
| Fragile (5−9) | 195 (15.40) | 63 (40.38) | 132 (11.89) |
CAR-T: chimeric antigen receptor T-cell therapy; DM: diabetes mellitus; ECOG: Eastern Cooperative Oncology Group; COPD, chronic obstructive pulmonary disease; CKD, chronic kidney disease; AHT, arterial hypertension; ENT, ear, nose and throat; CNS, central nervous system; HSCT, hematopoietic stem cell transplantation; ICU, Intensive Care Unit.
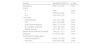
Table 2 describes the variables that were independently associated with ICU admission. Neutropenia (OR: 2.38; 95%CI: 1.12−5.05; p = 0.024), gastrointestinal tumors (OR: 2.42; 95%CI: 1.37−4.30; p = 0.002), ear, nose and throat (ENT) malignancies (OR: 3.65; 95%CI: 1.49−8.96; p = 0.005), acute myeloid leukemia (OR: 4.89; 95%CI: 1.11−21.54; p = 0.036), non-Hodgkin lymphoma (OR: 3.03; 95%CI: 01.46−6.30; p = 0.003), multiple myeloma (OR: 2.81; 95%CI: 1.06−7.41; p = 0.037), or having received radiotherapy within the three months before assessment was associated with an increased likelihood of admission (OR: 1.46; 95%CI: 1.01−2.11; p = 0.045).
Factors associated with ICU admission in the multivariate analysis.
| Variable | Adjusted OR (95% CI) | p-value |
|---|---|---|
| Neutropenia | 2.38 (1.12−5.05) | 0.024 |
| ECOG | ||
| 0−1 | 1(ref.) | 0.016 |
| 2 | 0.39 (0.18−0.84) | 0.015 |
| 3−4 | 0.20 (0.05−0.73) | |
| Tumor type | ||
| Gastrointestinal | 2.42 (1.37−4.30) | 0.002 |
| ENT | 3.65 (1.49−8.96) | 0.005 |
| Acute myeloid leukemia | 4.89 (1.11−21.54) | 0.036 |
| Non-Hodgkin lymphoma | 3.03 (1.46−6.30) | 0.003 |
| Multiple myeloma | 2.81 (1.06−7.41) | 0.037 |
| Recent cancer treatment (3 months) | 1.46 (1.01−2.11) | 0.045 |
| Metastasis | 0.61 (0.40−0.93) | 0.020 |
| Hematological disease status | ||
| Disease progression | 0.26 (0.13−0.52) | <0.001 |
| Not known | 0.23 (0.06−0.84) | 0.026 |
95% CI, 95% confidence interval; ECOG: Eastern Cooperative Oncology Group; OR, odds ratio; ENT, ear, nose and throat.
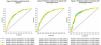
Predictive models of ICU admission were developed for the total cohort, as well as for patients with solid and hematological tumors (Fig. 2). Upon analyzing the types of neoplasms, Model 1, the full model, showed the best predictive capacity, with an area under the curve (AUC) of 0.79 (95%CI: 0.75−0.84) for solid malignancies and 0.82 (95%CI: 0.76−0.88) for hematological tumors.
Predictive models of ICU admission.
A: Predictive models for all the patients: Model 1: Initial ECOG score, smoking status, age, neutropenia, alcohol consumption, radiotherapy, oncological treatment within the last three months; Model 2: Initial ECOG score, smoking status, age, neutropenia, alcohol consumption, radiotherapy; Model 3: Initial ECOG score, smoking status, age, neutropenia, alcohol consumption; Model 4: Initial ECOG score, smoking status, age, neutropenia.
B: Predictive models for the patients with solid organ tumors: Model 1: Initial ECOG score, smoking status, alcohol consumption, metastasis, oncological treatment within the last three months, ENT tumor, gastrointestinal tumor, neutropenia, radiotherapy; Model 2: Initial ECOG score, smoking status, alcohol consumption, metastasis, oncological treatment within the last three months, ENT tumor, neutropenia, radiotherapy; Model 3: Initial ECOG score, smoking status, alcohol consumption, metastasis, oncological treatment within the last three months, ENT tumor, neutropenia; Model 4: Initial ECOG score, smoking status, alcohol consumption, metastasis, oncological treatment in last three months, ENT tumor.
C: Predictive models in the patients with hematological tumors: Model 1: Hematological malignancy status, initial ECOG score, age, smoking status, alcohol consumption, neutropenia, radiotherapy, acute myeloid leukemia; Model 2: Hematological malignancy status, initial ECOG score, age, smoking status, alcohol consumption, neutropenia, radiotherapy; Model 3: Hematological malignancy status, initial ECOG score, age, smoking status, alcohol consumption, neutropenia; Model 4: Hematological malignancy status, initial ECOG score, age, smoking status, alcohol consumption.
For solid tumors, the model included the following variables: ECOG score at admission, smoking and alcohol consumption habits, metastasis status, cancer treatment within the previous three months, ENT or gastrointestinal tumor status, neutropenia status, and radiotherapy status. For hematological malignancies, the variables included in the model were hematological malignancy status, initial ECOG score, age, smoking and alcohol consumption history, neutropenia, radiotherapy, and acute myeloid leukemia.
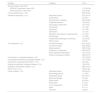
Table 3 shows the characteristics of the patients who were admitted after evaluation by the DICM. The most common reasons for ICU admission were respiratory failure (n = 273, 25.1%) and hemodynamic instability (n = 246, 22.7%). Regarding the treatments applied in the ICU, 55% (n = 647) of the patients required ventilatory support, and 58.6% (n = 690) required vasoactive drugs. Of those admitted, 21.4% (n = 251) died during their hospital stay. The most frequent cause of death was multiorgan failure (64.3%). In 22.9% (n = 210) of the patients, measures to limit therapeutic efforts were applied in the ICU.
Characteristics of the patients admitted to the ICU.
| Variable | Category | N (%) |
|---|---|---|
| Severity scales, mean (SD) | ||
| APACHE II admission, mean (SD) | 17.53 (8.48) | |
| SOFA admission. mean (SD) | 5.44 (3.99) | |
| Tumor-related reason, n (%) | 699 (59.49) | |
| Reason for admission, n (%) | Respiratory failure | 273 (25.14) |
| Renal failure | 36 (3.31) | |
| Hemodynamic instability | 246 (22.65) | |
| Suspected infection | 102 (9.39) | |
| Neurological impairment | 101 (9.30) | |
| Dehiscence | 13 (1.20) | |
| Perforation | 15 (1.38) | |
| Obstruction | 17 (1.57) | |
| Resection brain space-occupying lesion | 13 (1.20) | |
| Hemorrhage | 31 (2.85) | |
| Programmed postsurgical monitoring | 102 (9.39) | |
| Other causes | 9 (0.83) | |
| ICU treatments, n (%) | Ventilatory support | 647 (54.97) |
| Vasoactive drugs | 690 (58.62) | |
| Blood products | 393 (33.48) | |
| Antibiotics or antifungals | 820 (69.73) | |
| Renal replacement therapies | 144 (12.27) | |
| Enteral or parenteral nutrition | 389 (33.13) | |
| Complication of underlying disease, n (%) | 374 (32.02) | |
| Drug-related complication neoplastic disease, n (%) | 187 (16.58) | |
| Complication associated with CAR-T, n (%) | 29 (2.62) | |
| Surgical complication neoplastic disease, n (%) | 104 (9.28) | |
| Subsidiary readmission registry, n (%) | 385 (34.13) | |
| Death in ICU, n (%) | 251(21.45) | |
| Cause of death, n (%) | Multiorgan failure | 232 (64.27) |
| Hemorrhagic shock | 11 (3.05) | |
| Respiratory failure | 65 (18.01) | |
| Brain hemorrhage | 9 (2.49) | |
| Septic shock | 25 (6.93) | |
| Brain death | 5 (1.39) | |
| Tumor progression | 2 (0.55) | |
| Other | 4 (1.11) | |
| Unknown | 8 (2.22) | |
LTE: limitation of therapeutic effort; APACHE II: Acute Physiology and Chronic Health Evaluation II; CAR-T: chimeric antigen receptor T-cell therapy; SOFA: Sequential Organ Failure Assessment; ICU: Intensive Care Unit.
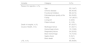
Table 4 shows the characteristics of the patients whose admission to the ICU was rejected. The most frequent reasons were futility (66%, n = 101) and chronic disease (n = 69, 45.4%). Of those patients not admitted to the ICU, 87 (53.7%) died during their hospital stay.
Characteristics of the patients rejected for admission to the ICU.
| Variable | Category | N (%) |
|---|---|---|
| Reason for rejection, n (%) | ||
| Age | 22 (14.47) | |
| Chronic disease | 69 (45.39) | |
| Functional limitation | 68 (44.74) | |
| Estimated poor quality of life | 84 (54.90) | |
| Futility | 101 (66.01) | |
| Living will | 4 (2.63) | |
| Patient refusal | 2 (1.35) | |
| Death in hospital, n (%) | 87 (53.37) | |
| Cause of death, n (%) | Multiorgan failure | 41 (42.71) |
| Hemorrhagic shock | 15 (15.62) | |
| Respiratory failure | 24 (25.00) | |
| Brain hemorrhage | 10 (10.42) | |
| Septic shock | 5 (5.21) | |
| Brain death | 1 (1.04) | |
| LTE, n (%) | 69 (49.64) |
LTE: limitation of therapeutic effort.
This study deepens our understanding of the profile of cancer patients who require ICU admission following an acute event. We generated predictive models of ICU admission for patients with solid organ tumors and hematological malignancies, taking into account the degree to which each variable contributes to the model’s overall predictive capacity.
Through a comparative analysis of ICU-admitted patients and those rejected for admission, we have gained a better understanding of the determinants of this critical decision. To date, only one comparative study has been conducted between oncology patients admitted to the ICU versus those not admitted. The results of the present study suggest a probable loosening of ICU admission criteria for cancer patients over the last two decades (90% admitted in our series of 2025, compared to 51% in 2005), though potential investigator selection bias cannot be excluded (e.g., possible non-inclusion of patients who were not included in the sample). Furthermore, Thiery et al. published a study16 in which 26% of the patients deemed too ill to benefit from ICU admission were still alive on day 30, and 16.7% were still alive on day 180. In our study, 46.63% of the patients who were not admitted survived their hospital stay.
Regarding the factors that influence ICU admission, age has consistently been considered an important factor in ICU admission decisions for cancer patients.17,18 Studies have been carried out on oncology patients over 65 years of age, reporting ICU mortality rates similar to those found in the non-cancer population.19 In our sample, there were significant differences in the mean age of the patients admitted to the ICU versus those not admitted (66 versus 69 years; p < 0.001). Despite this, the results confirm a greater probability of ICU admission for non-elderly patients. Similarly, the mean age of the patients admitted to the ICU was seen to be lower than in previous studies conducted in our setting,20 which may reflect the impact of advances in early cancer detection.21
As already noted by Bos et al., although more women than men with cancer are registered, a higher proportion of male patients are admitted to the ICU.22 The exact reason why severe events occur more frequently in men is unclear, but it may be related to variations in epidemiology, pathophysiology, presentation, severity, and response to treatment, due to the significant impact of sex hormones on the immune and cardiovascular systems.23
All the studied basal performance status scales (Clinical Frailty Scale, Karnofsky-PS, and ECOG-PS) have limitations. In our study, however, we incorporated the ECOG scale into all the predictive models, since it improves the overall ability to predict ICU admission. The ECOG-PS is an easy-to-use tool that is widely used in cancer patients. However, some studies have reported a high degree of interprofessional variability in its application.24 There is currently a need to develop dynamic and more objective tools to assess functionality in cancer patients.25,26 In our work, we have proposed creating predictive models by selecting variables according to their joint contribution to the overall predictive power. Our findings encourage us to advance toward precision oncology27 and explore new scales, such as the Clinical Frailty Scale.28
One relevant finding of our study is that the patients who received cancer treatment within three months prior to an acute event were more likely to be admitted to the ICU. This observation underscores the importance of close monitoring and preventive management for these patients because recently receiving cancer-specific treatment seems to predispose them to developing serious complications. Some studies have focused on the early detection of complications in cancer patients and have found that daily joint rounds (DICM-Oncology and/or Hematology) and early warning systems can identify complications before they require ICU admission.29 Similarly, studies have shown that mortality increases by 1.05% for each hour of delay in critical patients.30 Thus, optimizing algorithms based on vital signs and biomarkers, providing personnel with specific training in the detection of clinical deterioration, and establishing rapid response teams could significantly improve the prognosis of these patients.31,32 The predictive models developed in our study to predict the need for ICU admission constitute valuable tools for identifying high-risk patients, optimizing resource allocation, and improving clinical decision-making in the ICU.
Cancer patients are particularly susceptible to developing serious infections due to multiple factors, including immunosuppression resulting from the cancer treatments and associated organ dysfunction. However, diagnosing sepsis in these patients can be difficult because conditions such as cytokine release syndrome after CAR-T therapy or tumor lysis syndrome can present similarly. In the present study, 16.58% of the patients experienced a drug-related complication, with 2.62% suffering a CAR-T therapy-related complication. These findings underscore the urgent need for more precise diagnostic tools to differentiate between these conditions, thereby optimizing management and treatment.33
Upon analyzing the reasons for rejecting ICU admission, we found that futility and poor estimated quality of life were the reasons most frequently cited by intensivists. The ADENI-UCI study,34 carried out in 62 Spanish ICUs, analyzed the variables associated with decisions to reject ICU admission as a limitation of life-support treatment measure. Twenty-eight percent of the patients had some type of neoplasm, and poor estimated quality of life was also one of the most frequent reasons for rejection.
The mortality rate among patients admitted to the ICU was 21.45%, a figure similar to that reported in the ONCO-ENVIN registry,9 where the mortality rate was 27.5% among cancer patients admitted for medical reasons. Among patients not admitted to the ICU, 53.37% died during their hospital stay. Thus, a significant subgroup of patients survived their hospital stay without ICU admission. This underscores the complexity of the decision-making processes, which should be carried out by multidisciplinary teams, in both the initial assessment of acute deterioration and over follow-up during hospitalization.35
One of the most important limitations of our study is the difference between the total number of patients included in the ICU admission group and the number of patients not included. This discrepancy could be explained by the inherent difficulty of asking patients who have been rejected, either by themselves or their families, to participate in a study. It could also be due to the progressive relaxation of the ICU admission criteria for cancer patients in our country. The exact number of excluded patients who, despite meeting the inclusion criteria, could not be recruited because they did not sign the informed consent form is not known.
In conclusion, in the present study, we have developed predictive models of ICU admission by selecting variables according to their joint contribution to the overall predictive power, not in isolation. The so-called complete model (Model 1) demonstrated the greatest predictive capacity, with an area under the curve (AUC) of 0.79 (95%CI: 0.75−0.84) for solid tumors and 0.82 (95%CI: 0.76−0.88) for hematological malignancies. The most frequent cause of ICU admission was respiratory failure, and more than half of the patients required ventilatory support. Gastrointestinal malignancies among solid tumors and Hodgkin lymphoma among hematological neoplasms were the diagnoses that most frequently resulted in ICU admission.
CRediT authorship contribution statementStudy design: Elena Cuenca Fito and Inés Gómez-Acebo.
Statistical analysis: Inés Gómez-Acebo.
Data acquisition: Elena Cuenca Fito, Eric Mayor-Vázquez, Cándido Díaz Lagares, Bárbara Vidal Tegedor, Noelia Isabel Lázaro Martín, Alba López Fernández, Laura Sanchez Montori, Íñigo Isern, Amparo Cabanillas Carrillo, Jorge Sánchez Gómez, Maria Luisa Gómez Grande, Alba Fernández Rodríguez, Anastasio Espejo, Domingo Díaz Díaz, Alejandra García Roche, Margarita Márquez, Mireya Molina Cortés, Natalia Valero, Manuel Gracia Romero, Fernando Eiras Abalde, Juan Higuera Lucas, Noelia Albalá Martínez, María Del Mar Jiménez Quintana, Alberto Orejas Gallego, Rosa María de la Casa, Diana Monge Donaire, Amanda Lesmes González de Aledo, Ariadna Bellès Casas, Lucía Larrañaga Sigwald, Sandra Portillo Sánchez, Alfredo Bardal Ruiz, Inés Lipperheide, Jimena Luján Varas, Carola Gimenez-Esparza Vich, Paula Recena Pérez and Maricela Jiménez-López.
Draft of the article, critical review of the intellectual content, and final approval of the presented version of the manuscript: Elena Cuenca Fito, Cándido Díaz Lagares, Eric Mayor-Vázquez, and Inés Gómez Acebo.
Declaration of Generative AI and AI-assisted technologies in the writing processNo AI was used.
Financial supportThe present study has received no funding.
The authors declare that they have no conflicts of interest.