To determine the role of plasma procalcitonin (PCT) levels in diagnosing ventilator-associated pneumonia.
DesignA systematic review of publications prospectively assessing the diagnostic role of PCT in ventilator-associated pneumonia was carried out. The search was performed using Medline, Embase, the Cochrane Collaboration and MEDION, with reviewing of the references of retrieved articles. We extracted data that allowed the calculation of sensitivity, specificity, likelihood ratios and diagnostic odds ratio.
InterventionMetaregression was performed to determine whether exposure to previous antibiotic treatment, the time to occurrence of ventilator-associated pneumonia and the type of patients had an impact upon the diagnostic performance of procalcitonin.
ResultsSeven studies were considered (373 patients, 434 episodes). We found no publication bias or threshold effect. High plasma PCT levels were associated to an increased risk of suffering ventilator-associated pneumonia (OR: 8.39; 95% CI: 5.4–12.6). The pooled data on sensitivity, specificity, positive and negative likelihood ratio, and diagnostic odds ratio found were 76% (69–82), 79% (74–84), 4.35 (2.48–7.62), 0.26 (0.15–0.46) and 17.9 (10.1–31.7), respectively. Diagnostic yield was modified by prior exposure to antibiotics (rDOR 0.11, 0.02–0.069), but not by the type of critically ill patient or the time to occurrence of ventilator-associated pneumonia.
ConclusionsOur results suggest that PCT provides additional information on the risk of VAP. Inclusion of PCT in diagnostic algorithms could improve their effectiveness.
Determinar el papel de los niveles plasmáticos de procalcitonina (PCT) en el diagnóstico de neumonía asociada a ventilación mecánica.
DiseñoRevisión sistemática y metaanálisis de los trabajos originales que evalúan el papel de PCT en el diagnóstico de neumonía asociada a ventilación mecánica. La búsqueda de trabajos se llevó a cabo en Medline, Embase, Colaboración Cochrane y MEDION y tras revisión de las referencias de los artículos obtenidos. Se extrajeron datos que permitieron el cálculo de la sensibilidad, la especificidad, las razones de verosimilitud y la odds ratio diagnóstica.
IntervenciónMetarregresión para determinar si la exposición a tratamiento antibiótico previo, el tiempo de desarrollo de neumonía y el tipo de paciente crítico tienen impacto en el rendimiento diagnóstico de la procalcitonina.
ResultadosSe incluyeron 7 estudios (373 pacientes, 434 episodios). No encontramos sesgos de publicación ni efecto umbral. Las cifras elevadas de PCT plasmática se asocian a un mayor riesgo de padecer neumonía (OR 8,39; IC 95% 5,4-12,6). Los datos agrupados de sensibilidad, especificidad, razón de verosimilitud positiva y negativa y odds ratio diagnóstica encontrados son, respectivamente, 76% (69-82), 79% (74-84), 4,35 (2,48-7,62), 0,26 (0,15-0,46) y 17,9 (10,1-31,7). El rendimiento diagnóstico se ve modificado por la exposición previa a antibióticos (rORD 0,11, 0,02-0,069), no así por el tipo de paciente crítico o el tiempo de desarrollo de neumonía.
ConclusionesNuestros resultados muestran que la PCT aporta información adicional respecto al riesgo de sufrir neumonía asociada a ventilación mecánica. Su inclusión en los algoritmos diagnósticos podría mejorar la capacidad de los mismos.
Ventilator-associated pneumonia (VAP) is a serious problem in critically ill patients. Despite great efforts to prevent VAP, it remains very common and is regarded as one of the main quality of care indicators, since it accounts for up to 25% of all nosocomial infection episodes seen in Departments of Intensive Care Medicine.1 No less important is the high risk of recurrence (in the order of 25%), particularly associated to the development of septic shock or adult respiratory distress syndrome,2 and its impact upon patient mortality. Indeed, VAP has been associated with a mortality risk of 35%, which proves even higher when associated among other factors to inappropriate treatment, the development of severe sepsis or bacteremia, or when VAP is late in manifesting or causes respiratory failure.3
The diagnosis of VAP presents still unresolved problems that complicate early and adequate antibiotic treatment capable of reducing the risk of life-threatening situations in the Department of Intensive Care Medicine. The diagnosis is fundamentally clinical, combining radiological criteria (appearance of new infiltrates or progression of already existing infiltrates), evidence of respiratory deterioration (PO2/FiO2), and signs of both local (purulent bronchorrhea) and systemic inflammatory reaction (fever/hypothermia, leukopenia/leukocytosis).4 An adequate diagnosis requires microbiological confirmation, however, and this may take 3–5 days. From the microbiological perspective, gram staining of the respiratory secretions and anticipative rapid cultures can help establish both the diagnosis and the treatment strategy–thereby shortening the response times.5
Procalcitonin (PCT) is a soluble protein composed of 116 amino acids with a sequence identical to that of the calcitonin prohormone, produced under normal conditions by the C cells of the thyroid gland secondary to internal PCT proteolysis. The basal circulating levels are very low (<0.05ng/ml).6 Situations of sepsis, bacterial infections or severe inflammatory reactions increase expression of the CALC-1 gene, favoring the production of PCT in all tissues (including lung, liver, kidney, adipocytes and muscle), and in all differentiated cells of the body. The levels increase quickly 2–3h after the triggering stimulus,7 remaining stable both in vivo and in vitro, and laboratory assay based on immunoanalytical methods allows reliable determination of the plasma concentrations.
Procalcitonin is used in the diagnosis of sepsis, for differentiating bacterial infections from other causes of systemic inflammatory reaction, as a severity marker, and as a prognostic element in the evaluation of the impact of antibiotic treatment and in certain organic infections.8–10 The role of PCT in the diagnosis of VAP has been investigated in a limited number of studies, with conflicting results.11 The joint utilization of clinical criteria, preliminary microbiological data and plasma PCT levels could allow early diagnosis and treatment, thereby contributing to lessen the impact of VAP.
The present study was carried out to determine the usefulness of the plasma PCT levels in diagnosing VAP and to identify possible factors capable of modifying the diagnostic performance of the molecule.
Patient and methodsA systematic review and metaanalysis was carried out in accordance with the published guides referred to diagnostic tests,12,13 with the purpose of determining the true usefulness of the plasma PCT levels in diagnosing VAP in adult critical patients.
Search strategy and selection of articlesAn exhaustive literature search was made of the PubMed and Embase databases, as well as of specific diagnostic study databases such as MEDION, and the Cochrane Collaboration, using the following Keywords: «procalcitonin», «plasma procalcitonin», «biomarkers», «diagnosis», «nosocomial pneumonia», «ventilator-associated pneumonia», «sensitivity and specificity» and «critical patients», applying filters for the detection of studies in humans, in adults, without language restrictions, and eliminating systematic reviews and review articles, and focusing mainly on prospective studies, clinical studies and clinical trials conducted in the last 20 years. The search in turn was expanded by means of a manual review of the references of the most relevant articles.
Search strategy: («procalcitonin pneumonia»[tw] OR «procalcitonin»[MeSH term] OR «biomarkers» [MeSH term]) AND («diagnosis»[MeSH term] OR «diagnosis»[tw] OR «diagnos*»[tw] OR «sensitivity»[tw] OR «specificity»[tw] OR «sensitivity and specificity»[MeSH term]) AND («nosocomial pneumonia»[MeSH term] OR «ventilator-associated pneumonia» [MeSH term] OR «ventilator-associated pneumonia»[tw] OR «VAP»[tw]) AND («critical care»[tw]) OR («critical illness»[tw]).
Two authors independently identified the articles to be included in the systematic review–any disagreement being settled by a third reviewer. The compiled studies were required to prospectively document plasma PCT levels and their relation to the development of VAP or diagnostic performance data, allowing individual reconstruction of the 2×2 tables (PCT values versus diagnosis of VAP). The degree of concordance between the two reviewers was determined using the Cohen K statistic.
The flow of studies derived from the literature analysis is represented following the recommendations of the PRISMA declaration,14 along with the analysis of the methodological quality of the included studies based on the Quality Assessment of Diagnostic Accuracy Studies (QUADAS-2).15 The criteria of the STARD initiative were used both for assessment of the studies included in the present work and for preparation of the manuscript.16
Data collectedThe following data were collected from the selected articles: type of study, sample size (number of patients and number of VAP episodes), type of critical patient, inclusion/exclusion criteria, diagnostic criteria for pneumonia and reference tests used, previous antibiotic treatment, time of appearance of pneumonia (early/late), analytical method for determining PCT levels, cutoff points used, PCT values in patients with or without VAP, mortality rate and items allowing the assessment of methodological quality (QUADAS-2).
Statistical analysisData processing was carried out with Meta-DiSc 1.4 (Clinical Biostatistics Unit of Ramón y Cajal Hospital, Madrid, Spain)17 and EPIDAT 3.1 (epidemiological analytical program of the Junta de Galicia, Spain).18
As a first step, and since the different articles used different plasma PCT cutoff points, we determine the presence or absence of a «threshold effect» by analyzing the relationship between the sensitivity and the specificity of the studies, calculating the Spearman correlation coefficient (in the presence of a threshold effect a significant inverse correlation would be observed between sensitivity and specificity), and by plotting the receiver operating characteristic (ROC) curve for sensitivity versus 1-specificity.19 As a second step, the absence of a threshold effect would allow the weighted calculation of sensitivity, specificity, positive or negative likelihood ratios (LR+/LR−) and diagnostic odds ratios (DORs), calculated by using the random effects model of DerSimonian–Laird together with the model proposed by Moses et al.20
In the opposite case, i.e., in the presence of a threshold effect, the averaging of indexes would not be possible, and the ROC curve21 would be shown as a summary of the diagnostic performance of PCT in VAP, with calculation of the Q* index, defined as the point at which sensitivity and specificity are equal.
Apart from the analysis of the degree of methodological homogeneity, the study of the heterogeneity of the articles was assessed by means of the Q statistic (chi-squared test) in order to determine whether the difference between studies is greater than expected from chance–accepting significance for a chi-squared test with p<0.10–and by means of the inconsistency index (I2),22 in an attempt to quantify such heterogeneity (considering the latter to be appreciable in the case of I2>50%). The above in turn was complemented by the Galbraith plot, which represents a measure of effect (standardized OR) versus a measure of precision. The impact of certain cofactors such as the type of patients, methodological quality, the presence of antibiotic treatment, and the development of early or late pneumonia upon the diagnostic performance and heterogeneity of the studies was evaluated using metaregression techniques or subgroups analysis, as required.21
The existence of possible publication bias was assessed based on funnel plots and the regression test of Begg and Egger.23
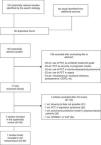
ResultsThe initial literature search yielded 1700 articles, which were reduced to 167 publications on considering only prospective clinical studies carried out over the last two decades and involving adult critical patients. Following detailed evaluation, these studies were further reduced to 11 articles, of which 7 were finally selected and included in the metaanalysis.24–30 Of the four excluded articles, two were rejected because valid results for analysis could not be drawn; a third was rejected because it evaluated PCT in the differential diagnosis of pneumonia versus aspiration pneumonitis; and the fourth was excluded because it assessed the role of PCT as a risk variable in the development of VAP among polytraumatized patients within the context of multivariate models–not as a diagnostic tool31–34 (Fig. 1).
Characteristics of the included studiesThe 7 publications analyzed comprised a total of 373 medical-surgical or medical patients and 434 suspected VAP episodes, all admitted to the Department of Intensive Care Medicine. Only one study comprised patients admitted to the Intensive Care Unit (ICU) after cardiac arrest. The patients were included consecutively in all the studies, and the inclusion criteria were mechanical ventilation for at least 48h (7 days in one study and over 72h in another), and the presence of radiological, clinical and laboratory test data consistent with pneumonia. If the inclusion criteria were met, a blood sample was collected for the determination of PCT, and diagnostic confirmation was established by microbiological criteria (bronchoalveolar lavage in 6 studies and tracheal aspiration in one publication). Table 1 summarizes the principal characteristics of the mentioned studies.
Studies included in the systematic review.
| Episodes (patients) | Type of patient | Reference test (cutoff point) | Previous antibiotic | Number of VAP/no VAP | PCT values in VAP | PCT values in no VAP | Cutoff point (ng/ml) | Mortality | Early/late VAP | |
| Luyt et al. (2008)24 | 73 (41) | Mixed | BAL (104) | 84% | 32/41 | 1.07 (0.39–6.5) | 1.40 (0.67–3.3) | >0.5–2 | NP ICU 41% | NP |
| Zhou et al. (2006)25 | 61 (61) | Mixed | BAL (104) | No | 34/27 | NP | NP | >0.5 | NP | Late |
| Charles et al. (2009)26 | 70 (70) | Mixed | TA (106) | No | 47/23 | 5.5±9.4 | 0.7±1.2 | >0.5 | NP | Late |
| Jung et al. (2010)27 | 86 (57) | Medical | BAL (104) | 69% | 48/38 | 0.55 (0.2–2.7) | 1.13 (0.3–3.5) | >0.5 | NP ICU 40% | 24% early |
| Ramirez et al. (2008)28 | 20 (20) | Medical | BAL (104) | 11% | 9/11 | 3.86 (2.9–11.3) | 0.76 (0.31–0.9) | >2.9 | NP | Late |
| Dufló et al. (2002)29 | 96 (96) | Mixed | Micro-BAL (104) | No | 44/52 | 11.5 (5.9–17) | 1.5 (1.1–1.9) | 3.9 | 64%, without VAP 48% | NP |
| Oppert et al. (2002)30 | 28 (28) | Post-CRA | BAL (104) | No | 12/16 | 6.0 (1.1–15.0) | 0.6 (NP) | >1 | 42%, without VAP 13% | 91% early |
TA: tracheal aspirate; BAL: bronchoalveolar lavage; VAP: ventilator-associated pneumonia; NP: data not published; CRA: cardiorespiratory arrest; PCT: procalcitonin; ICU: Intensive Care Unit.
In all the studies quantitative blood PCT determinations were made based on immunoassay techniques using time-resolved amplified cryptate emission technology (TRACE) with a Kryptor® analyzer (Brahms Diagnostica, Berlin, Germany).
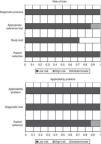
Quality of the studies and publication biasThe QUADAS-2 questionnaire, designed to evaluate the methodological quality of diagnostic test studies, includes four domains that analyze the patients included in the studies, the diagnostic tests evaluated, the references tests, patent flow within the study and the time of the final diagnosis (flow and timing). Each evaluated aspect in turn is classified as presenting low risk of bias, high risk of bias, or indeterminate bias (in the event of insufficient data in the publication to answer the corresponding question).
In the studies included in our review, all the patients were consecutively enrolled, case-control designs were avoided, and there were no inappropriate exclusions. In all the studies the threshold values (PCT cutoff points) were previously specified, and in 5 of the 7 articles the study test was evaluated without knowing the result of the reference test (in the other 2 studies this aspect was not specified). In all of the studies the reference test was interpreted independently of the PCT levels, and in 6 of the 7 publications we considered that the reference test correctly classified the patients. The time interval between conduction of the diagnostic test and the reference test was appropriate, and all patients were subjected to reference testing and included in the subsequent analyses.
On the other hand, in over 85% of the studies (6 out of 7) the patient profile was representative of the population subjected to testing in routine practice; the screening criteria were clearly described; both the study and reference tests were applied to the entire patient sample (avoiding differential and partial verification bias, respectively); both tests (blood PCT assay and reference test) were reproducible; and the same clinical information was available for interpreting the test results as that available in routine clinical practice. Fig. 2 graphically summarizes the risks of bias in each of the four domains of the questionnaire, as well as the application problems that may be found on the basis of the results obtained.
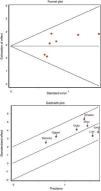
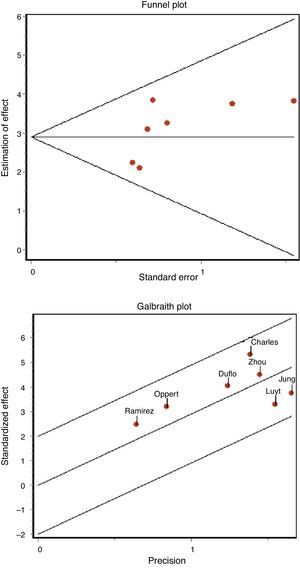
The concordance between the two investigators in assessing methodological quality was high, with a kappa index of 0.86 (95% confidence interval (95%CI) 0.66–1.04). We found no evidence of publication bias either graphically (Fig. 3A) or on applying the Begg (Z: 1.501, p=0.133) or Egger statistics (t: 1.657, df 5, p=0.158).
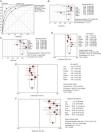
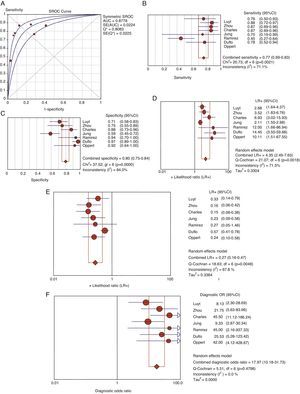
Usefulness of procalcitonin in the diagnosis of ventilator-associated pneumoniaThe patients with evident clinical manifestations and high plasma PCT levels were at an increased risk of suffering VAP (69% versus 8.8%, OR 8.39, 95%CI 5.4–12.6). The Spearman correlation coefficient between sensitivity and specificity, 0.667 (p=0.102), was not indicative of a threshold effect, thus allowing calculation of the average of the different diagnostic indexes. In this regard, we respectively recorded sensitivity 76.7% (95%CI 69–82), specificity 79.9% (95%CI 74–84), LR+ 4.35 (95%CI 2.48–7.62), LR− 0.26 (95%CI 0.15–0.46) and DOR 17.9 (95%CI 10.1–31.7) (Fig. 4).
Area under the curve (A) for the diagnosis of VAP. Summary of the values referred to sensitivity (B), specificity (C), positive (LR+) (D) and negative likelihood ratio (LR−) (E) and diagnostic odds ratio (F) of plasma PCT in VAP.
AUC: area under the curve. SE: standard error. Q*: Q* point as global test performance parameter.
No heterogeneity was noted either with the Q statistic (chi-squared 5.50, p=0.48) or graphically (Fig. 3B). The graphic representation of the pooled values of the different diagnostic indexes showed some inconsistency, with the exception of DOR–this leading us to perform the analysis of subgroups. We examined diagnostic performance according to the different plasma PCT cutoff points and in patients without exposure to antibiotic treatment and in situations of late VAP. Table 2 shows the results obtained.
Pooled results of the different diagnostic indexes.
| CS (no.) | S (%) | Sp (%) | LR+ | LR− | DOR | ||
| Total studies | 7 (434) | 76 (69–82) | 79 (74–84) | 4.35 (2.48–7.62) | 0.26 (0.15–0.46) | 17.9 (10–31.7) | Q*=0.808; AuROC=0.87 |
| PCT>0.5 | 4 (230) | 83 (75–89) | 60 (52–68) | 2.5 (1.11–5.66) | 0.28 (0.1–0.76) | 9.24 (1.6–53.1) | Q*=0.88; AuROC=0.94 |
| PCT>1 | 4 (262) | 62 (50–74) | 79 (73–85) | 3.85 (1.8–8.3) | 0.48 (0.34–0.66) | 10.5 (4.9–22.2) | Q*=0.75; AuROC=0.81 |
| PCT>3 | 2 (116) | 48 (31–66) | 96 (89–99) | 13.5 (4.2–42.9) | 0.55 (0.4–0.75) | 28.7 (7.1–116) | Q*=0.81; AuROC=0.88 |
| Without ATB | 4 (255) | 74 (65–81) | 89 (83–94) | 6.1 (3.2–11.4) | 0.25 (0.10–0.64) | 30.6 (14–56) | NA |
| Late | 4 (208) | 86 (78–92) | 74 (66–81) | 3.94 (1.9–8.1) | 0.18 (0.11–0.31) | 20.25 (9.4–43.5) | Q*=0.852; AuROC=0.91 |
ATB: antibiotic treatment; AuROC: area under the ROC curve; Sp: specificity; CS: clinical studies; LR+: positive likelihood ratio; LR−: negative likelihood ratio; no.: number of patients; NA: not applicable; DOR: diagnostic odds ratio; PCT: procalcitonin; S: sensitivity.
By generating a regression (metaregression) model, we can analyze the impact of certain cofactors, included in the model as independent variables, upon diagnostic validity (DOR), which constitutes the dependent variable in the model. The exponential transformation of the coefficients of each independent variable indicates the change in the diagnostic performance of the test, and the result is expressed as relative DOR (rDOR). In our study the diagnostic performance of plasma PCT was lowered by previous exposure to antibiotics (rDOR 0.11; 95%CI 0.02–0.069). In contrast, no such effects were recorded for the type of critical patients (rDOR 1.08, 95%CI 0.25–4.74), the methodological quality of the studies (rDOR 1.04; 95%CI 0.59–1.83) or the timing of the development of VAP (rDOR 2.91; 95%CI 0.37–2.28). These results confirm those shown in Table 2 and have a greater explanatory and hypothesis-generating potential than the demonstration of statistical evidence alone.17,21
DiscussionThe rapid and precise diagnosis of VAP continues to pose a challenge, as reported by Rea-Neto et al.35 in a recent systematic review in which important between-observer variability was observed in the use of clinical scales, with diagnostic accuracy that did not increase with the addition of microbiological data. The authors drew these conclusions from studies taking histopathological tests as reference, and considered quantitative microbiological cultures as the diagnostic equivalent to be used in clinical practice.36 This approach, although little used in our setting where qualitative cultures predominate, should be evaluated with a view to incorporating it to routine practice in our Units.5,37 Blood cultures show low performance (in the range of 25%),5 and in this respect the results of cytological tests and the utilization of biomarkers appear promising.11 Specifically, the usefulness of PCT as a prognostic marker and as a guide to treatment appears clear, while its use in the diagnosis of localized infections remains to be defined.
Following the GRADE recommendations,38 diagnostic tests are useful only if they improve patient outcome. The accuracy of these tests is merely an indirect indicator of such clinical relevance. Deducing that increased diagnostic precision is equivalent to improved clinical outcome implies the existence of effective treatment for VAP episodes.
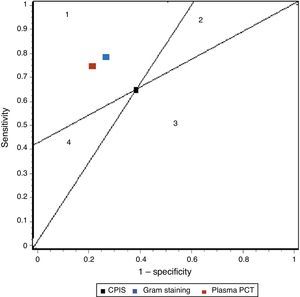
In our study we recorded adequate diagnostic behavior of the PCT levels in VAP in terms of sensitivity, specificity and DOR. All patients with evident clinical manifestations presented a 17-fold increased risk of suffering VAP in the presence of elevated plasma PCT levels versus patients in which the PCT levels were normal or low. These results improve upon those published by Shan et al.39 in a recent metaanalysis of the role of the Pugin (Clinical Pulmonary Infection Score), and are comparable to those obtained by O’Horo et al.40 in another recent study on the role of gram staining in bronchial secretions, referred to the diagnosis of VAP (see summary in Table 3). Fig. 5 offers a graphic comparison of the diagnostic tests according to the results obtained by the mentioned metaanalyses.
Summary of the results of the metaanalysis of diagnostic tests in ventilator-associated pneumonia.
| Sensitivity | Specificity | LR+ | LR− | DOR | |
| CPIS | 65% (61–69) | 64% (60–67) | 1.94 (1.44–2.68) | 0.46 (0.32–0.66) | 4.85 (2.42–9.71) |
| Gram | 79% (72–91) | 75% (73–78) | 3.16 (NP) | 0.28 (NP) | 16.44 (10.5–25.6) |
| PCT | 76% (69–82) | 79% (74–84) | 4.35 (2.48–7.62) | 0.26 (0.15–0.46) | 17.9 (10.1–31.7) |
CPIS: Clinical Pulmonary Infection Score; LR+: positive likelihood ratio; LR−: negative likelihood ratio; NP: data not published; DOR: diagnostic odds ratio; PCT: procalcitonin.
Representation of the sensitivity and specificity of the Clinical Pulmonary Infection Score (CPIS), PCT and gram staining. The lines traced from coordinates (0.0) and (1.1) generate four spaces that allow the inter-comparison of tests. Area 1: better performance; area 2: better only if negative result; area 3: always poorer; area 4: only better if positive result.
Despite failure of the statistical tests to detect a threshold effect, diagnostic variation was noted according to the plasma PCT cutoff point. Since these were patients with suspected VAP, and therefore with relatively high pre-test probabilities (≥40%), the use of low cutoff points (PCT<0.5) is associated to a non-negligible number of false positive results and, therefore, to a risk of over-treatment, toxicity and the development of resistances–in turn balanced by a greater proportion of true positive results that lessen the risk of a poor outcome or recurrences. High cutoff points (PCT>3), always in situations of high pre-test probability, imply a larger proportion of false negative results and the risk of late diagnosis, septic complications and poorer outcome.
The diagnostic performance of the plasma PCT levels proved better in patients without previous antibiotic treatment. Their true usefulness in early pneumonias remains to be established, though on the basis of the findings referred to late pneumonia, the performance of the plasma PCT levels in patients with prolonged stays does not appear to decrease. We found no evidence of publication bias capable of contaminating the results obtained, though a certain heterogeneity was noted in relation to the type of critical patient involved.
It is well known that elevated plasma PCT levels are not specific of organic infection, and may be due to infections in other locations. However, the fact that the studies involved patients with a strong suspicion of respiratory infection and mean PCT levels appreciably lower than those published in other critical care contexts makes this possibility less likely.
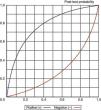
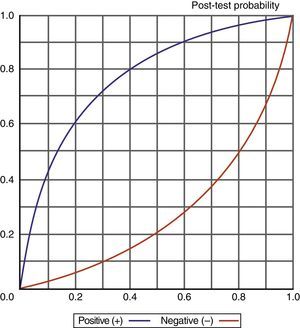
Knowledge of the values obtained for the different diagnostic indexes, and particularly of the likelihood ratios (LR+/LR−), also allows us to determine (adopting a probabilistic approach) the probability of suffering a VAP episode according to whether the test proves positive or negative, as shown in Fig. 6.
However, the true usefulness of plasma PCT levels in VAP should be established following their incorporation to the diagnostic algorithms and after evaluating their impact upon the management and especially the outcome of critical patients.
Among the limitations of our study, mention must be made of the few published articles, which implies a relatively small number of included patients, and on the other hand causes the statistical tests to be scantly consistent. This fact does not allow us to firmly establish the true impact of factors such as antibiotic treatment, the role of PCT in early or late pneumonias, or the ideal cutoff point. On the other hand, the assessment of publication bias has not been fully standardized in the context of metaanalyses of diagnostic tests–though it appears to be clear that there is a relationship between elevated PCT levels and the risk of suffering VAP in patients with suggestive clinical data. This makes the existence of significant unpublished studies capable of changing the sense of the association rather unlikely. Lastly, it must be mentioned that the type of patients included did not cover the full spectrum of critical patients, and this consequently questions the validness of generalizing the results obtained.
In conclusion, assuming that a rapid diagnosis of VAP episodes must be based on the sum of clinical, radiological and laboratory test findings, together with anticipative microbiological information (e.g., gram staining), plasma PCT levels offer real-time information allowing us to establish the probability of suffering VAP and to start empirical antibiotic treatment capable of palliating its impact upon critical patient outcome. These PCT levels represent a complement to the known use of PCT in guiding antibiotic therapy and as a prognostic marker. It is necessary to clarify the true value of these plasma levels in early pneumonia, the potential impact of previous antibiotic treatments and immune modulating therapies upon diagnostic performance, and their behavior in the different types of critical patients.
Financial supportThis study has received no financial support.
Conflicts of interestThe authors declare that they have no conflicts of interest.
Please cite this article as: Sotillo-Díaz JC, Bermejo-López E, García-Olivares P, Peral-Gutiérrez JA, Sancho-González M, Guerrero-Sanz JE. Papel de la procalcitonina plasmática en el diagnóstico de la neumonía asociada a ventilación mecánica: revisión sistemática y metaanálisis. Med Intensiva. 2014;38:337–346.


