


To evaluate the predictive ability of mortality prediction scales in cancer patients admitted to intensive care units (ICUs).
DesignA systematic review of the literature was conducted using a search algorithm in October 2022. The following databases were searched: PubMed, Scopus, Virtual Health Library (BVS), and Medrxiv. The risk of bias was assessed using the QUADAS-2 scale.
SettingICUs admitting cancer patients.
ParticipantsStudies that included adult patients with an active cancer diagnosis who were admitted to the ICU.
InterventionsIntegrative study without interventions.
Main variables of interestMortality prediction, standardized mortality, discrimination, and calibration.
ResultsSeven mortality risk prediction models were analyzed in cancer patients in the ICU. Most models (APACHE II, APACHE IV, SOFA, SAPS-II, SAPS-III, and MPM II) underestimated mortality, while the ICMM overestimated it. The APACHE II had the SMR (Standardized Mortality Ratio) value closest to 1, suggesting a better prognostic ability compared to the other models.
ConclusionsPredicting mortality in ICU cancer patients remains an intricate challenge due to the lack of a definitive superior model and the inherent limitations of available prediction tools. For evidence-based informed clinical decision-making, it is crucial to consider the healthcare team's familiarity with each tool and its inherent limitations. Developing novel instruments or conducting large-scale validation studies is essential to enhance prediction accuracy and optimize patient care in this population.
Realizar una revisión sistemática de la literatura para evaluar la capacidad predictiva de las escalas utilizadas en la predicción de mortalidad en pacientes con cáncer admitidos en unidades de cuidados intensivos.
DiseñoSe realizó una revisión sistemática cualitativa de la literatura, con un algoritmo de búsqueda en octubre de 2022, ajustado a las bases de datos virtuales: PubMed, Scopus, Biblioteca virtual en salud (BVS) y Medrxiv. El riesgo de sesgos se evaluó con la escala QUADAS-2.
ÁmbitoUnidades de cuidados intensivos con admisión de pacientes oncológicos.
ParticipantesEstudios que incluyeron pacientes adultos con diagnóstico activo de cáncer, que fueron admitidos a UCI.
IntervencionesEstudio integrativo sin intervenciones.
Variables de interés principalesPredicción de mortalidad, mortalidad estandarizada, discriminación y calibración.
ResultadosSe analizaron 7 modelos de predicción de riesgo de mortalidad en pacientes con cáncer en UCI. La mayoría de los modelos (APACHE II, APACHE IV, SOFA, SAPS-II, SAPS-III y MPM II) subestimaron la mortalidad, mientras que el ICMM la sobreestimo. El APACHE II tuvo el valor de SMR (Standardized Mortality Ratio) más cercano a 1, lo que sugiere una mejor capacidad pronóstica en comparación con los demás modelos.
ConclusionesLa predicción de mortalidad en pacientes con cáncer en la UCI es compleja. No existe un modelo que sea claramente superior a los demás. Las herramientas disponibles presentan limitaciones en cuanto a su exactitud. Se recomienda tener en cuenta la familiaridad del equipo médico y las limitaciones intrínsecas de cada modelo para tomar decisiones informadas en la evidencia. Es necesario desarrollar nuevos instrumentos o realizar estudios de validación a gran escala para mejorar la predicción de la mortalidad en este grupo de pacientes.
Cancer is one of the main causes of morbidity-mortality in the world, and the burden it poses is expected to continue growing over the coming decades.1 In the year 2019, there were 23.6 million incident cases of cancer worldwide and 10 million deaths because of the disease.2 Although advances in treatment have improved the survival statistics, there has also been an increase in complications and the need for admission to the Intensive Care Unit (ICU).3 The admission of cancer patients to the ICU has been the subject of controversy, due to their perceived poor prognosis and the existing competition for limited resources.3 At present there is only limited literature on the characteristics of the patients admitted to the ICU, their condition upon admission, evolution during ICU stay, and critical outcomes such as mortality.
Different studies have attempted to identify the best prognostic scale for predicting mortality in cancer patients in the ICU, thereby facilitating their admission and promoting therapeutic efforts in this particular patient group. A number of such scales have been validated in the general population, but in the case of cancer patients, none have been found to be sufficiently precise or particularly superior to the rest.4–7 Investigation of the validity of mortality predicting scales in patients admitted to the ICU due to an acute condition related to neoplastic disease or the treatment received could facilitate clinical decision-making, including the decision to admit the patient to intensive care, guide the therapeutic effort, and allow correct adjustment to the available resources. The present review was carried out to evaluate the prognostic performance of validated mortality risk scales (APACHE, SAPS, SOFA, MPM, ICMM) in cancer patients requiring admission to the ICU.
MethodologyResearch questionBased on the PIRD strategy (see Table 1), the following question was raised: “What is the calibration and discriminating capacity of the mortality prognostic scales in oncological patients in the ICU?
Research question of the PIRD model.
| P (Population) | Patients diagnosed with cancer and admitted to the ICU |
| I (Index test) | Prognostic scales (SOFA, APACHE, SAPS, MPM, ICMM) |
| R (Reference test) | Observed in-hospital mortality |
| D (Diagnosis of interest) | Discrimination and calibration of the mortality prognostic scales |
A selection was made of studies involving patients over 18 years of age with an active cancer diagnosis (regardless of stage) admitted to the ICU. Pregnant patients were excluded. With regard to the types of studies, we included retrospective and prospective cohort studies, with no language restrictions. Articles not containing information on the performance of a prognostic model of mortality were excluded.
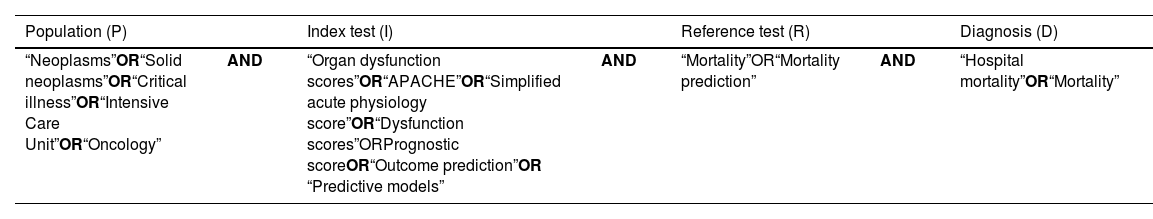
Search strategyA systematic literature search without language restrictions was made of the following electronic databases in October 2022: PubMed, Scopus, Virtual Health Library (VHL) and medRxiv. The following MeSH terms were used, differentiated according to the components of the research question: “Neoplasms”, “Oncology”, “Critical Illness”, “Intensive Care Units”, “Mortality”, “Mortality Prediction”, “Hospital Mortality”, “APACHE”, “Simplified Acute Physiology Score”, “Organ Dysfunction Scores”, “Prognostic Score”, “Outcome prediction” and “Predictive models” (Table 2). In addition, a snowball search strategy was adopted that allowed the inclusion of two additional relevant articles that met the selection criteria. A total of 12 studies were finally included in the systematic review. The present study was registered in PROSPERO (CRD42023441046 – available at https:// https://www.crd.york.ac.uk/prospero/#recordDetails).
Search strategy.
| Population (P) | Index test (I) | Reference test (R) | Diagnosis (D) | |||
|---|---|---|---|---|---|---|
| “Neoplasms”OR“Solid neoplasms”OR“Critical illness”OR“Intensive Care Unit”OR“Oncology” | AND | “Organ dysfunction scores”OR“APACHE”OR“Simplified acute physiology score”OR“Dysfunction scores”ORPrognostic scoreOR“Outcome prediction”OR “Predictive models” | AND | “Mortality”OR“Mortality prediction” | AND | “Hospital mortality”OR“Mortality” |
The articles of the initial search were independently evaluated by four investigators on a blind basis. The studies were first assessed from the title and abstract, and the selected articles were then subjected to full-text evaluation, with the application of the inclusion and exclusion criteria. There was no specified discrimination according to the index test and reference model in the global studies. Observed mortality was therefore regarded as the reference test for comparison, and the index tests corresponded to the evaluated scales (Fig. 1).
Data extraction
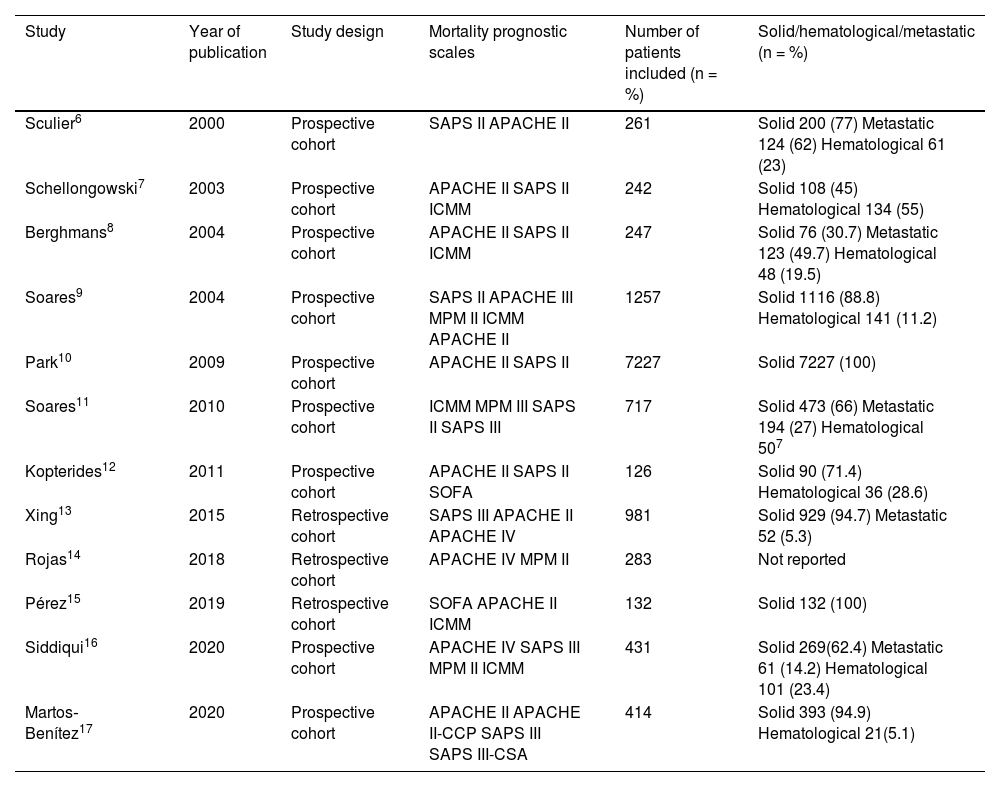
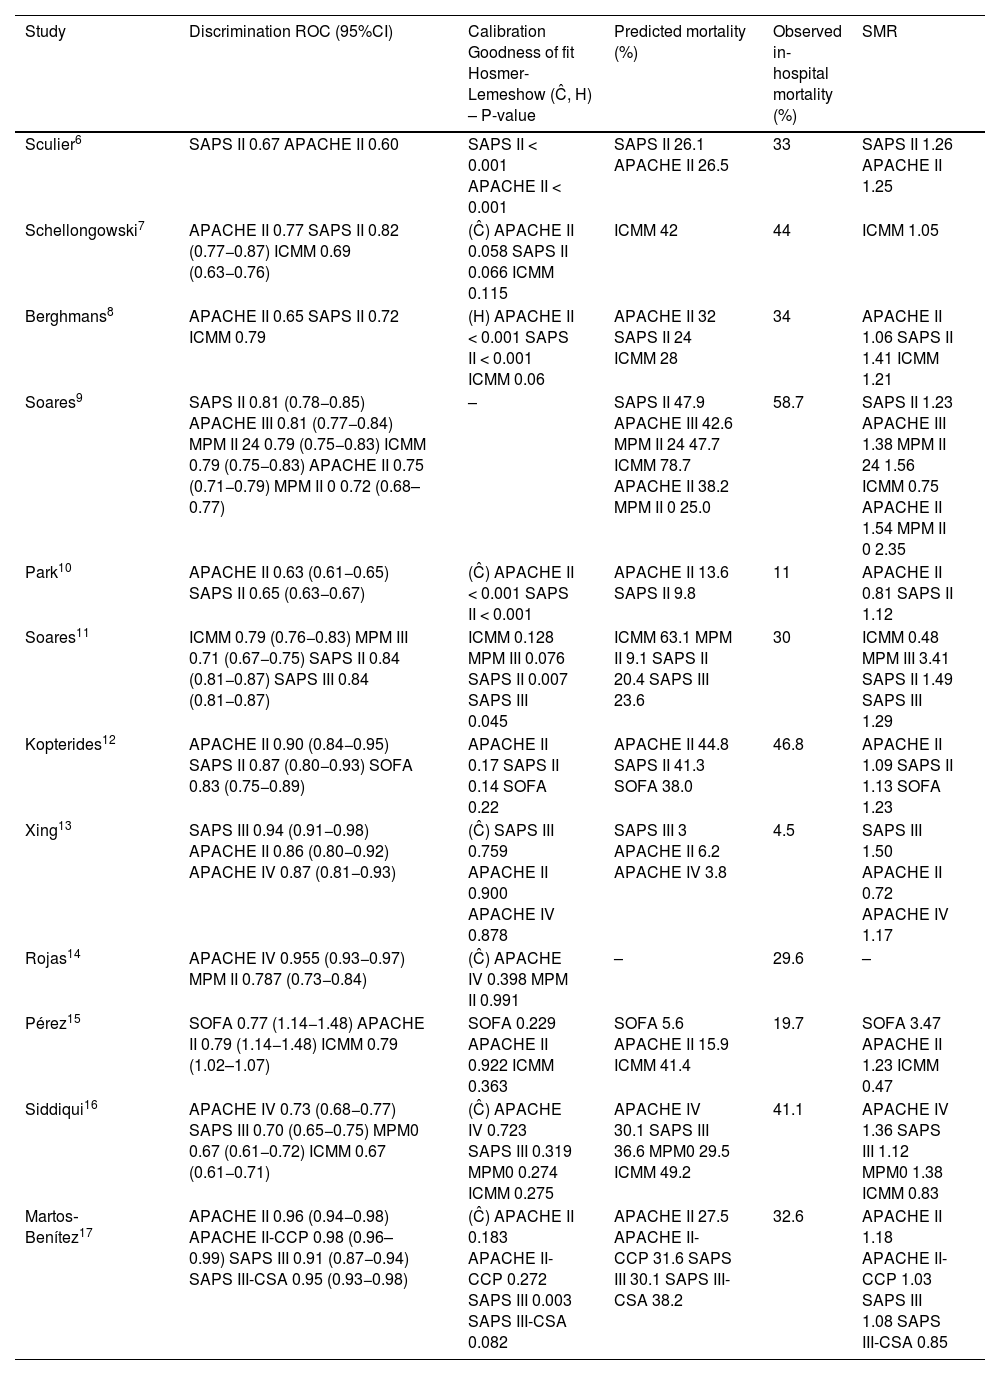
Two investigators independently extracted and entered the information from the studies into an Excel spreadsheet. The instrument was constructed by consensus among the investigators, with the variables of interest, ordered chronologically by date of publication. The studies were analyzed by number of patients and type of cancer (solid, hematological and metastatic [advanced disease]). Data reporting was standardized in the form of percentages (Table 3). The discrimination and calibration values of each scale were obtained, and the observed and predicted mortality data were used to calculate the standardized mortality ratio (SMR) (Table 4).
Characteristics of the studies included in the systematic review.
| Study | Year of publication | Study design | Mortality prognostic scales | Number of patients included (n = %) | Solid/hematological/metastatic (n = %) |
|---|---|---|---|---|---|
| Sculier6 | 2000 | Prospective cohort | SAPS II APACHE II | 261 | Solid 200 (77) Metastatic 124 (62) Hematological 61 (23) |
| Schellongowski7 | 2003 | Prospective cohort | APACHE II SAPS II ICMM | 242 | Solid 108 (45) Hematological 134 (55) |
| Berghmans8 | 2004 | Prospective cohort | APACHE II SAPS II ICMM | 247 | Solid 76 (30.7) Metastatic 123 (49.7) Hematological 48 (19.5) |
| Soares9 | 2004 | Prospective cohort | SAPS II APACHE III MPM II ICMM APACHE II | 1257 | Solid 1116 (88.8) Hematological 141 (11.2) |
| Park10 | 2009 | Prospective cohort | APACHE II SAPS II | 7227 | Solid 7227 (100) |
| Soares11 | 2010 | Prospective cohort | ICMM MPM III SAPS II SAPS III | 717 | Solid 473 (66) Metastatic 194 (27) Hematological 507 |
| Kopterides12 | 2011 | Prospective cohort | APACHE II SAPS II SOFA | 126 | Solid 90 (71.4) Hematological 36 (28.6) |
| Xing13 | 2015 | Retrospective cohort | SAPS III APACHE II APACHE IV | 981 | Solid 929 (94.7) Metastatic 52 (5.3) |
| Rojas14 | 2018 | Retrospective cohort | APACHE IV MPM II | 283 | Not reported |
| Pérez15 | 2019 | Retrospective cohort | SOFA APACHE II ICMM | 132 | Solid 132 (100) |
| Siddiqui16 | 2020 | Prospective cohort | APACHE IV SAPS III MPM II ICMM | 431 | Solid 269(62.4) Metastatic 61 (14.2) Hematological 101 (23.4) |
| Martos‐Benítez17 | 2020 | Prospective cohort | APACHE II APACHE II-CCP SAPS III SAPS III-CSA | 414 | Solid 393 (94.9) Hematological 21(5.1) |
The year of publication of each study is shown, together with the type of study, the mortality prognostic scale evaluated, sample size (n = %) and type of cancer (solid/hematological/metastatic) (n = %).
General predictive performance of prognostic models in cancer patients admitted to the ICU.
| Study | Discrimination ROC (95%CI) | Calibration Goodness of fit Hosmer-Lemeshow (Ĉ, H) – P-value | Predicted mortality (%) | Observed in-hospital mortality (%) | SMR |
|---|---|---|---|---|---|
| Sculier6 | SAPS II 0.67 APACHE II 0.60 | SAPS II < 0.001 APACHE II < 0.001 | SAPS II 26.1 APACHE II 26.5 | 33 | SAPS II 1.26 APACHE II 1.25 |
| Schellongowski7 | APACHE II 0.77 SAPS II 0.82 (0.77−0.87) ICMM 0.69 (0.63−0.76) | (Ĉ) APACHE II 0.058 SAPS II 0.066 ICMM 0.115 | ICMM 42 | 44 | ICMM 1.05 |
| Berghmans8 | APACHE II 0.65 SAPS II 0.72 ICMM 0.79 | (H) APACHE II < 0.001 SAPS II < 0.001 ICMM 0.06 | APACHE II 32 SAPS II 24 ICMM 28 | 34 | APACHE II 1.06 SAPS II 1.41 ICMM 1.21 |
| Soares9 | SAPS II 0.81 (0.78−0.85) APACHE III 0.81 (0.77−0.84) MPM II 24 0.79 (0.75−0.83) ICMM 0.79 (0.75−0.83) APACHE II 0.75 (0.71−0.79) MPM II 0 0.72 (0.68–0.77) | – | SAPS II 47.9 APACHE III 42.6 MPM II 24 47.7 ICMM 78.7 APACHE II 38.2 MPM II 0 25.0 | 58.7 | SAPS II 1.23 APACHE III 1.38 MPM II 24 1.56 ICMM 0.75 APACHE II 1.54 MPM II 0 2.35 |
| Park10 | APACHE II 0.63 (0.61−0.65) SAPS II 0.65 (0.63−0.67) | (Ĉ) APACHE II < 0.001 SAPS II < 0.001 | APACHE II 13.6 SAPS II 9.8 | 11 | APACHE II 0.81 SAPS II 1.12 |
| Soares11 | ICMM 0.79 (0.76−0.83) MPM III 0.71 (0.67−0.75) SAPS II 0.84 (0.81−0.87) SAPS III 0.84 (0.81−0.87) | ICMM 0.128 MPM III 0.076 SAPS II 0.007 SAPS III 0.045 | ICMM 63.1 MPM II 9.1 SAPS II 20.4 SAPS III 23.6 | 30 | ICMM 0.48 MPM III 3.41 SAPS II 1.49 SAPS III 1.29 |
| Kopterides12 | APACHE II 0.90 (0.84−0.95) SAPS II 0.87 (0.80−0.93) SOFA 0.83 (0.75−0.89) | APACHE II 0.17 SAPS II 0.14 SOFA 0.22 | APACHE II 44.8 SAPS II 41.3 SOFA 38.0 | 46.8 | APACHE II 1.09 SAPS II 1.13 SOFA 1.23 |
| Xing13 | SAPS III 0.94 (0.91−0.98) APACHE II 0.86 (0.80−0.92) APACHE IV 0.87 (0.81−0.93) | (Ĉ) SAPS III 0.759 APACHE II 0.900 APACHE IV 0.878 | SAPS III 3 APACHE II 6.2 APACHE IV 3.8 | 4.5 | SAPS III 1.50 APACHE II 0.72 APACHE IV 1.17 |
| Rojas14 | APACHE IV 0.955 (0.93−0.97) MPM II 0.787 (0.73−0.84) | (Ĉ) APACHE IV 0.398 MPM II 0.991 | – | 29.6 | – |
| Pérez15 | SOFA 0.77 (1.14−1.48) APACHE II 0.79 (1.14−1.48) ICMM 0.79 (1.02–1.07) | SOFA 0.229 APACHE II 0.922 ICMM 0.363 | SOFA 5.6 APACHE II 15.9 ICMM 41.4 | 19.7 | SOFA 3.47 APACHE II 1.23 ICMM 0.47 |
| Siddiqui16 | APACHE IV 0.73 (0.68−0.77) SAPS III 0.70 (0.65−0.75) MPM0 0.67 (0.61−0.72) ICMM 0.67 (0.61−0.71) | (Ĉ) APACHE IV 0.723 SAPS III 0.319 MPM0 0.274 ICMM 0.275 | APACHE IV 30.1 SAPS III 36.6 MPM0 29.5 ICMM 49.2 | 41.1 | APACHE IV 1.36 SAPS III 1.12 MPM0 1.38 ICMM 0.83 |
| Martos‐Benítez17 | APACHE II 0.96 (0.94−0.98) APACHE II-CCP 0.98 (0.96–0.99) SAPS III 0.91 (0.87−0.94) SAPS III-CSA 0.95 (0.93−0.98) | (Ĉ) APACHE II 0.183 APACHE II-CCP 0.272 SAPS III 0.003 SAPS III-CSA 0.082 | APACHE II 27.5 APACHE II-CCP 31.6 SAPS III 30.1 SAPS III-CSA 38.2 | 32.6 | APACHE II 1.18 APACHE II-CCP 1.03 SAPS III 1.08 SAPS III-CSA 0.85 |
The areas under the receiver operator curve (ROC) are shown, along with the p-value corresponding to the Hosmer–Lemeshow goodness of fit for the H or Ĉ statistics, and the SMR for the individual mortality predictive models.
SOFA, Sequential Organ Failure Assessment; APACHE, Acute Physiology and Chronic Health Evaluation; ICMM, ICU Cancer Mortality Model; MPM, Mortality Probability Model; ROC, receiver operator curve; SAPS, Simplified Acute Physiology Score; SMR, standardized mortality rate; -, not provided.
External validity was assessed by analysis of the study population, generalization and random error. Internal validity in turn was assessed by determining information, selection and confounding bias. Evaluation of the methodological quality and risk of bias of the primary studies included in the systematic review was made by paired application of the QUADAS-2 (Quality Assessment of Diagnostic-Accuracy Studies) tool (Fig. 2), specifically designed for assessing the quality of diagnostic test studies. According to our criteria, good study quality was defined by a risk of bias of under 25%, while moderate quality corresponded to 25–50%, and low quality was defined by a risk of bias of over 50%.
 Risk of bias and applicability plot: Author assessment related to each domain and presented as a percentage in all the included studies. (b) Risk of bias: Author assessment related to each domain for each study.")
Evaluation of the methodological quality of the included studies using the QUADAS-2 checklist. (a) Risk of bias and applicability plot: Author assessment related to each domain and presented as a percentage in all the included studies. (b) Risk of bias: Author assessment related to each domain for each study.
Major differences between the studies were observed, with important variability regarding the number of patients included, direction in time, classification of the type of cancer, and the mortality scales evaluated. Thus, in this stage of the review, the studies were considered to be too heterogeneous to be combined in a meta-analysis, and the decision was made to only carry out a qualitative systematic review of the literature. The narrative synthesis was established from the evaluation of the operative characteristics of the mortality scales and the most significant outcomes.
ResultsThe search strategy yielded a total of 424 articles, of which 36 were excluded due to duplication, and 364 based on reading of the title and abstract. Twenty-four studies were subjected to full-text evaluation, and 14 were excluded according to population criteria (non-oncological patients, subjects under 18 years of age, and general hospitalization cases), index test (studies validating only a single scale), reference test (studies failing to document predicted mortality) and outcome (studies not describing calibration and discrimination). The complementary snowball search strategy yielded two additional articles, resulting in a total of 12 studies included in the systematic review (Fig. 1).
Seven predictive models were identified: ICU Cancer Mortality Model (ICMM), Mortality Probability Model (MPM), Sequential Organ Failure Assessment (SOFA), Simplified Acute Physiology Score II (SAPS-II), Simplified Acute Physiology Score III (SAPS-III), Acute Physiology and Chronic Health Evaluation II (APACHE II) and Acute Physiology and Chronic Health Evaluation IV (APACHE IV). Of the 12 articles, 9 corresponded to prospective cohort studies and three to retrospective cohort studies. Most of the articles included patients with solid tumors, advanced (metastatic) disease, and hematological malignancies.
Quality assessmentThe results of the methodological evaluation of the studies included in the systematic review are shown in Fig. 2. In general, the studies presented good methodological quality and the observed risk of bias was low. The main problem of bias in the evaluation corresponded to the application of the index test since most of the studies failed to specify cut-off points for the interpretation of discrimination and calibration. The studies with the best methodological quality were those of Schellongowski7 and Kopterides,12 while the poorest quality corresponded to the studies of Pérez,15 Rojas14 and Xue Zhong Xing.13 The remaining articles, published by Sculier,6 Berghmans,8 Soares 2004,9 Park,10 Soares 2009 11, Siddiqui16 and Martos-Benítez,17 were of moderate quality. Good applicability was consistently observed in all the studies.
Evaluation of discrimination and calibrationThe studies evaluated the predictive capacity of the scales through discrimination of the area under the curve (AUC) and calibration using the Hosmer-Lemeshow goodness of fit for H or Ĉ, interpreted with the p-value. Discrimination measures the probability that a patient who died had a higher predicted mortality risk than a patient who survived. An AUC = 0.5 indicates that there are no differences between applying the scale or not, while AUC = 1 indicates that the model is perfect, AUC > 0.8 indicates that the model is adequate, AUC = 0.6 to 0.8 indicates that the model is moderate, and AUC < 0.6 indicates that the model is deficient. Calibration in turn compares the probabilities referred to predicted mortality and observed mortality. The selected studies used the Hosmer-Lemeshow goodness of fit for H or Ĉ test, assessed with the p-value, where p < 0.05 indicates a significant difference between observed mortality and predicted mortality, while p > 0.05 suggests an estimate that is closer to reality.
Use was made of the standardized mortality rate (SMR) to compare observed and predicted mortality. In this regard, SMR = 1 indicates that the model is perfect, while SMR < 1 implies that the model overestimates mortality, and SMR > 1 indicates that the model underestimates mortality (Table 4).
Analysis of prognostic scalesAPACHE II. This scale was evaluated in 9 of the articles,6–10,12,13,15,17 of which 7 were prospective cohort studies6–10,12,17 and two were retrospective studies.13,15 The number of patients ranged between 126 and 5767, corresponding to the publications of Kopterides12 and Park 2009.10 Patients with solid tumors, advanced disease and hematological malignancies were included. Low to good discrimination was observed, with AUC between 0.60 and 0.96, in the studies of Sculier 20006 and Martos-Benitez 2020.17 Most of the studies showed poor calibration with SMR (>1) between 1.06–1.54, which resulted in uniform underestimation of mortality risk. Two studies reported SMR < 1, corresponding to the largest studies, published by Park 200910 and Xing 2015,13 respectively.
APACHE III. This scale was not taken into account in the conclusions of the review, since it was only evaluated in a single article published by Soares 20049 – a prospective observational cohort study with 542 patients. Solid tumors and hematological malignancies were included. Good discrimination was reported, with AUC = 0.81. Calibration yielded SMR = 1.38, indicative of the underestimation of mortality.
APACHE IV. This scale was evaluated in three of the articles,13–15 of which two were prospective observational cohort studies13,14 and one was a retrospective study.16 The number of patients ranged between 283–981, corresponding to the publications of Rojas 201814 and Xing 2015.13 Patients with solid tumors, advanced disease and hematological malignancies were included. Moderate to good discrimination was observed, with AUC between 0.73 and 0.95. Calibration yielded SMR = 1.17–1.36, indicative of the underestimation of mortality.
No significant differences were observed indicating superior prognostic performance among the different versions of the APACHE scale (II, III and IV). The three models may underestimate mortality in oncological patients.
SOFA. This scale was evaluated in two of the articles,12,15 of which one involved a prospective design12 while the other was a retrospective study.15 An average of 129 patients were included of which over 94% had solid tumors. The study carried out by Kopterides 201112 showed good discrimination capacity, with AUC = 0.83, while the study published by Pérez 201915 presented moderate discrimination, with AUC = 0.77. Both studies showed low calibration, with p < 0.22, and both underestimated mortality, with SMR > 1.23.
SAPS II. This scale was evaluated on a prospective basis in 7 studies,6–12 four of which involved less than 500 patients,6–8,12 while the remaining three involved over 500 patients.9–11 Solid tumors and hematological malignancies were included. Four studies showed good discrimination, with AUC > 0.8,7,9,11,12 while three studies presented moderate discrimination, with AUC < 0.72.6,8,10 Four articles reported low calibration, with p < 0.05,6,8,10,11 while two presented p > 0.05,7,12 and one article failed to supply this information.9 Almost all of the publications reported SMR > 1.1, except the study by Schellongowski in 2003,7 which did not supply this information, resulting in the underestimation of mortality.
SAPS III. This scale was evaluated in four studies,11,13,16,17 of which three presented a prospective design11,16,17 and one was a retrospective study,13 with a sample size of between 414 and 981 patients, and a predominance of solid tumors (>50%). Three studies11,13,17 reported good discrimination, with AUC = 0.84, 0.91 and 0.95, respectively, while one study presented moderate discrimination capacity, with AUC = 0.7.16 Two articles presented low calibration,11,17 with p < 0.05, while the other two showed good calibration, with p > 0.05. All four studies evidenced an underestimation of mortality, with SMR = 1.08 to 1.50.
SAPS III – CSA. The study carried out by Martos-Benítez 2020,17 a prospective cohort study involving 414 patients, mostly with solid tumors (94.9%), evaluated the SAPS III in the context of Central and South America (SAPS III - CSA). The study showed good discrimination, with AUC = 0.95, and good calibration, with p > 0.05. Mortality was overestimated, with SMR = 0.85.
ICMM. This scale was evaluated in 6 studies,7–9,11,15,16 of which 5 presented a prospective design and one was a retrospective study,15 with a sample size of between 132 and 1257 patients, corresponding to the articles published by Pérez 201815 and Soares 2010,11 respectively. Patients with solid tumors, advanced disease and hematological malignancies were included, except the study published by Pérez 2018,15 which only included solid tumors. Four articles9,11,15,16 reported SMR (<1) = 0.47 to 0.83, indicative of the overestimation of mortality, while two underestimated mortality.7,8 The study carried out by Schellongowski 20037 showed the best calibration, with SMR = 1.05.
MPM II. The MPM II scale applied upon admission and after 24 h was evaluated in three studies,9,14,16 all of which involved a prospective design. The number of patients ranged between 283 and 1257, corresponding to the studies of Rojas 2018 and Soares 2004, respectively. Patients with solid tumors, advanced disease and hematological malignancies were included. Moderate discrimination was observed, with AUC = 0.67 and 0.79, in the studies of Siddiqui 202016 and Soares 2004,9 respectively. In all three studies, SMR was >1, indicative of underestimation of mortality.
MPM III. This scale was only evaluated in the article published by Soares 2010,11 a prospective cohort study involving 717 patients with solid tumors and hematological malignancies. Moderate discrimination was reported, with AUC = 0.71. Mortality was overestimated, with SMR = 3.41.
DiscussionOncological patients in the ICU are at a high risk of suffering unfavorable outcomes. The precise prediction of mortality risk in this population could help to improve the planning of interventions and the results obtained. Although many studies have addressed risk prediction in the ICU, studies specifically referred to cancer patients are less frequent.18
Most of the prognostic scales included in this review and used to predict mortality in critical patients with cancer were originally validated in the general population.19 Two of the scales (ICMM and MPM II) have been fully validated in patients with oncological disease.7,20 The prognostic scales focused on the general population are characterized by greater available clinical evidence, and are the tools most widely used in routine practice.
The present systematic review has evaluated the evidence published in recent years on the prognostic performance of mortality scales in oncological patients in the ICU. The results of the review show that most of the prognostic models are not precise in this patient population. The majority of the general scales, such as the APACHE II, APACHE IV, SOFA, SAPS-II, SAPS-III and ICMM, tend to underestimate the mortality risk, while the MPM II may overestimate the risk. The study published by den Boer in 2005 showed a similar behavior for the general models, which consistently underestimated mortality.21
Of all the models evaluated, the APACHE II was the tool with the best SMR (standardized mortality rate) value, closer to 1, which suggests a better predictive capacity. Considering the heterogeneity of the studies, this model could offer an added advantage due to its familiarity and widespread use in polyvalent units. The cancer-specific prognostic models were not found to be superior to the general models. Their predictive results proved heterogeneous: the ICMM underestimated mortality (SMR < 1), while the MPM II overestimated mortality (SMR > 1).
It seems that the prognostic models specifically designed for cancer patients do not offer additional benefits in terms of prediction and discrimination. Moreover, there is less published evidence on their application and performance. Nevertheless, the study of den Boer reported the specific models to offer better discrimination and calibration.21
In general, the applicability of all the prognostic models is limited in patients with hematological neoplastic disease due to the over-representation of solid tumors. There are two main reasons for this. The first reason is measurement bias: the predictive models include parameters such as the leukocyte and platelet count, which are highly prevalent in patients with hematological malignancies, independently of their critical state. This may generate bias in the measurements and affect the precision of the models. A second reason corresponds to the differences in the clinical characteristics: patients with hematological malignancies have characteristics that differ from those of patients with solid tumors. They are more often exposed to in-hospital chemotherapy, sepsis and febrile neutropenia, while patients with solid tumors are mainly admitted to the ICU for postoperative care. These differences in the reasons for admission to the ICU can affect the performance of the predictive scales.
The present study has some limitations that must be considered when interpreting the results obtained. Firstly, the number of studies included in the review was limited, which can affect the external validity of the findings. In other words, the results cannot be generalized to the entire population of cancer patients. Secondly, the studies showed great variability, not only in the way in which in-hospital mortality was calculated, but also in relation to characteristics such as the number of patients, the type of neoplasm, or the timelines involved. This complicates the comparison of results between different studies. Lastly, the in-hospital mortality observed in each cohort ranged between 4.5% and 58.7%. Such important variability likewise complicates the comparison of results and the performance of a meta-analysis of frequency measures.
The possible causes of this heterogeneity include the observational nature of the studies, which means that it is very likely that not all the variables capable of influencing in-hospital mortality were controlled, in the same way as the variability of the characteristics of the studies in terms of the number of patients included, the type of background neoplastic disease, and the validated scale.
The results obtained must be interpreted and applied with caution. The predictive scales are tools that provide clinicians with information and can guide the assignment of resources and the required degree of monitoring; however, they do not replace clinical judgment and should not be used as barriers to the ICU admission of patients who require critical care. In sum, the limitations of the study must be taken into account when interpreting the results, and further studies with more homogeneous methodologies are needed to obtain more precise and generalizable results.
ConclusionsDespite the increase in cancer patients admitted to the ICU and the existence of specific models for predicting mortality in this population, no definitive instrument has yet been shown to be superior to the rest. It is advisable to use the available models, with preference for those in which experience is greater, and being aware of their limitations. The heterogeneity of the populations and lack of consistency in the studies limit their usefulness. We need new instruments or large-scale validation studies to improve the precision of the available tools, considering the specific characteristics of oncological patients. In the meantime, it is advisable to use the models with caution, and complement the predictions with other relevant clinical factors.
FundingThis project was not funded by an institution external or sponsor.
Conflict of interestThe authors express no conflicts of interest in the study conception process.
Author contributionsAndrea Cabrera-Losada
Participated in:
- -
Data acquisition
- -
Data analysis and interpretation
- -
Drafting of the article
- -
Final approval of the submitted manuscript
María Alejandra Correa-Oviedo
Participated in:
- -
Data acquisition
- -
Data analysis and interpretation
- -
Drafting of the article
- -
Final approval of the submitted manuscript
Vanessa Carolina Herrera-Villazón
Participated in:
- -
Data acquisition
- -
Data analysis and interpretation
- -
Drafting of the article
- -
Final approval of the submitted manuscript
Sebastián Gil-Tamayo
Participated in:
- -
Data acquisition
- -
Data analysis and interpretation
- -
Drafting of the article
- -
Final approval of the submitted manuscript
Carlos Federico Molina
Participated in:
- -
Study conception and design
- -
Critical review of intellectual content
- -
Final approval of the submitted manuscript
Carola Giménez-Esparza Vich
Participated in:
- -
Study conception and design
- -
Critical review of intellectual content
- -
Final approval of the submitted manuscript
Víctor Hugo Nieto-Estrada
Participated in:
- -
Study conception and design
- -
Critical review of intellectual content
- -
Final approval of the submitted manuscript

