


To evaluate the validity and sensitivity to change of the FRAIL-España scale in critically ill adult patients admitted to intensive care units (ICUs) in Spain.
DesignDescriptive, observational, prospective, multicenter, metric in nature.
SettingICUs in Spain.
PatientsPatients >18 years old with ICU stay >48 h.
InterventionsNone.
Main variables of interestFrailty (FRAIL-España), sociodemographic characteristics, dependency, ICU stay clinical variables, stay, mortality, destination at discharge.
ResultsThe prevalence of frailty at ICU admission, among the 493 patients in the cohort, was 23.9%. Multivariate risk factors for frailty were age and hospital admissions in the year prior to the current admission. Being independent, having a stable partner, and good physical quality of life are protective factors for frailty. Frailty is associated with greater resource utilization, increased mortality, and a higher likelihood of discharge to a long-stay facility. The effect size of the observed change was moderate-large (d = 0.850).
ConclusionsThe FRAIL-España model shows good convergent validity with age, dependency, marital status, comorbidities, perceived physical quality of life, and hospitalization in an acute care facility in the previous year. It has good predictive validity for ICU-acquired weakness, alterations in glycemic control and resource use, hospital discharge, and mortality. It is sensitive for detecting changes in frailty.
Evaluar la validez y la sensibilidad al cambio de la escala FRAIL-España en pacientes críticos adultos de unidades de cuidados intensivos (UCI) de España.
DiseñoDescriptivo, observacional, prospectivo y multicéntrico, de carácter métrico.
ÁmbitoUCI de España.
PacientesPacientes>18 años con estancia en UCI > 48 horas.
IntervencionesNinguna.
Variables de interés principalesFragilidad (FRAIL-España), características sociodemográficas, dependencia, variables clínicas de estancia en UCI, estancia, mortalidad, destino al alta.
ResultadosLa prevalencia de fragilidad al ingreso en UCI, de los 493 pacientes de la cohorte, fue del 23,9%. Los factores de riesgo de fragilidad en el multivariante fueron la edad e ingresos hospitalarios en el año anterior al actual ingreso. Ser independiente, tener pareja estable y buena calidad de vida física son factores protectores de fragilidad. La fragilidad se asocia con mayor utilización de recursos, un incremento de la mortalidad y mayor probabilidad de alta a un centro de larga estancia. El tamaño del efecto del cambio observado fue moderado-grande (d = 0,850).
ConclusionesLa FRAIL-España muestra buena validez convergente con la edad, dependencia, estado civil, comorbilidades, calidad de vida física percibida y hospitalización en un centro de agudos en el año anterior. Presenta buena validez predictiva para la debilidad adquirida en UCI, alteraciones en el control glucémico y el uso de recursos, destino al alta hospitalaria y mortalidad. Es sensible para detectar cambios en la fragilidad.
The concept of frailty is related to weakness and can refer to different biopsychosocial dimensions. From a physical perspective, frailty is a syndrome characterized by decreased strength, endurance, and biological function, which increases an individual's vulnerability to suffer increased dependency or death.1 Frailty can also be understood as a decrease in physiological reserve, i.e., the body's ability to resist stress and recover from illness. In this sense, a frail patient is less able to recover from an illness, even a mild one, or recovers more slowly. As a result, complications from illnesses become more prevalent over time.2,3
Considering the serious consequences that frail patients may experience upon hospital admission, it is crucial to detect them as early as possible in order to adapt their treatment and care according to their baseline situation and try to avoid a prolonged and/or unfavorable course. However, numerous tools assess frailty,4 and there is no consensus on which criteria should be assessed.
A comprehensive review of the definitions of frailty and of the tools used to evaluate it was carried out in 2007.5 This review was combined with the opinions of an advisory panel of geriatric experts from the International Academy of Nutrition and Aging. While the panel did not reach a consensus on a definition, they agreed that it would be useful to develop a simple, time-efficient tool. Thus, they developed and proposed the FRAIL scale,6 which owes its name to the acronym formed by the 5 items to be assessed: Fatigue, Resistance, Ambulation, Illness, and Loss of weight. These same criteria of simplicity and speed can be applied to the evaluation of patients admitted to the Intensive Care Unit (ICU), where patients are usually unable to participate in their assessment and must be assessed through their relatives and/or caregivers.
Over a decade ago, frailty scales began to be implemented to evaluate critically ill patients because they were thought to have similarities with elderly patients.7 Although the first studies with critically ill patients were conducted with individuals over 508 or 609 years of age, a study involving patients admitted to the ICU and who were ≥18 years of age was published in 2015.10 Published reviews confirm the relationship between frailty in critically ill patients and higher rates of limitations of life-support treatments,11,12 short- and long-term mortality,11–15 or increased dependency at ICU discharge or deterioration of quality of life—although there is controversy regarding the association between frailty and the use of mechanical ventilation,11,14 renal therapies11,14 or ICU stay.11,14
The FRAIL scale has been adapted into several languages, including Spanish16 (FRAIL-España). The present study aims to evaluate the validity and sensitivity to change of the FRAIL-España scale in critically ill adult patients in Intensive Care Units in Spain.
Patients and methodsDesign and participantsAn observational, descriptive, and prospective study was conducted in a cohort of patients from 10 Spanish ICUs to evaluate the metric properties of the FRAIL-España scale. Specifically, the analysis examined its convergent validity (agreement between constructs related to frailty), divergent validity (degree of non-correlation between variables hypothetically unrelated to frailty), and predictive validity (the FRAIL-España scale’s ability to predict an event). Additionally, we evaluated its sensitivity to change (the ability of the scale to detect changes in frailty over time) and the floor-ceiling effect (the percentage of minimum and maximum values of frailty).
Patients aged 18 years or older with expected ICU stays of more than 48 h, who agreed to participate and who were admitted between January 2020 and July 2023, were included in the study. The study was interrupted between March 2020 and April 2021, due to the COVID-19 pandemic, and during major holiday periods. Additionally, the recruitment period in each Unit varied depending on the research team’s capacity. Readmissions, patients from other ICUs, patients admitted due to SARS-CoV-2 infection, cases in which communication with the patients or their relatives was not possible, and patients admitted with a diagnosis of brain death or limitation of life-sustaining treatment were excluded. Patients included in the study were followed up on via telephone at 3, 6, 9, and 12 months after hospital discharge.
Implementation of the instrumentMembers of the research team, from each of the participating Units, were responsible for assessing patient frailty using the FRAIL-España scale upon admission and at each follow-up telephone call. The assessment was based on the patient's current situation concerning each of the 5 components of the scale. For the initial assessment, the previous month’s situation was considered, while the situation at the time of the telephone call was considered for the subsequent assessments at 3, 6, 9, and 12 months.
The FRAIL-España scale (see Appendix B, Supplementary material, Table S1) classifies patients according to the presence or absence of 5 items (Fatigue, Resistance, Ambulation, Illness, and unintentional Loss of weight). Patients are considered to be in good condition and not frail if they score 0 points (no items present), pre-frail if they score 1 or 2 points, and frail if they score between 3 and 5 points.
Study variablesThe following variables were recorded upon ICU admission and during the follow-up telephone calls: frailty level according to the FRAIL-España scale; sociodemographic variables (age, sex, body mass index (BMI), marital status, maximum educational level, personal and family annual income, type of family); dependency (assessed for instrumental activities with the Lawton and Brody scale,17 and for basic activities of daily living with the Barthel index18); perceived physical (physical component summary, PCS) and mental (mental component summary, MCS) quality of life assessed with the Short Form 12-item health survey (SF-12)19; and admissions to an acute care facility and/or ICU in the year before the current admission or the last three months (in the follow-up telephone calls).
Additionally, comorbidities were recorded upon ICU admission using the Charlson Comorbidity Index,20 and the presence and severity of osteoporosis and its severity were assessed based on the Simplified Acute Physiology Score 3 (SAPS 3).21
Daily, during the patient’s stay in the ICU (and until discharge or until day 45 of admission), the maximum and minimum values of the following were recorded: 1) blood glucose; 2) pain (Verbal Numerical Scale [VNS] if the patient was able to self-report, or the Scale of Behavior Indicators of Pain [ESCID]22 if the patient was unable to communicate); and 3) agitation or sedation (Richmond Agitation Sedation Scale [RASS]23). Delirium was also recorded using the Confusion Assessment method in Intensive Care Units (CAM-ICU).24,25 Additionally, the use of mechanical restraints, maximum mobilization (ICU Mobility Scale [IMS-Es]26,27), the need for renal replacement therapy, vasoactive drug administration, transfusions, invasive mechanical ventilation (IMV), noninvasive positive pressure ventilation (NIV), and high-flow nasal oxygen therapy (HFO), cardiopulmonary resuscitation, limitation of life-sustaining treatment (LLST), and adverse events (accidental tracheal tube removal, reintubation, catheter-related bacteremia, ventilator-associated pneumonia, bladder catheter-related urinary tract infection) were recorded. Multiorgan failure was assessed using the Sequential Organ Failure Assessment score (SOFA).28 Physical therapy was also recorded.
Muscle strength was assessed using the Medical Research Council Scale sum score [MRC-SS]29,30 on a weekly basis, as soon as the patient was conscious and cooperative, and his or her clinical situation permitted.
The number of days spent in the ICU and hospital, as well as the patient’s discharge destination, were also recorded. The operational definitions of all the variables can be found in Appendix B, Supplementary material.
Statistical analysisQuantitative variables were reported as the median (Q1–Q3), after testing for nonparametric behavior using the Kolmogorov-Smirnov test. Qualitative variables were reported as absolute (n) and relative (%) frequencies.
The validity of the FRAIL-España scale was assessed using bivariate logistic regression analysis to determine the relationship of each variable with the FRAIL-España scale. Patients were stratified into non-frail (FRAIL-España 0 to 2) and frail (FRAIL-España 3 to 5) patients, and multivariate logistic regression analysis was performed with inclusion of those variables found to be significant in the bivariate analysis (p < 0.05) - excluding those variables with which there could be collinearity. Odds ratios (OR) for frailty were reported, with the corresponding 95% confidence interval (CI 95%) and statistical significance (p-value). The FRAIL-España score was also correlated with the quantitative variables using a Spearman correlation. Null correlation was considered for values <0.10, weak for 0.10−0.39, moderate for 0.40−0.69, strong for 0.70−0.89, and very strong for values above 0.90.31
Sensitivity to change was evaluated using repeated measures analysis of variance (ANOVA) with the Bonferroni correction to test the difference in means (standard deviation, SD) of the FRAIL-Es scale at the 5 recording timepoints (at baseline before admission and at 3, 6, 9, and 12 months after hospital discharge). The evaluation was made using the effect size (d), which was calculated based on three situations: 1) considering patients who were assessed up to 12 months after discharge; 2) deceased patients with the maximum frailty score (FRAIL-España score of 5); and 3) deceased patients with the score from their last assessment. Cohen's d values <0.49 indicate a small effect size; values between 0.5 and 0.79 indicate a moderate effect size, and values greater than or equal to 0.8032 indicate a large effect size.32
Floor and ceiling effects were assessed by determining the proportion of patients with the lowest (FRAIL-España score of 0) and highest (FRAIL-España score of 5) scores at admission and each assessment throughout the follow-up period. Floor and ceiling effects below 15% are considered acceptable.33
The analyzes were performed using the SPSS statistical package for MS Windows (version 23.0, IBM Corp., USA) and Stata® (version IC14, StataCorp LLC, USA).
Ethical considerationsThe present study was approved by the Research Ethics Committee of the reference hospital (CEIm19/42) and the ethics committees or pertinent commissions of the collaborating centers. Consent from the patient or, if the patient could not give consent personally, from his or her close relative was required.
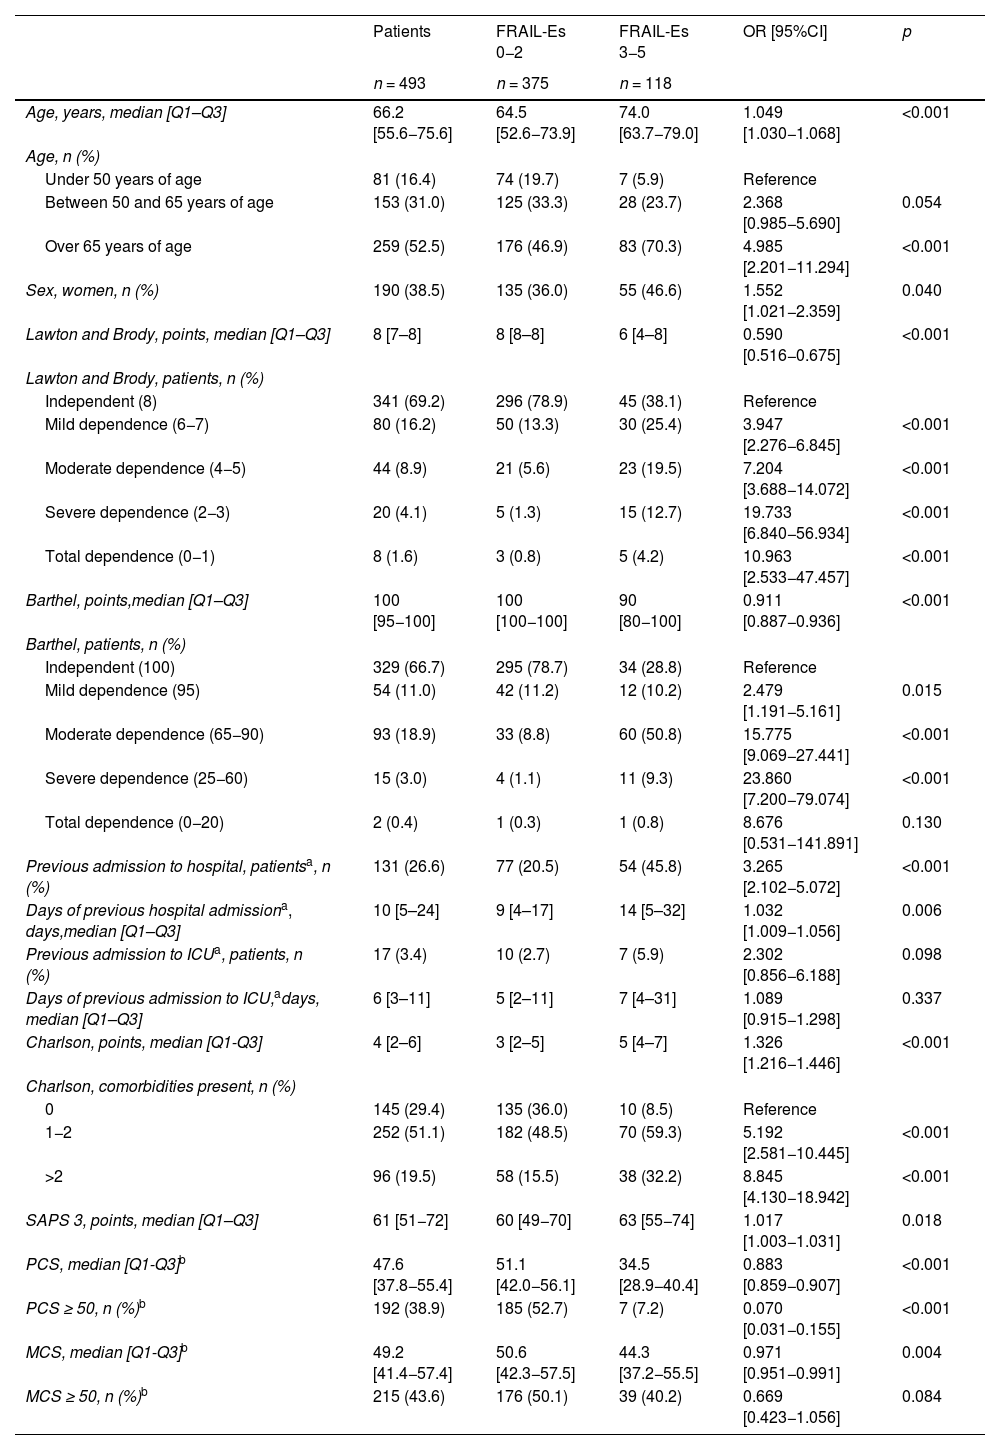
ResultsA total of 3900 patients were admitted to the 10 ICUs during the study period. Of those patients, 499 were included in the study. After the exclusion of 6 patients, the final study sample consisted of 493 individuals (see Appendix B, Supplementary material, Fig. S1). The characteristics of the Units can be found in Appendix B, Supplementary material, Table S2. The characteristics of the patients can be found in Table 1 and Appendix B, Supplementary material, Tables S3, S4, and S5.
Convergent and divergent validity of the FRAIL-España scale.
| Patients | FRAIL-Es 0−2 | FRAIL-Es 3−5 | OR [95%CI] | p | |
|---|---|---|---|---|---|
| n = 493 | n = 375 | n = 118 | |||
| Age, years, median [Q1–Q3] | 66.2 [55.6−75.6] | 64.5 [52.6−73.9] | 74.0 [63.7−79.0] | 1.049 [1.030−1.068] | <0.001 |
| Age, n (%) | |||||
| Under 50 years of age | 81 (16.4) | 74 (19.7) | 7 (5.9) | Reference | |
| Between 50 and 65 years of age | 153 (31.0) | 125 (33.3) | 28 (23.7) | 2.368 [0.985−5.690] | 0.054 |
| Over 65 years of age | 259 (52.5) | 176 (46.9) | 83 (70.3) | 4.985 [2.201−11.294] | <0.001 |
| Sex, women, n (%) | 190 (38.5) | 135 (36.0) | 55 (46.6) | 1.552 [1.021−2.359] | 0.040 |
| Lawton and Brody, points, median [Q1–Q3] | 8 [7–8] | 8 [8–8] | 6 [4–8] | 0.590 [0.516−0.675] | <0.001 |
| Lawton and Brody, patients, n (%) | |||||
| Independent (8) | 341 (69.2) | 296 (78.9) | 45 (38.1) | Reference | |
| Mild dependence (6−7) | 80 (16.2) | 50 (13.3) | 30 (25.4) | 3.947 [2.276−6.845] | <0.001 |
| Moderate dependence (4−5) | 44 (8.9) | 21 (5.6) | 23 (19.5) | 7.204 [3.688−14.072] | <0.001 |
| Severe dependence (2−3) | 20 (4.1) | 5 (1.3) | 15 (12.7) | 19.733 [6.840−56.934] | <0.001 |
| Total dependence (0−1) | 8 (1.6) | 3 (0.8) | 5 (4.2) | 10.963 [2.533−47.457] | <0.001 |
| Barthel, points,median [Q1–Q3] | 100 [95−100] | 100 [100−100] | 90 [80−100] | 0.911 [0.887−0.936] | <0.001 |
| Barthel, patients, n (%) | |||||
| Independent (100) | 329 (66.7) | 295 (78.7) | 34 (28.8) | Reference | |
| Mild dependence (95) | 54 (11.0) | 42 (11.2) | 12 (10.2) | 2.479 [1.191−5.161] | 0.015 |
| Moderate dependence (65−90) | 93 (18.9) | 33 (8.8) | 60 (50.8) | 15.775 [9.069−27.441] | <0.001 |
| Severe dependence (25−60) | 15 (3.0) | 4 (1.1) | 11 (9.3) | 23.860 [7.200−79.074] | <0.001 |
| Total dependence (0−20) | 2 (0.4) | 1 (0.3) | 1 (0.8) | 8.676 [0.531−141.891] | 0.130 |
| Previous admission to hospital, patientsa, n (%) | 131 (26.6) | 77 (20.5) | 54 (45.8) | 3.265 [2.102−5.072] | <0.001 |
| Days of previous hospital admissiona, days,median [Q1–Q3] | 10 [5–24] | 9 [4–17] | 14 [5–32] | 1.032 [1.009−1.056] | 0.006 |
| Previous admission to ICUa, patients, n (%) | 17 (3.4) | 10 (2.7) | 7 (5.9) | 2.302 [0.856−6.188] | 0.098 |
| Days of previous admission to ICU,adays, median [Q1–Q3] | 6 [3–11] | 5 [2–11] | 7 [4–31] | 1.089 [0.915−1.298] | 0.337 |
| Charlson, points, median [Q1-Q3] | 4 [2–6] | 3 [2–5] | 5 [4–7] | 1.326 [1.216−1.446] | <0.001 |
| Charlson, comorbidities present, n (%) | |||||
| 0 | 145 (29.4) | 135 (36.0) | 10 (8.5) | Reference | |
| 1−2 | 252 (51.1) | 182 (48.5) | 70 (59.3) | 5.192 [2.581−10.445] | <0.001 |
| >2 | 96 (19.5) | 58 (15.5) | 38 (32.2) | 8.845 [4.130−18.942] | <0.001 |
| SAPS 3, points, median [Q1–Q3] | 61 [51−72] | 60 [49−70] | 63 [55−74] | 1.017 [1.003−1.031] | 0.018 |
| PCS, median [Q1-Q3]b | 47.6 [37.8−55.4] | 51.1 [42.0−56.1] | 34.5 [28.9−40.4] | 0.883 [0.859−0.907] | <0.001 |
| PCS ≥ 50, n (%)b | 192 (38.9) | 185 (52.7) | 7 (7.2) | 0.070 [0.031−0.155] | <0.001 |
| MCS, median [Q1-Q3]b | 49.2 [41.4−57.4] | 50.6 [42.3−57.5] | 44.3 [37.2−55.5] | 0.971 [0.951−0.991] | 0.004 |
| MCS ≥ 50, n (%)b | 215 (43.6) | 176 (50.1) | 39 (40.2) | 0.669 [0.423−1.056] | 0.084 |
CI: confidence interval; MCS: mental component of the SF-12 perceived quality of life questionnaire; n.a. = not applicable; OR: odds ratio; PCS: physical component of the SF-12 perceived quality of life questionnaire; SF-12: 12-Item Short Form Survey.
Frailty prevalence at admission was 23.9%, compared to 30.7% at 3 months post-discharge, 26.2% at 6 months, 22.4% at 9 months, and 24.4% at 12 months. Figs. 1 and 2, as well as Appendix B, Table S6, show the evolution of frailty and each item evaluated with the FRAIL-España scale at the different evaluation timepoints. The least prevalent items at all the assessment timepoints were illnesses (I), followed by unintentional loss of weight (L). The highest prevalence of fatigue (F), resistance (R), and ambulation (A) was observed three months after discharge from the hospital. After the peak of fatigue at three months, the prevalence always remained below baseline values, while the prevalence of resistance and ambulation never recovered to pre-admission levels.


Sociodemographic variables associated with a higher probability of frailty upon admission included age, female sex, dependence for instrumental activities and basic activities of daily living (lower independence was associated with greater frailty), body mass index (BMI), and marital status. Conversely, variables associated with a lower probability of frailty included educational level (higher academic levels were associated with lower risk of frailty) and annual income above €20,000 (see Appendix B, Table 1, and Supplementary material, Table S3).
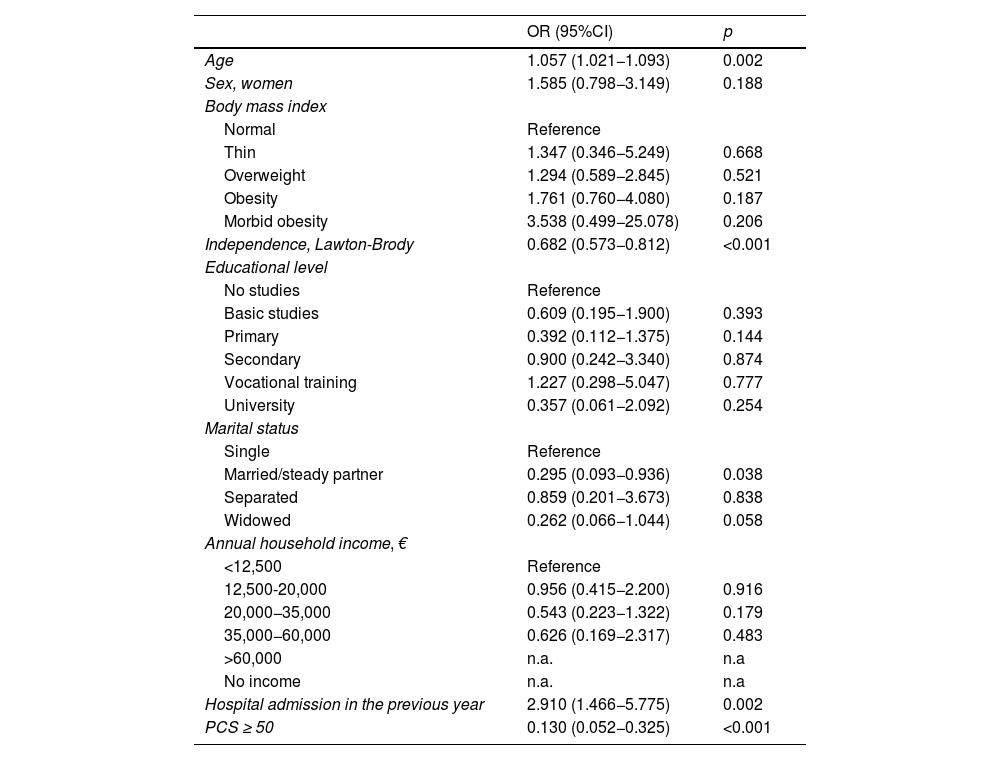
Multivariate analysis of variables related to frailty on admission to the ICU.
| OR (95%CI) | p | |
|---|---|---|
| Age | 1.057 (1.021−1.093) | 0.002 |
| Sex, women | 1.585 (0.798−3.149) | 0.188 |
| Body mass index | ||
| Normal | Reference | |
| Thin | 1.347 (0.346−5.249) | 0.668 |
| Overweight | 1.294 (0.589−2.845) | 0.521 |
| Obesity | 1.761 (0.760−4.080) | 0.187 |
| Morbid obesity | 3.538 (0.499−25.078) | 0.206 |
| Independence, Lawton-Brody | 0.682 (0.573−0.812) | <0.001 |
| Educational level | ||
| No studies | Reference | |
| Basic studies | 0.609 (0.195−1.900) | 0.393 |
| Primary | 0.392 (0.112−1.375) | 0.144 |
| Secondary | 0.900 (0.242−3.340) | 0.874 |
| Vocational training | 1.227 (0.298−5.047) | 0.777 |
| University | 0.357 (0.061−2.092) | 0.254 |
| Marital status | ||
| Single | Reference | |
| Married/steady partner | 0.295 (0.093−0.936) | 0.038 |
| Separated | 0.859 (0.201−3.673) | 0.838 |
| Widowed | 0.262 (0.066−1.044) | 0.058 |
| Annual household income, € | ||
| <12,500 | Reference | |
| 12,500-20,000 | 0.956 (0.415−2.200) | 0.916 |
| 20,000−35,000 | 0.543 (0.223−1.322) | 0.179 |
| 35,000−60,000 | 0.626 (0.169−2.317) | 0.483 |
| >60,000 | n.a. | n.a |
| No income | n.a. | n.a |
| Hospital admission in the previous year | 2.910 (1.466−5.775) | 0.002 |
| PCS ≥ 50 | 0.130 (0.052−0.325) | <0.001 |
CI: confidence interval; n.a. = not applicable; OR: odds ratio; PCS: physical component of the SF-12 perceived quality of life questionnaire; SF-12: 12-item Short Form Survey.
 Convergent and divergent validity; b) predictive validity. (a) Correlates PCS and MCS with the FRAIL-Es scale measured at the same assessment timepoint. (b) Correlates PCS and MCS with the FRAIL-Es scale measured at ICU admission. Correlations were considered null for values < 0.10, weak for 0.10−0.39, moderate for 0.40−0.69, strong for 0.70−0.89, and very strong for >0.90. No correlation if p > 0.05. ICUAW: ICU-acquired muscle weakness; MCS: mental component of the SF-12 perceived quality of life questionnaire; PCS: physical component of the SF-12 perceived quality of life questionnaire; RASS: Richmond Agitation Sedation Scale; SAPS 3: Simplified Acute Physiology Score 3; SF-12: 12-item Short Form Survey; SOFA: Sequential Organ Failure Assessment score; ICU: intensive care unit.")
Validity of the FRAIL-España scale. Correlations and p-values. a) Convergent and divergent validity; b) predictive validity.
(a) Correlates PCS and MCS with the FRAIL-Es scale measured at the same assessment timepoint. (b) Correlates PCS and MCS with the FRAIL-Es scale measured at ICU admission.
Correlations were considered null for values < 0.10, weak for 0.10−0.39, moderate for 0.40−0.69, strong for 0.70−0.89, and very strong for >0.90. No correlation if p > 0.05.
ICUAW: ICU-acquired muscle weakness; MCS: mental component of the SF-12 perceived quality of life questionnaire; PCS: physical component of the SF-12 perceived quality of life questionnaire; RASS: Richmond Agitation Sedation Scale; SAPS 3: Simplified Acute Physiology Score 3; SF-12: 12-item Short Form Survey; SOFA: Sequential Organ Failure Assessment score; ICU: intensive care unit.
Prior hospital admissions, poor perceived physical quality of life (PCS), and comorbidities (Charlson index) increased the risk of frailty (Table 1). The comorbidity that most increased this risk was dementia (see Appendix B, Supplementary material, Table S5).
In the multivariate analysis (Table 2), age, dependence, and admission to an acute care facility in the previous year remained risk factors. Having a stable partner and good perceived physical quality of life (PCS) were identified as protective factors against frailty.
Regarding the Spearman correlations between demographic variables and the FRAIL-España scale, a strong negative correlation was observed with PCS at 6, 9, and 12 months after discharge. Moderate correlations were observed with the Lawton and Brody scale, the Barthel index, the Charlson index, and PCS at 3 months. Moderate correlations were also observed with MCS at 6, 9, and 12 months after discharge (Fig. 3a).
Among the survivors without frailty at admission, the identified risk factors for developing frailty were age, frailty level at admission, length of hospital stay, and having undergone hospital admissions since discharge. Of the 5 items assessed by the FRAIL-España scale, fatigue at admission was the item found to be significantly related to frailty development at all four assessed timepoints (see Appendix B, Supplementary material, Tables S7, S8, S9, and S10).
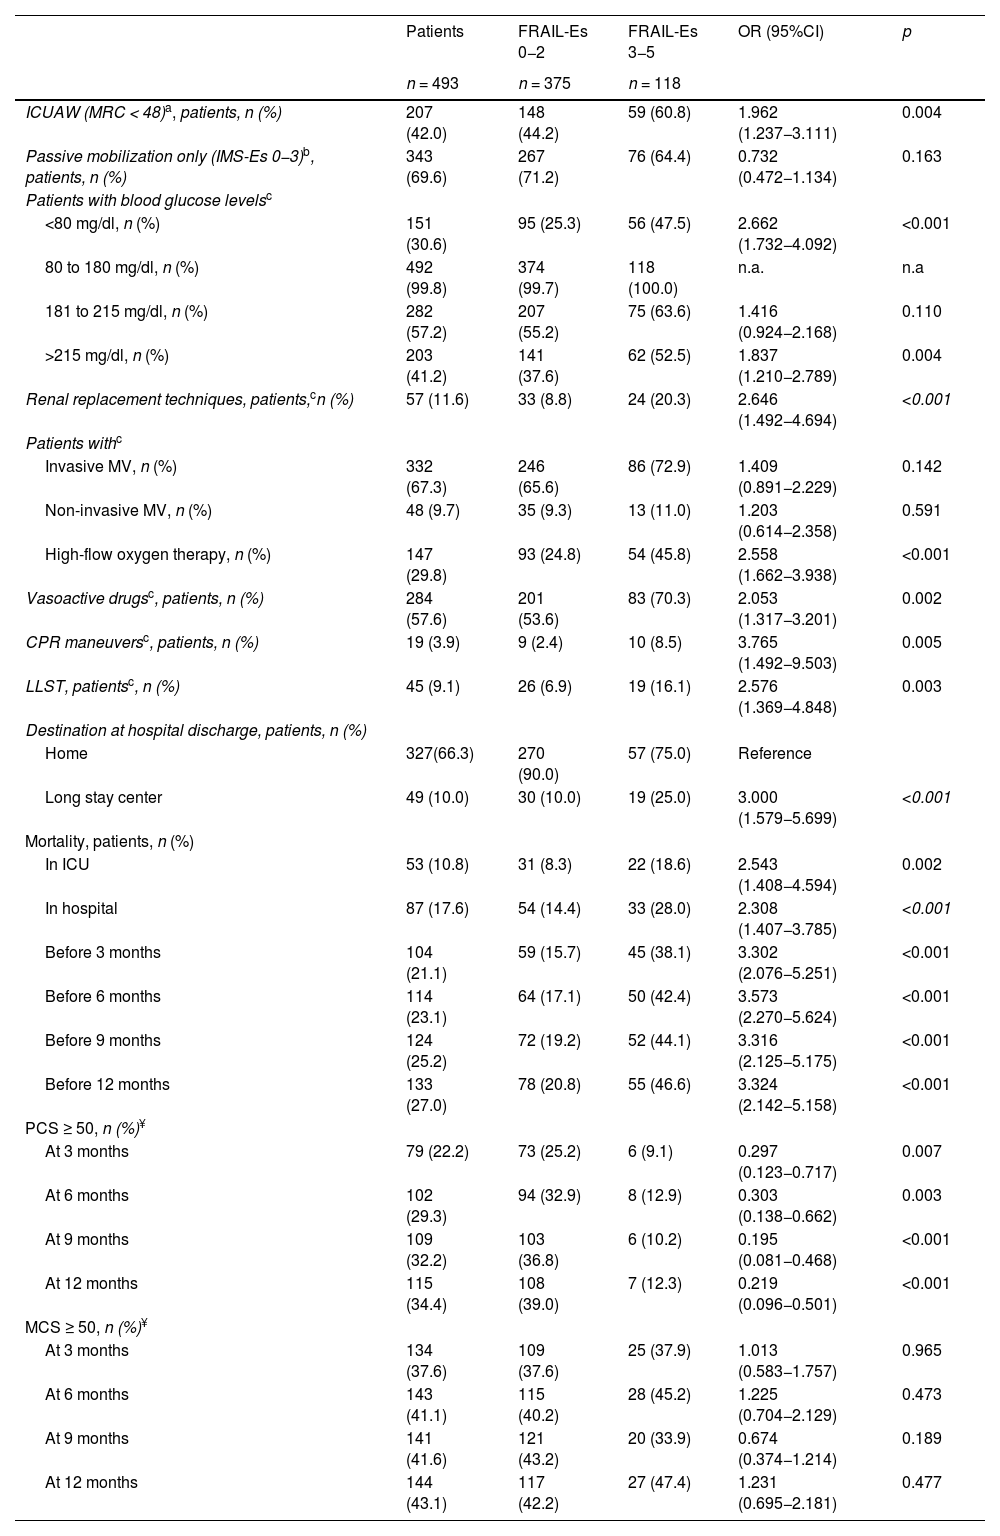
Predictive validity (Table 3, Fig. 3b, and Appendix B Supplementary material, Table S11)Frailty upon admission to the ICU is significantly associated with the utilization of healthcare resources and the development of adverse events.
Predictive validity of the FRAIL-España scale.
| Patients | FRAIL-Es 0−2 | FRAIL-Es 3−5 | OR (95%CI) | p | |
|---|---|---|---|---|---|
| n = 493 | n = 375 | n = 118 | |||
| ICUAW (MRC < 48)a, patients, n (%) | 207 (42.0) | 148 (44.2) | 59 (60.8) | 1.962 (1.237−3.111) | 0.004 |
| Passive mobilization only (IMS-Es 0−3)b, patients, n (%) | 343 (69.6) | 267 (71.2) | 76 (64.4) | 0.732 (0.472−1.134) | 0.163 |
| Patients with blood glucose levelsc | |||||
| <80 mg/dl, n (%) | 151 (30.6) | 95 (25.3) | 56 (47.5) | 2.662 (1.732−4.092) | <0.001 |
| 80 to 180 mg/dl, n (%) | 492 (99.8) | 374 (99.7) | 118 (100.0) | n.a. | n.a |
| 181 to 215 mg/dl, n (%) | 282 (57.2) | 207 (55.2) | 75 (63.6) | 1.416 (0.924−2.168) | 0.110 |
| >215 mg/dl, n (%) | 203 (41.2) | 141 (37.6) | 62 (52.5) | 1.837 (1.210−2.789) | 0.004 |
| Renal replacement techniques, patients,cn (%) | 57 (11.6) | 33 (8.8) | 24 (20.3) | 2.646 (1.492−4.694) | <0.001 |
| Patients withc | |||||
| Invasive MV, n (%) | 332 (67.3) | 246 (65.6) | 86 (72.9) | 1.409 (0.891−2.229) | 0.142 |
| Non-invasive MV, n (%) | 48 (9.7) | 35 (9.3) | 13 (11.0) | 1.203 (0.614−2.358) | 0.591 |
| High-flow oxygen therapy, n (%) | 147 (29.8) | 93 (24.8) | 54 (45.8) | 2.558 (1.662−3.938) | <0.001 |
| Vasoactive drugsc, patients, n (%) | 284 (57.6) | 201 (53.6) | 83 (70.3) | 2.053 (1.317−3.201) | 0.002 |
| CPR maneuversc, patients, n (%) | 19 (3.9) | 9 (2.4) | 10 (8.5) | 3.765 (1.492−9.503) | 0.005 |
| LLST, patientsc, n (%) | 45 (9.1) | 26 (6.9) | 19 (16.1) | 2.576 (1.369−4.848) | 0.003 |
| Destination at hospital discharge, patients, n (%) | |||||
| Home | 327(66.3) | 270 (90.0) | 57 (75.0) | Reference | |
| Long stay center | 49 (10.0) | 30 (10.0) | 19 (25.0) | 3.000 (1.579−5.699) | <0.001 |
| Mortality, patients, n (%) | |||||
| In ICU | 53 (10.8) | 31 (8.3) | 22 (18.6) | 2.543 (1.408−4.594) | 0.002 |
| In hospital | 87 (17.6) | 54 (14.4) | 33 (28.0) | 2.308 (1.407−3.785) | <0.001 |
| Before 3 months | 104 (21.1) | 59 (15.7) | 45 (38.1) | 3.302 (2.076−5.251) | <0.001 |
| Before 6 months | 114 (23.1) | 64 (17.1) | 50 (42.4) | 3.573 (2.270−5.624) | <0.001 |
| Before 9 months | 124 (25.2) | 72 (19.2) | 52 (44.1) | 3.316 (2.125−5.175) | <0.001 |
| Before 12 months | 133 (27.0) | 78 (20.8) | 55 (46.6) | 3.324 (2.142−5.158) | <0.001 |
| PCS ≥ 50, n (%)¥ | |||||
| At 3 months | 79 (22.2) | 73 (25.2) | 6 (9.1) | 0.297 (0.123−0.717) | 0.007 |
| At 6 months | 102 (29.3) | 94 (32.9) | 8 (12.9) | 0.303 (0.138−0.662) | 0.003 |
| At 9 months | 109 (32.2) | 103 (36.8) | 6 (10.2) | 0.195 (0.081−0.468) | <0.001 |
| At 12 months | 115 (34.4) | 108 (39.0) | 7 (12.3) | 0.219 (0.096−0.501) | <0.001 |
| MCS ≥ 50, n (%)¥ | |||||
| At 3 months | 134 (37.6) | 109 (37.6) | 25 (37.9) | 1.013 (0.583−1.757) | 0.965 |
| At 6 months | 143 (41.1) | 115 (40.2) | 28 (45.2) | 1.225 (0.704−2.129) | 0.473 |
| At 9 months | 141 (41.6) | 121 (43.2) | 20 (33.9) | 0.674 (0.374−1.214) | 0.189 |
| At 12 months | 144 (43.1) | 117 (42.2) | 27 (47.4) | 1.231 (0.695−2.181) | 0.477 |
ICUAW: ICU-acquired weakness; CI: confidence interval; LLST: limitation of life-sustaining treatment; MCS: mental component of the SF-12 perceived quality of life questionnaire; MRC: Medical Research Council; n.a. = not applicable; OR: odds ratio; PCS: physical component of the SF-12 perceived quality of life questionnaire; CPR: cardiopulmonary resuscitation; SF-12: 12-item Short Form Survey; ICU: intensive care unit; M V: mechanical ventilation.
Patients who at some time during admission to the ICU had blood glucose levels in each of the ranges considered, treatment with invasive MV, noninvasive MV or high flow, renal replacement techniques, vasoactive drugs, required cardiopulmonary resuscitation techniques, or presented limitation of life-sustaining treatment orders.
Comparisons of the FRAIL-Es scale with PCS and MCS at 3 months are with 356 patients (290 non-frail and 66 frail), at 6 months with 348 patients (286 non-frail and 62 frail), at 9 months with 339 patients (280 non-frail and 59 frail), and at 12 months after hospital discharge with 334 patients (277 non-frail and 57 frail).
Frail patients developed more ICU-acquired weakness than non-frail patients. There were no differences in passive mobilization (IMS-Es score 0−3), but frail patients had more alterations in blood glucose control. Frail patients required deeper sedation (RASS between −4 and −5) and needed renal replacement techniques, vasoactive drugs, and red blood cell transfusions more often. There were no significant differences in the use of IMV or NIV, but a higher proportion of frail patients required HFO. Frail patients had comparatively more LLST orders (Table 3 and Appendix B, Supplementary material, Table S11).
There were no differences between non-frail and frail patients in the median Q1–Q3 days of ICU stay (7 [4–15] vs. 7 [4–14]; p = 0.878) or hospital stay (23 [13–43] vs. 21 [13–36]; p = 0.236).
However, frailty at admission was associated with an increased risk of discharge to a long-term care facility, as well as ICU and hospital mortality, and long-term mortality (Table 3).
Among the hospital survivors, a higher proportion of non-frail patients had good PCS. Frailty at admission was identified as a risk factor for poorer PCS at 3, 6, 9, and up to 12 months after hospital discharge (Fig. 3b).
The correlation of the FRAIL-España scale at admission with the evaluated variables was found to be null or weak (Fig. 3b).
Sensitivity to change and floor and ceiling effect (Appendix B Supplementary material, Tables S12 and S13)The effect size of the changes in the FRAIL-Es scale between inclusion and the four follow-up timepoints (3, 6, 9, and 12 months after hospital discharge) was large (d = 0.850). For those who died during follow-up, considering their last assessment made, the effect size was seen to be moderate to large (d = 0.780) based on their final assessment, which was very similar to receiving the worst possible score (FRAIL-Es = 5) (d = 0.770). The greatest increase in frailty, with the FRAIL-Es scale, was observed between admission and three months after discharge (46%), while the greatest decrease in frailty occurred between 3 and 6 months (32%). The percentage of patients with the lowest frailty score (FRAIL-Es = 0) at admission was 43%, while the percentage with the highest score (FRAIL-Es = 5) was 0.8%. At the other assessment timepoints, the minimum percentages were always greater than 15%, while the maximum percentages were always lower.
DiscussionThe FRAIL scale has not yet been widely adopted for assessing frailty in critically ill patients,34 although it has been used in other settings. The most widely used scale is the Clinical Frailty Scale (CFS),35 the Spanish version of which (CFS-España) has been validated36 with the same cohort of patients as the FRAIL-España scale.
Convergent and divergent validityThe main finding of our study is that the FRAIL-España scale demonstrates good convergent validity in relation to age, dependence, marital status, PCS, and comorbidities.
The relationship between frailty and age is controversial. Although we have observed age to be a risk factor for frailty on ICU admission and after hospital discharge, the correlation with the FRAIL-España scale is weak. López-Cuenca et al.34 reported no age differences between non-frail and frail patients. However, it should be noted that their study only included patients over 65 years of age. We did not find any other studies that implemented the FRAIL scale in critically ill patients. Gardiner et al.37 observed a relationship with age in a study of Australian women over 18 years of age. Other authors who implemented the CFS10,38–49 and CFS-España36 in critically ill patients over 18 years of age also reported this relationship. Thus, while the increased risk of frailty with age is irrefutable, it is important to note that frailty is also present in young patients as well as the elderly.50
The relationship of frailty to sex is also controversial. Although we observed that women had a higher risk of frailty upon admission, this relationship was not significant in the multivariate analysis and did not appear to be a risk factor for acquiring frailty at hospital discharge. Furthermore, in the study published by López-Cuenca et al.,34 although a higher percentage of frail women was reported, the difference was not significant. However, studies that have implemented the CFS38,40,42,45,47,49 or CFS-Es36 in critically ill adults have reported higher percentages of frailty in women. Therefore, the relationship between frailty and sex should be studied in greater depth, or the risk factors for frailty in men and women should be analyzed separately.
In a way similar to the study by López-Cuenca et al., we found an association between frailty and dependence for both instrumental activities and basic activities of daily living (BADL), with lower independence being related to greater frailty. The relationship with BADL is not surprising, since the fatigue, resistance, and ambulation items from the FRAIL-Es scale are also present in the Barthel scale. However, lower independence in each of the Lawton and Brody scale items is also related to frailty. Bagshaw et al.51 and Arias-Rivera et al.36 have reported this same relationship when implementing the CFS in critically ill patients aged 50–65 and over 18 years, respectively. Our findings regarding the relationship between frailty and hospital admission in the previous year and the existence of comorbidities confirm the data reported by López-Cuenca et al.,34 and by Hope et al.45 on implementing the CFS in critically ill adults. Frail patients have experienced more previous hospital admissions. One possible explanation for this association could be increased patient dependence, or dependence acquisition following these previous admissions.52
We did not find any studies on the relationship between the FRAIL-España scale and quality of life. According to our analysis, there seems to be a strong correlation between the FRAIL-España scale and PCS from 6 months after discharge: the better the quality of life of the patients, the less frail they are observed to be. However, we found no correlation with MCS. The same results were observed when implementing the CFS-España scale36: patients with poor PCS have a higher risk of frailty upon ICU admission, whereas poor MCS is not a risk factor for frailty. In a phenomenological study involving frail patients, González-Gil and Arias-Rivera53 observed a mental strength in frail patients that could explain this lack of a correlation. It is possible that, due to their physical limitations, these patients have developed strong resilience to adapt to their situation, which helps them to move forward despite their frailty.
Predictive validityFrailty has been identified as a risk factor for developing ICU-acquired weakness. However, it is important to note that few patients exhibit active mobilization in either group. While not the aim of this study, the acquisition of muscle weakness may be influenced by deep sedation levels and episodes of hyperglycemia,54,55 which are more prevalent in frail patients. Other influencing factors include dependence and the need for extrarenal filtration therapy. In any case, the relationship between frailty, as assessed by the CFS scale, and ICU-acquired muscle weakness56 in critically ill adults is controversial. While some authors39,42 support the existence of such a relationship, others do not.40,43,49 For example, Muscedere et al.13 conducted a systematic review and found no evidence of such a relationship. Therefore, further analysis is required to evaluate this relationship.
Patients who are frail upon admission to the ICU utilize more resources and require more ventilatory support, though significance is only reached in the case of high-frequency oscillatory ventilation, as has been reported by other authors.14,34 Xia et al.14 found no differences between frail and non-frail patients in the need for IMV, vasoactive drugs, or renal replacement therapies, between frail and non-frail patients in their systematic review. However, their review was limited to studies with a critical patient population over 65 years of age. Muscedere et al.13 also found no greater use of vasoactive drugs or renal replacement therapies in frail patients in their review, which included articles with a younger population. This controversy may be explained by possible LLST orders for frail patients or by other confounding variables yet to be explored.
Despite this increased use of therapies, we have observed no differences in ICU or hospital stays, similar to the findings in the reviews by Muscedere et al.13 and Xia et al.14 The higher mortality rate among frail patients and the greater likelihood of discharge to long-term care facilities may explain why no differences were found.
The association of frailty with mortality as an independent predictor has been widely studied and reported,11–15,34 in relation to mortality in the ICU, in the hospital, and after hospital discharge. In this sense, the predictive value of mortality in the FRAIL-España scale coincides with the published data.
Among hospital survivors, frailty at the time of ICU admission has been shown to be predictive of PCS at all assessment timepoints. These findings are consistent with those reported by Muscedere et al.13 and by other authors57,58 who have implemented the CFS scale in critically ill adults. These observations could be related to the development of muscle weakness or increased (or acquired) dependence52 after hospital discharge.
Sensitivity to changeIt is not possible to compare the FRAIL-Es scale’s ability to detect changes in frailty over time because this is a psychometric property that has not been analyzed (or at least published) in other studies. Nevertheless, a high change effect has been observed that is very similar to that reported with the Clinical Frailty Scale-España (d = 0.832),36 which was evaluated in the same cohort of patients.
Strengths and limitationsThe present study has several strengths. First, the multicenter design and large patient sample size lend power to the results. Second, the study reports data on the prevalence of frailty, as assessed using the FRAIL-España scale, in patients admitted to Spanish ICUs. Additionally, the study analyzes the validity of a Spanish-adapted frailty scale in the context of critically ill adult patients. This is important because many studies only analyze older patients, but this study analyzes frailty in younger patients. Furthermore, the scale was adapted by health professionals who work with critically ill patients. The first reference to frailty in critically ill patients dates back to 2011,7 and more articles analyzing frailty and its relationship with other variables are needed.
However, the study also has some limitations. First, some subgroups, such as patients with severe or total dependence, patients with university education, and patients with morbid obesity, are underrepresented. Therefore, the results obtained should be interpreted with caution until they can be contrasted in other studies. Additionally, some variables, such as muscle weakness, could not be measured on a weekly basis due to patient noncompliance.
Another possible limitation of the study could refer to the selection of the patients. It excluded those for whom it was impossible to obtain all the necessary data upon admission to the ICU (from other ICUs); those who could not be adequately assessed, due to communication difficulties; those who could not be followed-up on, such as patients with a brain death diagnosis or LLST orders; and patients with COVID-19 (since these latter patients could not be included from the beginning of the pandemic, the most methodologically sound approach was deemed to be excluding them once recruitment could resume). Excluding these patients may have impacted the observed prevalence of frailty or the baseline characteristics of the patients. Future research with this scale, or practical applications of the tool, should consider the patient cohort in which it has been validated.
GeneralizabilityDue to the study’s sample size and the geographical variability of the participating Units, the results obtained can be generalized to the rest of the Spanish ICUs.
Clinical implementationThe FRAIL-España scale is simple and quick to apply.16,36 It is equally reliable when used by intensive care nurses or intensivists.59 It does not require prior training for implementation, nor is active patient participation essential; the scale can be administered by questioning the patient’s closest relatives or caregivers. This scale is used in primary care and allows us to obtain data on the evolution or change in the patient's frailty over time.
Evaluating the patient at the time of admission to the Unit and considering the situation of the previous month would allow us to plan therapies, such as early rehabilitation or stricter blood glucose control. This is important because frail patients are at a greater risk of developing muscle weakness and experiencing hypoglycemic or hyperglycemic episodes.
Post-intensive care syndrome (PICS) can affect up to 64% of all ICU survivors within three months of hospital discharge, and up to 56% at one year.60 While these patients typically experience impairment in multiple areas (physical, cognitive, and/or mental), the physical domain is most frequently impacted, with a prevalence rate of up to 92.9%.61 Frail patients are at increased risk of developing PICS. Therefore, detecting PICS early through follow-up in inpatient units and after hospital discharge is seen as a powerful strategy.
Future researchThe FRAIL scale is widely used in primary care settings to evaluate frailty in elderly patients. We believe that more studies using this scale are needed in adult patients, not only elderly patients, and in critically ill patients. Implementing the FRAIL scale in primary care settings would allow for the early detection of individuals with pre-frailty, enabling the prevention of unfavorable outcomes and the improvement of baseline conditions before potential hospital and/or ICU admission.
ConclusionsFrailty in patients admitted to the ICU, as assessed by the FRAIL-España scale, shows good convergent validity with age, dependency, marital status, comorbidities, PCS, and admission to an acute care facility within the previous year.
The FRAIL-España scale demonstrates predictive validity for adverse events, including ICU-acquired weakness, altered blood glucose control, and increased resource utilization (e.g., renal replacement techniques, high-flow oxygen therapy, and vasoactive drugs). The FRAIL-España scale also has good predictive validity for LLST, patient destination at hospital discharge, and in-hospital and discharge mortality.
The FRAIL-España scale is highly sensitive to changes in frailty over time.
CRediT authorship contribution statementSusana Arias-Rivera: conceptualization, methodology, software, validation, formal analysis, research, resources, data management, writing the original draft, editing and proofreading, visualization, supervision, project management, and obtaining funding.
Fernando Frutos-Vivar: methodology, validation, research, writing the original draft, editing and proofreading, and visualization.
María Nieves Moro-Tejedor: conceptualization, methodology, validation, research, editing and proofreading, visualization.
M. Mar Sánchez-Sánchez: validation, research, resources, editing, and proofreading.
Emilia Romero-de San Pío: validation, research, resources, editing, and proofreading.
Yeray Gabriel Santana-Padilla: validation, research, resources, editing, and proofreading.
Gemma Via-Clavero: validation, research, resources, editing, and proofreading.
M. del Rosario Villar-Redondo: validation, research, resources, editing, and proofreading.
M. Jesús Frade-Mera: validation, research, resources, editing, and proofreading.
Mónica Juncos Gozalo: validation, research, resources, editing, and proofreading.
Elisabeth Gallart-Vivé: validation, research, resources, editing, and proofreading.
Marta Raurell-Torredà: methodology, validation, research, resources, editing and proofreading, and visualization.
Critical reviews of the intellectual content: all authors reviewed the final manuscript before submitting it for publication.
Declaration of Generative AI and AI-assisted technologies in the writing processNo AI has been used.
Financial supportThis study was supported by the Spanish Ministry of Economy and Competitiveness ISCIII grantPI20/01231.
The authors declare that they have no conflicts of interest.
Hospital Universitario de Getafe, Getafe (Madrid): Raquel Jareño-Collado, Raquel Sánchez-Izquierdo, Eva I. Sánchez-Muñoz, Virginia López-López, Pedro Vadillo-Obesso, Jesús Cidoncha-Moreno, Sonia López-Cuenca, Lorena Oteiza-López, Fernando Frutos-Vivar, María Nogueira-López, Marta Suero-Domínguez, M. Carmen Martín-Guzmán, Olga Rodríguez-Estévez, Juan Enrique Mahía-Cures.
Hospital Universitario Central de Asturias, Oviedo (Asturias): Julieta Alonso-Soto, Esther González-Alonso, Lara María Rodríguez-Villanueva, Montserrat Fernández-Menéndez, Roberto Riaño-Suárez, María González-Pisano, Adrián González-Fernández, Helena Fernández-Alonso, José Antonio Gonzalo-Guerra.
Complejo Hospitalario Universitario Insular Materno-Infantil (Las Palmas de Gran Canaria): Zaida Alamo-Rodríguez, Famara Díaz-Marrero, Benjamín Guedes-Santana, Aridane Méndez-Santana, José Rodríguez-Alemán, Lorea Ugalde-Jauregui.
Hospital General Universitario Gregorio Marañón, Madrid (Madrid): Ángeles Ponce-Figuereo, Ana Muñoz-Martínez, Iñaki Erquicia-Peralt.
Hospital Universitario de Bellvitge, l'Hospitalet de Llobregat (Barcelona): Laia Martínez-Bosch, Jordi Torreblanca-Parra, Vicente Corral-Vélez.
Hospital Clínico Universitario de Santiago, Santiago de Compostela (A Coruña): Leticia Esmoris López, Natalia Vázquez Rodríguez, Gloria Güeto Rial, Isabel Lara Granja Gómez.
Vall d'Hebron University Hospital, Barcelona (Barcelona): Montserrat Aran Esteve, Bernat Planas Pascual.
Hospital Universitario del Sureste, Arganda del Rey (Madrid): Mónica Juncos Gozalo.
Hospital Universitario 12 de Octubre, Madrid (Madrid): María Teresa Pulido Martos, Candelas López López, Laura Martín Velázquez, Isabel Martínez Yegles, Amanda Lesmes González de Aledo, Francisco Javier Zarza Bejarano, Marta Sánchez Cortés, M. del Ara Murillo Pérez, Clara Cornejo Bauer, Laura Hernández López, Francisco de Paula Delgado Moya, Miguel Ángel Bejerano Casillas.
Department of Medicine, Faculty of Biomedical and Health Sciences, Universidad Europea de Madrid. Villaviciosa de Odón (Madrid): Israel John Thuissard-Vasallo, Cristina Andreu-Vázquez.
The following is Supplementary data to this article:

