


To assess the feasibility of using end-tidal carbon dioxide (EtCO2) as a non-invasive substitute for partial pressure of arterial carbon dioxide (PaCO2) in emergency department (ED) triage and follow-up, and to explore the potential of partial pressure of venous carbon dioxide (PvCO2) as an alternative to PaCO2.
DesignProspective cross-sectional study.
SettingTertiary university hospital.
Patients or participants97 patients presenting with acute respiratory distress to the ED.
InterventionsEtCO2, arterial blood gases, and venous blood gases measured at admission (0 min), 60 min, and 120 min.
Main variables of interestCO2 levels.
ResultsAmong 97 patients (mean age: 70.93 ± 9.6 years; 60.8% male), EtCO2 > 45 mmHg at admission showed strong positive correlations with PaCO2 and PvCO2 (r = 0.844, r = 0.803; p < 0.001, respectively). Significant positive correlation was observed between 60-min EtCO2 and PaCO2 (r = 0.729; p < 0.001). Strong correlation between PaCO2 and PvCO2 at 120 min when EtCO2 > 45 mmHg (r = 0.870; p < 0.001). EtCO2 was higher in hospitalized patients compared to discharged ones.
ConclusionsEtCO2 appears promising as a substitute for PaCO2 in ED patients with acute respiratory distress within the initial two hours of treatment. Venous blood gas sampling offers a less invasive alternative to arterial sampling, facilitating simultaneous blood tests.
Evaluar la viabilidad de utilizar el dióxido de carbono al final de la espiración (EtCO2) como un sustituto no invasivo de la presión parcial de dióxido de carbono arterial (PaCO2) en el triaje y seguimiento en el departamento de emergencias (ED), y explorar el potencial de la presión parcial de dióxido de carbono venoso (PvCO2) como alternativa a PaCO2.
DiseñoEstudio prospectivo transversal.
ÁmbitoHospital universitario terciario.
Pacientes o participantes97 pacientes que se presentaron con dificultad respiratoria en el ED.
IntervencionesSe midieron EtCO2, gases en sangre arterial y gases en sangre venosa al ingreso (0 min), 60 min y 120 min.
Principales variables de interésNiveles de CO2.
ResultadosEntre 97 pacientes (edad media: 70,93 ± 9,6 años; 60,8% hombres), EtCO2 > 45 al ingreso mostró correlaciones positivas fuertes con PaCO2 y PvCO2 (r = 0,844, r = 0,803; p < 0,001, respectivamente). Se observó una correlación positiva significativa entre EtCO2 a los 60 min y PaCO2 (r = 0,729; p < 0,001). Fuerte correlación entre PaCO2 y PvCO2 a los 120 min cuando EtCO2 > 45 (r = 0,870; p < 0,001). EtCO2 fue mayor en los pacientes hospitalizados en comparación con los dados de alta.
ConclusionesEtCO2 parece prometedor como sustituto de PaCO2 en pacientes del ED con dificultad respiratoria dentro de las dos primeras horas de tratamiento. La toma de muestras de gases en sangre venosa ofrece una alternativa menos invasiva a la toma de muestras arterial, facilitando pruebas de sangre simultáneas.
The first point of admission for patients experiencing acute respiratory distress is usually the emergency department (ED). Establishing a safe and protected setting for individuals experiencing respiratory distress is paramount. Furthermore, it is imperative to efficiently detect and diagnose any underlying factors contributing to their shortness of breath. For this reason, measuring devices that evaluate respiratory status with noninvasive, easily applicable, and reliable methods in busy ED environments are of interest. End-tidal carbon dioxide (EtCO2) measurement strengthens its place in clinical practice day by day as a handy and valuable method for evaluating patient ventilation in emergency settings.1–6
The use of EtCO2 monitoring is becoming increasingly common in a variety of clinical settings, both prehospital and hospital.7 In addition to being considered the most reliable confirmation method of the correct placement of the endotracheal tube, it also helps the physician in life support efforts, such as determining the quality of cardiopulmonary resuscitation and detecting the return of spontaneous circulation.8,9 Capnography is used in various situations, including procedural sedation and analgesia, patient transfer, pulmonary embolism, and acute follow-up of chronic obstructive pulmonary disease (COPD).10–14
EtCO2 is the level of carbon dioxide released at the end of expiration. For noninvasive EtCO2 measurement, capnometry, which provides only numerical values, or capnography, which provides both graphical and numerical results, is used. Measurement is made as a mainstream or a sidestream. In sidestream, the CO2 sensor is located inside the monitor, and a small portion of the exhaled air reaches the breathing circuit through a cable with a delay. In the mainstream type, the CO2 sensor is directly connected to the breathing circuit and displays the result without delay. While sidestream can be used in intubated and non-intubated patients, mainstream is primarily used in intubated patients.2,6,12,15 While increased dead space and clogging with secretions are substantial disadvantages in the sidestream type, these are no longer a problem in the mainstream type, and the results are more reliable.2,6
Partial pressure of arterial carbon dioxide (PaCO2) is the gold standard for diagnosing and treating patients presenting to the ED with respiratory distress. However, in busy EDs, there is a need for fast, practical, cost-effective, and noninvasive methods that will help us comprehend the severity of patients while they are still in the triage phase. In many of the studies in the literature on non-intubated patients, correlation studies were conducted between EtCO2 measurements obtained through sidestream detectors and PaCO2.1,16–18
The main aim of this study is to determine whether the EtCO2 value obtained using the mainstream detector at the first presentation to the ED in non-intubated patients can be safely used instead of the patient's PaCO2 value. The reason for using the mainstream detector, which is used in intubated patients, instead of the sidestream detector in non-intubated patients is that the previously described disadvantages that may alter the measurement results, such as dead space and obstruction by secretions, are less likely to be encountered. The secondary aim of the study was to determine whether partial pressure of venous carbon dioxide (PvCO2) measurement would be an alternative to partial pressure of arterial carbon dioxide (PaCO2) measurement, especially in patients who are not suitable for EtCO2 (confused or intubated). The tertiary aim of the study was to determine whether EtCO2 measurement was associated with hospitalizations.
MethodsStudy design and settingIt was planned as a prospective cross-sectional study with patients who presented to the ED with respiratory distress between April and May 2023 (61 days). The study was conducted in the ED of a 317-bed tertiary university hospital with approximately 90,000 patient admissions per year. Local Ethics Committee approval was received for the study (Approval ID: 2023/42, dated March 20, 2023). Patients were included in the study by obtaining informed consent. Patient data were recorded on the study form simultaneously during the patients' application. Descriptive data were obtained from the hospital's electronic database and ED records.
Participants and measurementsPatients with a primary complaint of dyspnea regardless of etiology, older than 18 years of age, able to blow into a capnograph device and followed up in the emergency department for at least 2 h were included in the study. Of the 623 patients admitted to the emergency department with respiratory distress. We excluded 111 patients who refused to participate in the study, 162 patients with confused, uncooperative or ineffective blowing, 87 patients with inconclusive blood gas results due to coagulation, 25 patients undergoing tracheal intubation, 141 patients who have not been in the ED for at least 2 h (Fig. 1). Participation in the study was purely voluntary and not reliant on coercion. Demographic information of the patients, EtCO2 level, PaCO2 and PvCO2 levels, pulse oximetry saturation level (SpO2), and treatments given were recorded at the moment of first admission (0th minute), 60th minute, and 120th minute. The patients' hospitalization-discharge status, vital signs, and initial blood gas pH values were also noted. Arterial blood gas samples were obtained simultaneously from the radial artery, brachial artery, or femoral artery, and venous blood gas samples were obtained from the brachial vein simultaneously with heparinized syringes and quickly delivered to the laboratory.
Measuring EtCO2
EtCO2 measurements were performed by attaching a 3D-printed disposable apparatus (colorFabb 1.75 mm filament was used with a Creality Ender 3 Pro 3D printer) to the airway adapter of a mainstream EMMA® Capnograph device (PHASEIN AB Svärdvägen, Danderyd, Sweden). It is produced for intubated patients. It was obtained with spontaneous single pulses from patients presenting with respiratory distress. Carbon dioxide level was classified as follows: <35 mmHg (hypocarbia), 35−45 mmHg (normocarbia), and >45 mmHg (hypercarbia).19 End tidal carbon dioxide measurement takes 3 s and arterial and venous carbon dioxide measurement takes approximately 10 min.
Statistical analysisStatistical analyses were performed using SPSS software for Windows, version 23 (IBM, Chicago, IL, United States). Descriptive statistics are presented as numbers and percentages. Demographic data were presented as mean ± standard deviation (SD), or median (interquartile range). Spearman correlation analysis was used for correlation analyses between EtCO2, PaCO2, PvCO2, SpO2, and cigarette pack/year. If the Spearman correlation coefficient (r) is below 0.20, it is considered an insignificant correlation. A weak correlation is marked between 0.20−0.50, a moderate correlation is observed between 0.50−0.70, and a strong correlation is observed when it is greater than 0.70.20 Coefficients "i" were given as significance values "p." Correlation was considered significant at p < 0.05. The Pearson chi-square test and Fisher's exact test (when the expected number was less than five) were used for independent categorical variables. Bonferroni correction was made for subgroup analysis, and p < 0.016 was considered significant. The Mc Nemar test was used for dependent categorical variables. For the relationship between the treatment given with EtCO2 and hospitalization discharge, the Mann-Whitney U test was used for independent two-group comparisons that did not show normal distribution, and the Kruskal Wallis test was used for multi-group comparisons. Student-t test was used for numerical two-group variables with normal distribution. p < 0.05 was considered significant.
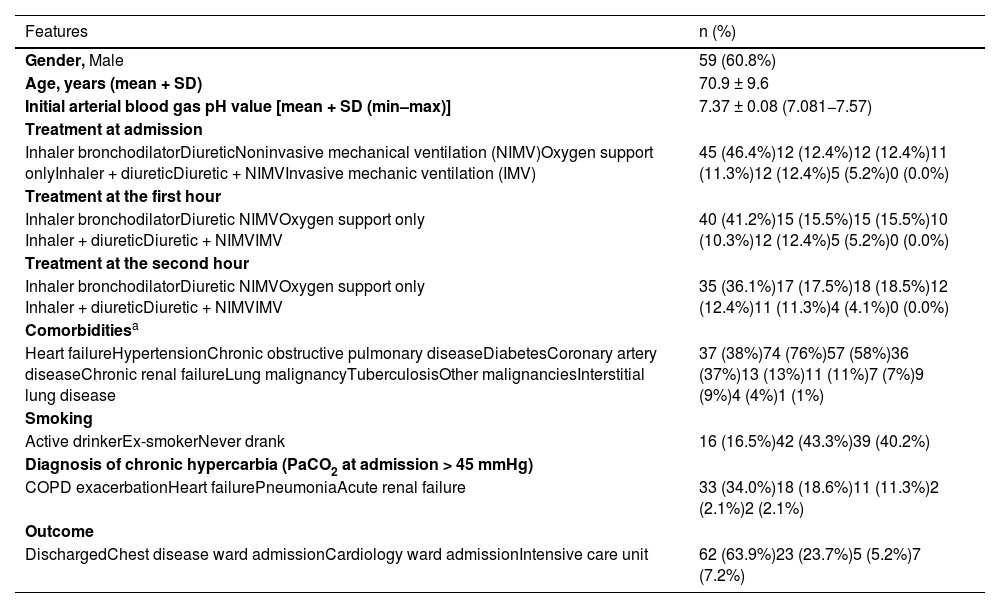
ResultsOf the 623 patients admitted to the ED with respiratory distress, 512 agreed to participate in the study (%82). Of these, 415 were excluded from the study for reasons explained in the method. The study was planned with 97 patients (Fig. 1). The average age of the patients was 70.9 ± 9.6 years, and 60.8% (n = 59) were male. 43.3% (n = 42) of the patients who admitted were ex-smokers. The most common comorbidities were hypertension (HT) with 76% (n = 74) and COPD with 58% (n = 57). 34% of the patients were hypercarbic at first presentation (0th minute, PaCO2 at admission >45 mmHg). Descriptive data of the patients are presented in Table 1.
Descriptive data of patients with respiratory distress (n = 97).
| Features | n (%) |
|---|---|
| Gender, Male | 59 (60.8%) |
| Age, years (mean + SD) | 70.9 ± 9.6 |
| Initial arterial blood gas pH value [mean + SD (min–max)] | 7.37 ± 0.08 (7.081−7.57) |
| Treatment at admission | |
| Inhaler bronchodilatorDiureticNoninvasive mechanical ventilation (NIMV)Oxygen support onlyInhaler + diureticDiuretic + NIMVInvasive mechanic ventilation (IMV) | 45 (46.4%)12 (12.4%)12 (12.4%)11 (11.3%)12 (12.4%)5 (5.2%)0 (0.0%) |
| Treatment at the first hour | |
| Inhaler bronchodilatorDiuretic NIMVOxygen support only Inhaler + diureticDiuretic + NIMVIMV | 40 (41.2%)15 (15.5%)15 (15.5%)10 (10.3%)12 (12.4%)5 (5.2%)0 (0.0%) |
| Treatment at the second hour | |
| Inhaler bronchodilatorDiuretic NIMVOxygen support only Inhaler + diureticDiuretic + NIMVIMV | 35 (36.1%)17 (17.5%)18 (18.5%)12 (12.4%)11 (11.3%)4 (4.1%)0 (0.0%) |
| Comorbiditiesa | |
| Heart failureHypertensionChronic obstructive pulmonary diseaseDiabetesCoronary artery diseaseChronic renal failureLung malignancyTuberculosisOther malignanciesInterstitial lung disease | 37 (38%)74 (76%)57 (58%)36 (37%)13 (13%)11 (11%)7 (7%)9 (9%)4 (4%)1 (1%) |
| Smoking | |
| Active drinkerEx-smokerNever drank | 16 (16.5%)42 (43.3%)39 (40.2%) |
| Diagnosis of chronic hypercarbia (PaCO2 at admission > 45 mmHg) | |
| COPD exacerbationHeart failurePneumoniaAcute renal failure | 33 (34.0%)18 (18.6%)11 (11.3%)2 (2.1%)2 (2.1%) |
| Outcome | |
| DischargedChest disease ward admissionCardiology ward admissionIntensive care unit | 62 (63.9%)23 (23.7%)5 (5.2%)7 (7.2%) |
The results of EtCO2 values between hospitalized and discharged patients, including measurements at admission, 60th and 120th minutes, are shown in Table 2. EtCO2 value was statistically significantly higher in all measurements in hospitalized patients than in discharged patients.
Comparison of end-tidal carbon dioxide (EtCO2) values of patients with respiratory distress according to hospitalization status.
| Parameters | All patients | Inpatients | Discharged | p value |
|---|---|---|---|---|
| EtCO2 at admission | 35 (30−45) | 46.17 ± 15.235 | 33.95 ± 9.31 | <0.001 |
| EtCO2 at the first hour | 33 (28−41) | 42.69 ± 14.784 | 32.90 ± 7.923 | <0.001 |
| EtCO2 at the second hour | 34 (29−41.25) | 42.37 ± 15,923 | 34.06 ± 8.400 | 0.006 |
Values were shown as mean ± SD, or median (interquartile range). p < 0.05 was considered statistically significant.
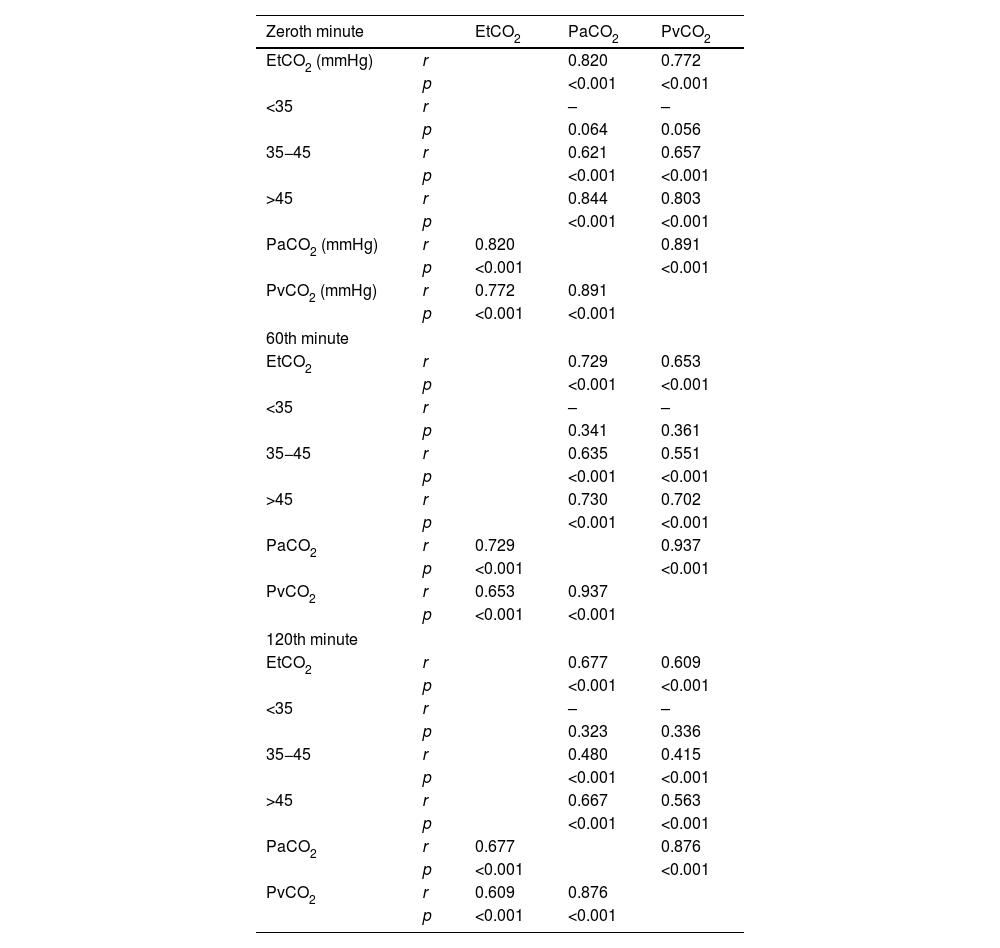
Table 3 shows the results of the correlations between EtCO2 and PaCO2 and PvCO2 measurements at the time of admission, the sixtieth and the 120th minute, in detail. When the EtCO2 value was above 45 mmHg, a strong positive (r = 0.844 and r = 0.803) and significant relationship was found between EtCO2 and PaCO2 and PvCO2 measurements (p < 0.001 for both).
Correlation analyses of EtCO2 and PaCO2 and PvCO2 measurements.
| Zeroth minute | EtCO2 | PaCO2 | PvCO2 | |
|---|---|---|---|---|
| EtCO2 (mmHg) | r | 0.820 | 0.772 | |
| p | <0.001 | <0.001 | ||
| <35 | r | – | – | |
| p | 0.064 | 0.056 | ||
| 35−45 | r | 0.621 | 0.657 | |
| p | <0.001 | <0.001 | ||
| >45 | r | 0.844 | 0.803 | |
| p | <0.001 | <0.001 | ||
| PaCO2 (mmHg) | r | 0.820 | 0.891 | |
| p | <0.001 | <0.001 | ||
| PvCO2 (mmHg) | r | 0.772 | 0.891 | |
| p | <0.001 | <0.001 | ||
| 60th minute | ||||
| EtCO2 | r | 0.729 | 0.653 | |
| p | <0.001 | <0.001 | ||
| <35 | r | – | – | |
| p | 0.341 | 0.361 | ||
| 35−45 | r | 0.635 | 0.551 | |
| p | <0.001 | <0.001 | ||
| >45 | r | 0.730 | 0.702 | |
| p | <0.001 | <0.001 | ||
| PaCO2 | r | 0.729 | 0.937 | |
| p | <0.001 | <0.001 | ||
| PvCO2 | r | 0.653 | 0.937 | |
| p | <0.001 | <0.001 | ||
| 120th minute | ||||
| EtCO2 | r | 0.677 | 0.609 | |
| p | <0.001 | <0.001 | ||
| <35 | r | – | – | |
| p | 0.323 | 0.336 | ||
| 35−45 | r | 0.480 | 0.415 | |
| p | <0.001 | <0.001 | ||
| >45 | r | 0.667 | 0.563 | |
| p | <0.001 | <0.001 | ||
| PaCO2 | r | 0.677 | 0.876 | |
| p | <0.001 | <0.001 | ||
| PvCO2 | r | 0.609 | 0.876 | |
| p | <0.001 | <0.001 | ||
EtCO2: End-tidal carbon dioxide; PaCO2: Partial pressure of arterial carbon dioxide; PvCO2: Partial pressure of venous carbon dioxide. The correlation is significant at the p < 0.05 level; r: Spearman correlation coefficient.
When the EtCO2 value was above 45 mmHg, a strong positive and significant relationship was found between EtCO2 and PaCO2 and PvCO2 measurements (r = 0.730 and r = 0.702; p < 0.001 for both).
A strong positive and significant correlation was found between PaCO2 and PvCO2 measurement when the EtCO2 value was below 35 mmHg (r = 0.858; p < 0.001). A strong positive and significant relationship was seen when PaCO2 and PvCO2 EtCO2 values were between 35−45 mmHg (r = 0.883; p < 0.001). There was a strong positive and significant relationship between PaCO2 and PvCO2 measurement when the EtCO2 value was above 45 (r = 0.891; p < 0.001).
In the last measurements at the 120th minute, a moderately positive and significant relationship was found between EtCO2, PaCO2 and PvCO2 values (r = 0.677 and r = 0.609; p < 0.001 for both). When the EtCO2 value was above 45 mmHg, a moderate positive and significant relationship was observed between EtCO2 and PaCO2 and PvCO2 measurements (r = 0.667 and r = 0.563; p < 0.001 for both). When the EtCO2 value was below 35 mmHg, a moderately positive and significant correlation was observed between PaCO2 and PvCO2 measurement (r = 0.697; p < 0.001). A strong positive and significant (r = 0.791; p < 0.001) relationship was detected between PaCO2 and PvCO2 measurements when the EtCO2 value was between 35−45 mmHg. There was a strong positive and significant relationship between PaCO2 and PvCO2 measurement when the EtCO2 value was above 45 mmHg (r = 0.870; p < 0.001).
We found a strong positive and significant relationship between EtCO2 and PaCO2 measurements at admission (r = 0.820; p < 0.001). The variance explained by the variables on each other is 67% (Fig. 2). We found a strong positive and significant relationship between 60th-minute EtCO2 and PaCO2 measurement (r = 0.729; p < 0.001). The variance explained by the variables on each other is 53% (Fig. 3). A strong positive and significant relationship existed between PaCO2 and PvCO2 measurement at the 60th minute (r = 0.937; p < 0.001). The variance explained by the variables on each other is 87% (Fig. 4). A moderately negative and significant relationship existed between EtCO2 and SpO2measurement at admission (r = −0.516; p < 0.001). There was no significant relationship between EtCO2 and SpO2 measurement at the 60th minute and 120th minute (p = 0.402 and p = 0.771).
 and PaCO2 levels at the admission.")
 and PaCO2 levels at the time of 60th min.")

Our study found a high correlation between EtCO2 at admission (zero minutes) and PaCO2 and PvCO2 measurements (r = 0.820 and r = 0.772, respectively). We also found a high correlation between PaCO2 and PvCO2 (r = 0.891; p < 0.001). We found a moderately positive and significant relationship between EtCO2 and PaCO2 and PvCO2 measurements when the EtCO2 value was between 35−45 mmHg (r = 0.621 and r = 0.657, respectively; p < 0.001 for both). When the EtCO2 value was above 45 mmHg, a strong positive and significant relationship was found between EtCO2 and PaCO2 and PvCO2 measurements (r = 0.844 and r = 0.803, respectively; p < 0.001 for both). Apart from this, a strong correlation was observed between PaCO2 and PvCO2 for all measurements. These results showed that in triage patients presenting to the emergency department with respiratory distress, if the EtCO2 value measured with a single blow is above 45 mmHg, the patient is considered hypercapnic, and treatment can be started early. Another important conclusion is that venous blood gas measurement is a strong alternative to arterial blood gas measurement, which is an excruciating procedure.
Arterial blood gas sampling in a patient presenting with respiratory distress is often challenging for both the patient and the physician. It may need to be repeated from time to time. Many clinical studies have been designed to increase patient comfort and identify new reliable methods. One of the alternative methods is EtCO2 measurement. Healey et al. demonstrated a high correlation between EtCO2 and PaCO2 measured before and after withdrawal of assisted-controlled mechanical ventilation.21 Plewa et al. found that the patients' EtCO2 value obtained by the forced expiration model showed a high correlation with the PaCO2 value. They also reported the negative predictive value of capnographic hypercapnia (EtCO2 > 45 mmHg) in detecting arterial hypercapnia (PaCO2 > 45 mmHg) as 95%.22 Other studies conducted with non-intubated patients have also reported a high correlation.1,18
Measuring EtCO2 in non-intubated patients has difficulties. Patient cooperation comes first among these difficulties. Although the initial panic of outpatients with respiratory distress is another difficulty for measuring EtCO2 in the ED, it is easier than arterial blood gas sampling. Suzuki et al. their study of non-intubated patients followed up due to respiratory diseases found a high positive correlation between EtCO2 and PaCO2 (r = 0.88; p < 0.0001).23 Joe et al. in their study, it was stated that there was a significant correlation between EtCO2 measurement and PvCO2 in patients with chronic pulmonary disease and using oxygen (r = 0.63) and that the PvCO2 level of the patients could be predicted with capnography, which is a noninvasive method.24 These studies support our results. EtCO2 is a more comfortable, faster, and easily reproducible alternative to arterial blood gas sampling when starting the initial treatment of patients presenting to the ED with respiratory distress.
Venous blood gas sampling is easy. Although it is an invasive procedure, it is not as difficult for the patient and physician to repeat as arterial blood gas sampling. Therefore, understanding the relationship between PaCO2, EtCO2 and PvCO2 was investigated.25,26 However, studies in the literature contain a partial consensus. In a systematic review, only 22.5% of included studies identified a strong correlation between arterial and venous parameters.25 Predictably, different results may occur depending on patient characteristics. In their methodological study with 20 patients with various diagnoses and complaints, Lumholdt et al. investigated the mathematical adaptability of peripheral venous blood gas values to arterial blood gas values. They stated that there was a mathematically predictable relationship between PaCO2 and PvCO2.27 A study in non-intubated patients followed up for respiratory diseases indicated a positive correlation between PaCO2 and PvCO2 (r = 0.81; p < 0.001).23 Our study showed a high correlation between venous and arterial blood gas in terms of partial carbon dioxide pressure (pCO2) in patients with respiratory distress from admission until the second hour of treatment. In light of all these findings, end-tidal carbon dioxide measurement seems to be an excellent alternative to arterial carbon dioxide measurement. In addition, venous carbon dioxide measurement is a good alternative in non-cooperative patients unsuitable for non-invasive end-tidal carbon dioxide measurement. The fact that it is less painful and can be taken from the vein simultaneously with many other blood tests makes venous carbon dioxide measurement more important.
Conflicting results have been revealed in the literature regarding whether capnography can replace PaCO2 as a reliable tool in patients with acute respiratory distress.2,3,28,29 In our study, EtCO2 values of patients admitted with acute respiratory distress at admission and in the 1st and 2nd hours after treatment were associated with hospitalization. EtCO2 measurements were higher in hospitalized patients compared to discharged patients.
The main limitation of this study is that it was conducted in a single center with a study group consisting of patients who presented to the ED of a tertiary university hospital. The low number of cases in the city where the study was conducted caused the number of patients included in this study to be limited. Second, we did not correct pCO2 based on body temperature in any patient. Phan et al. noted that EtCO2 correlated better with pCO2 after temperature correction.17 Third, the patient's respiratory rate was not recorded. When the respiratory rate increases, the dead space ratio increases, and the EtCO2 level may decrease. Additionally, the capnometer may not detect EtCO2 changes in case of a high respiratory rate.24 The fourth limitation is that end tidal carbon dioxide measurement can only be performed in cooperative patients. Finally, conditions such as age, existing lung disease, and smoking may cause EtCO2 values to change. Prediction ability decreases in the elderly and those with lung disease.22 We did not perform subgroup analysis on the patients. Large-scale and multi-center studies in which subgroups are studied separately and necessary corrections are made according to the patient's vital values, such as respiratory rate and temperature, are needed to confirm this alternative diagnostic method.
ConclusionThe EtCO2 value obtained from adding an insufflation device we produced to the capnograph and spontaneously inhaling patients with respiratory distress is a powerful alternative to arterial blood gas in the ED triage of patients and the first two hours of acute treatment. It has also been shown that venous blood gas may be a good alternative. In patients with acute respiratory distress (patients who can cooperate and whose hemodynamics have not yet deteriorated), this simple, noninvasive EtCO2 measurement is also helpful in the early prediction of hospitalization decisions.
Author's contributionKS, MCD, MB contributed to conception; KS, MCD, MB contributed to design; MCD, EŞ, MB contributed to supervision; KS, HG, AKFK, MT, EE contributed to data collection and processing; KS, MCD contributed to analysis and interpretation; KS, MCD, EŞ, MB contributed to literature review; KS, MCD, EŞ, MB contributed to writing; MCD, MB contributed to critical review.
FundingThe author(s) received no financial support for the research, authorship, and/or publication of this article.
Declaration of interestThe author(s) declared no potential conflicts of interest with respect to the research, authorship, and/or publication of this article.
Availability of data and materialsSubmitted work is original and has not been published elsewhere in any language. Raw data are available for the editor on request.
Ethical statementEthics Committee approval was obtained from the local ethics committee (Date: March 20, 2023, Decision No: 2023/42).
Informed consentWritten consent was obtained from all patients.
Human rightsAuthors declare that human rights were respected according to the Declaration of Helsinki.
The address of the institution where the study was performedDüzce University, School of Medicine, Düzce, Türkiye.
None.

