


To evaluate the noise level in adult, pediatric and neonatal intensive care units of a university hospital in the city of Santa Marta (Colombia).
DesignA descriptive, observational, non-interventional study with follow-up over time was carried out.
Materials and methodsContinuous sampling was conducted for 20 days for each unit using a type i sound level meter, filter frequency in A weighting and Fast mode. We recorded the maximum values, the 90th percentile as background noise, and the continuous noise level.
ResultsThe mean hourly levels in the adult unit varied between 57.40±1.14 and 63.47±2.13dBA, with a maximum between 71.55±2.32 and 77.22±1.94dBA, and a background noise between 53.51±1.16 and 60.26±2.10dBA; in the pediatric unit the mean hourly levels varied between 57.07±3.07 and 65.72±2.46dBA, with a maximum of 68.69±3.57–79.06±2.34dBA, and a background noise between 53.33±3.54 and 61.96±2.85dBA; the neonatal unit in turn presented mean hourly values between 59.54±2.41–65.33±1.77dBA, with a maximum value between 67.20±2.13 and 77.65±3.74dBA, and a background noise between 55.02±2.03 and 58.70±1.95dBA. Analysis of variance revealed a significant difference between the hourly values and between the different units, with the time of day exhibiting a greater influence.
ConclusionsThe type of unit affects the noise levels in intensive care units, the pediatric unit showing the highest values and the adult unit the lowest values. However, the parameter exerting the greatest influence upon noise level is the time of day, with higher levels in the morning and evening, and lower levels at night and in the early morning.
Evaluar el nivel de ruido en las unidades de cuidado intensivo adulto, pediátrico y neonatal de un hospital universitario de la ciudad de Santa Marta (Colombia).
DiseñoEstudio descriptivo, observacional no intervencionista y con seguimiento a lo largo del tiempo.
Materiales y métodosSe realizó un muestreo continuo durante 20 días por cada unidad utilizando un sonómetro tipo i, con filtro de ponderación frecuencial A y temporal Fast. Se registraron los valores máximos, el percentil 90 como ruido de fondo y el nivel continuo de ruido.
ResultadosLos niveles medios horarios variaron entre 57,40±1,14-63,47±2,13dBA para la unidad de adultos, con un máximo entre 71,55±2,32-77,22±1,94dBA y un ruido de fondo entre 53,51±1,16-60,26±2,10dBA; para la unidad pediátrica la media horaria se establece entre 57,07±3,07-65,72±2,46dBA, con un máximo de 68,69±3,57-79,06±2,34dBA, y de 53,33±3,54-61,96±2,85dBA de ruido de fondo; finalmente, la unidad neonatal reporta entre 59,54±2,41-65,33±1,77dBA la media horaria, los máximos entre 67,20±2,13-77,65±3,74dBA, y fondo de 55,02±2,03-58,70±1,95dBA. El ANOVA evidenció una diferencia significativa entre los valores horarios y entre las unidades de cuidado intensivo, mostrando una mayor influencia la hora del día.
ConclusionesLos niveles de ruido en las unidades de cuidado intensivo se ven afectados por el tipo de unidad; se presentaron los valores más altos en la unidad pediátrica y los más bajos en la de adultos. No obstante, el parámetro que más influye en el nivel es la hora del día, con mayores niveles en la mañana y la tarde, y menores en la noche y la madrugada.
In hospitals, intensive care units (ICUs) are regarded as areas exposed to noise produced by medical equipment and human activity. Excessive noise levels can lead to stress and delirium among the patients admitted to such Units,1–4 as well as to fatigue and stress among the healthcare personnel.5–7
The literature shows that approximately 50% of all patients develop important sleep disturbances during their stay in the ICU. In this regard, noise reduces the duration and number of rapid eye movement (REM) periods,8 with an impact upon the physiological and psychological wellbeing of critical patients in the form of metabolic, endocrine and immune alterations.3
In the case of newborn infants admitted to such Units, it has been estimated that continuous and persistent exposure to excessive noise can lead to hearing loss, increased intracranial pressure, stress, arterial hypertension, metabolic instability, sleep disturbances, irritability and loss of appetite, particularly among premature infants.9–11
The literature reports mean a noise level in ICUs of 68 decibels A (dBA). As illustrative examples, an Austrian hospital recorded an average of 60–65dBA, while a University Hospital in Valencia (Spain) recorded a level of 55dBA. In a Children's Hospital in Cincinnati (USA) the mean noise level was found to be 71.9dBA, while in the ICU of the Hospital of Manitoba (Canada) the level was 68dBA.12,13 In adult ICUs (AICUs), the reported mean equivalent noise level (LAeq) was 52–84dBA,14–16 while in pediatric ICUs (PICUs), the literature describes levels in the range of 48–72dBA.17–20 Lastly, the noise levels in neonatal ICUs (NICUs) are reported to range between 45 and 90dBA.11,21–24
The present study was carried out to assess the equivalent continuous noise levels in three ICUs of a hospital in the city of Santa Marta (Colombia), and to evaluate the existence of differences or similarities among the analyzed Units –taking into account the repercussions of excessive noise upon critical patients admitted to the ICU.
Material and methodsStudy settingThe study was carried out in a university hospital in the city of Santa Marta (Colombia), with three general ICUs (no differentiation being made according to disease type) classified as AICU, PICU and NICU. The AICU cares for adults and young individuals over 15 years of age and has 19 beds with a mean occupation of 10±2 patients and an attending personnel of 7±3 professionals. The PICU in turn cares for patients between 31 days and 14 years of age and has 7 beds with a mean occupation of 3±2 patients and an attending personnel of 5±1 professionals. Lastly, the NICU cares for newborn infants between 0 and 31 days of age and has 14 cribs with a mean occupation of 8±1 patients and an attending personnel of 4±0 professionals.25
The ICUs operate in three shifts: morning (7:00–13:00h), afternoon (13:00–19:00h) and night (19:00–7:00h+1). Two family visiting periods of 20min each have been established: at 11:00h and 17:00h. In the NICU and PICU there are 8 feeding times per day at intervals of 3h, starting at 00:00h, while the AICU has three feeding times: at 8:00h, 12:00h and 18:00h.
Each ICU is staffed by a specialized physician who conducts a round of the Unit three times a day. In the AICU the rounds take place at 9:00h, 14:00h and 20:00h, while in the PICU and NICU they take place at 7:15h, 14:00h and 20:00h. In addition, the general practitioners in each ICU conduct their rounds at the patient bedside at the times of change in shift.
The procedures carried out in each ICU vary according to the requirements of the general practitioner and/or specialist, with no specific scheduling of such procedures. In effect, the latter are carried out in the course of each shift as requested by the medical personnel. The most common procedures are the collection of samples for laboratory tests, electrocardiograms, X-rays, the placement of central venous catheters, and interconsultation with the Ear, Nose and Throat, Nephrology and Urology Departments, among others, depending on the patient diagnosis.
Sampling designThe present study comprises an analytical, observational and non-interventional design with follow-up over time. It is therefore defined as an analytical study with non-longitudinal follow-up (follow-up study).
Continuous sampling was carried out in each ICU during 20 days, based on the methodology described by Vélez-Pereira2. In the case of the AICU, the measurement campaign took place between 19 August and 8 September 2012; in the PICU it took place between 15 September and 5 October 2012; and in the NICI it took place between 23 March and 12 April 2013. The noise levels were recorded using a Casella type I sound level meter (model CEL-633-C1K1) programmed to record data every 60s using filter frequency in A-weighting and Fast mode. The recorded acoustic parameters included LAeq,1h (to establish the noise level in 1h), percentile 90 (LA90, to establish the background noise level), and LAmax (to establish the maximum values).
The sound level meter was positioned in each ICU considering the descriptions of Vélez-Pereira,2 the conditions and internal dynamics of the ICU, and the authorizations and recommendations of the medical coordinators with the purpose of affecting the activities in the ICUs as little as possible. In the AICU we established a distance of 55cm from the ceiling and 123cm from the wall; in the PICU the distance was 55cm from the ceiling and 540cm from the wall; and in the NICU the distance was 60cm from the ceiling and 215cm from the wall.
Data processing and statistical analysesEquivalent continuous levelMicrosoft Excel® was used for noise data integration under 1-h intervals corresponding to the acoustic parameters investigated in each ICU (LAeq, LAmax and LA90). This allowed us to analyze the variability associated to hourly or daily cycles in the course of the sampling time. The integrated mean was obtained by applying Eq. (1):2
where i corresponds to observation of the A-weighted equivalent continuous level reported in the hourly interval j, and n is the total number of observations i in the hour j.Statistical analysis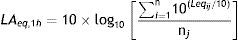
The statistical analysis was carried out with the IBM SPSS® version 20 statistical package, using the hourly averages of each ICU. Analysis of variance (ANOVA)2,23,26,27 was used to identify statistically significant differences in the hourly averages. In addition, nested ANOVA was used to compare the three ICUs, with a view to identifying statistically significant differences between the results obtained in the three units and determining which factor exerts the strongest impact upon variance (hour and ICU). Lastly, and in order to establish the possible incidence of the Hawthorne effect among the healthcare personnel, an ANOVA was performed of the first 5 days of sampling versus the remaining 15 days.
ResultsOn comparing the integrated mean hourly values of the three ICUs (Fig. 1), the highest LAeq,1h values were seen to correspond to the PICU, with a noise level variation range of 57.07±3.07–65.72±2.46dBA, followed by the NICU, with levels of 59.54±2.41–65.33±1.77dBA, and the AICU, with levels of 57.40±1.14–63.47±2.13dBA. This information was confirmed by performing an ANOVA of the data, where a significant difference between ICUs was identified, influenced mainly by the time variation in the course of the day, with an F-ratio=116.02 and p=0.00 (critical p-value=0.05), and 95% significance level.
 Adult intensive care unit. (b) Pediatric intensive care unit. (c) Neonatal intensive care unit of the hospital. dBA: decibels A; LAeq: equivalent noise level; LAmax: maximum noise level; LA90: noise level below which 90% of the measurements are found.")
Hourly averages of the acoustic parameters. (a) Adult intensive care unit. (b) Pediatric intensive care unit. (c) Neonatal intensive care unit of the hospital. dBA: decibels A; LAeq: equivalent noise level; LAmax: maximum noise level; LA90: noise level below which 90% of the measurements are found.
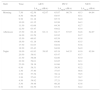
In contrast to the above, the three ICUs were found to exhibit similar trends with stable hourly levels between 07:30h and 17:30h, approximately; this was followed by a strong increase at 18:30h, and from 19:00h onwards a decrease was noted in LAeq,1h, extending until approximately 04:30h (Table 1). This was corroborated by the ANOVA of the hourly noise averages, with F=26.07 and p=0.000 (critical p-value=0.05), yielding a significant difference between the hourly averages, with a 95% confidence level. This information was evidenced by the generation of homogeneous groups as established from the cluster analysis applied to the hourly data of the ICU (Fig. 2). The analysis showed the values to be low in the early morning hours in the ICU (1:00–4:00h), with intermediate behavior in the late hours of the day (20:00–0:00h and 5:00h, nocturnal), and finally with the highest and most fluctuating noise values during the daytime (6:00–19:00h, including morning and afternoon).
Noise level integrated according to time of day and shifts.
| Shift | Time | AICU | PICU | NICU | |||
|---|---|---|---|---|---|---|---|
| LAeq,1h (dBA) | LAeq,1h (dBA) | LAeq,1h (dBA) | |||||
| Morning | 7:30 | 62.56 | 62.07 | 63.87 | 66.78 | 65.3 | 64.84 |
| 8:30 | 60.84 | 64.97 | 65.1 | ||||
| 9:30 | 61.18 | 65.72 | 64.0 | ||||
| 10:30 | 61.35 | 63.98 | 64.3 | ||||
| 11:30 | 61.06 | 64.36 | 62.7 | ||||
| 12:30 | 63.47 | 64.62 | 63.4 | ||||
| Afternoon | 13:30 | 62.18 | 62.11 | 64.17 | 67.07 | 64.8 | 64.97 |
| 14:30 | 61.59 | 63.92 | 63.7 | ||||
| 15:30 | 60.83 | 65.59 | 63.8 | ||||
| 16:30 | 61.18 | 64.90 | 63.5 | ||||
| 17:30 | 61.63 | 64.04 | 63.8 | ||||
| 18:30 | 63.43 | 64.88 | 64.9 | ||||
| Night | 19:30 | 61.93 | 59.95 | 65.19 | 64.35 | 63.0 | 62.94 |
| 20:30 | 58.91 | 63.47 | 63.7 | ||||
| 21:30 | 58.88 | 62.86 | 63.0 | ||||
| 22:30 | 59.01 | 63.05 | 62.1 | ||||
| 23:30 | 58.18 | 61.66 | 62.9 | ||||
| 0:30 | 58.51 | 59.50 | 62.2 | ||||
| 1:30 | 57.40 | 57.07 | 60.8 | ||||
| 2:30 | 57.58 | 58.14 | 59.5 | ||||
| 3:30 | 57.63 | 57.37 | 59.7 | ||||
| 4:30 | 58.82 | 57.21 | 59.9 | ||||
| 5:30 | 59.48 | 60.26 | 63.6 | ||||
| 6:30 | 62.56 | 63.76 | 64.2 | ||||
LAeq,1h (dBA): 1h equivalent noise level in decibels A; AICU: adult intensive care unit; NICU: neonatal intensive care unit; PICU: pediatric intensive care unit.
. AICU: adult intensive care unit; NICU: neonatal intensive care unit; PICU: pediatric intensive care unit.")
On examining the maximum noise values in the ICUs, we found the pattern to be the same as in the case of LAeq,1h–the PICU yielding the highest levels (68.69±3.57–79.06±2.34dBA), followed by the NICU (67.20±2.13–77.65±3.74dBA) and finally the AICU (71.55±2.32–77.22±1.94dBA). However, the values showed less variation than the integrated hourly noise data, with the exception of the NICU, which exhibited a greater range of variability than the other two ICUs, particularly in the early hours of the day. Regarding the ANOVA applied to the maximum noise levels, the type of ICU and time of day were seen to influence variance of the levels, with statistically significant differences (95% confidence level). However, the F-ratio of the hourly period (32.18) was greater than the F-ratio as per Unit (10.89)–thus indicating greater influence of the time of day upon the maximum noise levels in the ICU.
On the other hand, in relation to the results of the background noise, the order was found to differ with respect to the previous two acoustic parameters, being headed by the PICU (53.33±3.54–61.96±2.85dBA), followed by the AICU in this case (53.51±1.16–60.26±2.10dBA), and finally the NICU (55.02±2.03–58.70±1.95dBA). However, as can be seen in Fig. 1, there was greater similarity in the variation of LAeq,1h and LA90, these values being closely comparable among the three ICUs. This situation was not observed in the case of the noise level (LAeq,1h) and maximum level (LAmax). On applying the ANOVA to the background noise data, we again observed the influence of the Unit and time of day upon variation, with a greater influence than in the case of LAmax, though lower for LAeq,1h–with an F-ratio of 76.04 for the parameter ICU, and of 20.22 in the case of the parameter time. In both cases a significant difference was recorded, with a 95% confidence level.
All this information was corroborated by the ANOVA applied to the parameters, reflecting the interaction of the type of ICU and the time of day with the recorded noise levels. In this regard, the F-ratio for the interaction of the parameters was 1.09 for LAeq,1h, followed by 2.19 for LAmax and 3.33 for LA90. However, only in the case of the LAmax values did the type of Unit fail to influence the variations, while in the case of LAeq,1h and LA90 the influence in variation of the noise levels was 9.22% and 13.49%, respectively. In the case of the time of day, LAmax was found to influence variance by 36.16%, versus 27.02% in the case of LAeq,1h, and 26.10% in the case of LA90.
Lastly, the analysis carried out to determine the presence of the Hawthorne effect showed that only in the case of the PICU could minor modifications be inferred in the behavior of the healthcare personnel or changes in the medical teams in the first days of sampling, since ANOVA only identified significant differences between the LAmax and LA90 values between the first 5 days versus the remaining 15 days (with a 95% level of significance).
DiscussionThe analysis of the results obtained reflects the existence of important noise levels in all three ICUs. This is consistent with the data found in the literature, where noise increments have been recorded in ICUs, increasing from 57dBA in the daytime and 42dBA during the nighttime hours in the year 1960 to 72dBA in the daytime and 60dBA during the nighttime hours in the year 2005. This trend is mainly related to the increase in number of medical devices with acoustic alarms that serve as support for the medical activities in the ICU. An additional contributing factor is the noise generated essentially by human factors, including conversations among the personnel members, visits by the families, the falling of objects, opening and closing of doors, etc.9,12,28,29
On considering the LAeq values obtained and the noise levels contemplated by Resolution 8321 of 1983 of the Colombian Ministry of Health,30 it is clear that none of the three ICUs yielded mean levels of under 45dBA (the limiting level for calm zones) during the sampling period. This situation is also observed in the literature, where the noise limits are frequently seen to be exceeded in ICUs.12,31 These data are all the more serious considering that the background noise in the ICUs exceeded the maximum levels accepted by Colombian regulations and other international references– including the guidelines of the EPA (45dBA in the daytime and 35dBA at night), the National Institute of Occupational Health and Safety (40dBA in the daytime and 35dBA at night), Royal Decree 1386 of 1989 (40dBA in the daytime and 35dBA at night), the World Health Organization, the American Academy of Pediatrics (35dBA in the daytime and 30dBA at night), and the Chinese Medical Association (45dBA in the morning hours, 40dBA in the afternoon, and 20dBA at night), among others.29,32–35
Our results show that the highest values of the different acoustic parameters are mainly recorded during the daytime, in the course of medical controls, visits by social workers, nutritionists and epidemiologists, and in the hours close to the changing of shifts in the case of the AICU and PICU. In the case of the NICU, we not only recorded this increase during the mentioned activities and at the changing of shifts, but also observed a slight increase in noise levels every 3h, coinciding with feeding of the newborn infants (Fig. 3). This is consistent with the observations of González,36 Lawson et al.,27 Knutson37 and Konkani and Oakley,28 where the periods of greater noise in the ICU were correlated to the changing of shifts, the collection of laboratory test samples, visiting and feeding times, and the presence of social workers, nutritionists and physiotherapists.

The literature shows that noise has an impact upon patient recovery. A number of studies point to noise as one of the stressors underlying lack of sleep and physiological and psychological effects that prolong patient stay in the Unit.3,38 Although the LAeq,1h values recorded in our three ICUs did not exceed 90dBA (levels above which hearing damage can occur), they were above 65dBA, which is associated to effects upon the hypothalamic-adrenal gland system, with alterations in heart rate and an increased risk of complications in adult patients,12 together with interruptions in the sleep periods that are important for patient recovery.3
The results of the present study show that in relation to the maximum noise levels, the duration of exposure to over 90dBA was brief or inexistent (only 0.42% of the time sampled in the PICU exceeded this level). In the case of 65dBA, the PICU registered this level 33% of the time (equivalent to about 11h a day), followed by the NICU with 29% (equivalent to 9h a day) and the AICU with 4% (equivalent to 1h a day). This information evidences a risk of patient complications– a situation that is all the more critical on analyzing the time period in which the levels exceed the recommended references, since the mean hourly noise values (LAeq,1h) exceeded the recommended limits in 100% of the measured time.
It is thus seen that the noise levels recorded in our ICUs could have an impact upon the physiological and psychological wellbeing of the patients, fundamentally as a consequence of the effects described in the literature.8 The effects associated to noise are subjective and depend on the individual and disease condition involved. It should be noted that the risk of hearing loss or damage is further increased in newborn infants due to the change in environment and their inherent biological vulnerability, since these patients are removed from the safety of the mother to hostile surroundings that increase the risk of hearing alterations.1,9,10 Nevertheless, in order to establish the direct effects of noise, studies are needed in which health professionals assess and monitor the patients during the period of time in which the noise levels are evaluated in the ICU.
Regarding the risk for the health professionals posed by high noise levels in the ICU, the recorded levels fall well short of the 90dBA established for an 8-h period of exposure to noise in the work place30 (AICU presenting 62dBA on average, PICU 66dBA, and NICU 64dBA). According to Garrido Galindo et al.,7 the values recorded pose a moderate to high risk of directly or indirectly affecting emotions and physiological and psychological aspects of the medical and nursing personnel–resulting in the appearance of burnout syndrome.
ConclusionsThe lowest LAeq,1h values corresponded to the AICU. The values corresponding to the PICU and NICU were similar, with only some differences during certain hourly intervals. Considering the time at which different activities inherent to the Unit were carried out and the increase in noise levels observed in the figures, a series of activities such as the changing of shifts, visits and patient feeding were seen to exert a possible influence upon the noise levels in the ICU.
From the statistical perspective, ANOVA revealed the existence of statistically significant differences between the acoustic parameters in the ICUs–the time of day being the variable with the strongest influence upon the variations in noise level in the Unit.
Financial supportThis study was supported by a grant from the Departamento Administrativo de Ciencia, Tecnología e Innovación-Colciencias through the Programa Jóvenes Investigadores e Innovadores, with co-funding from the Universidad del Magdalena.
Conflicts of interestThe authors declare that they have no conflicts of interest.
The authors thank the healthcare and administrative personnel of the ICUs for their collaboration. Thanks are also due to the Universidad del Magdalena and the Departamento Administrativo de Ciencia, Tecnología e Innovación-Colciencias for the support received through the Programa Jóvenes Investigadores e Innovadores.
Please cite this article as: Garrido Galindo AP, Camargo Caicedo Y, Vélez-Pereira AM. Nivel de ruido en unidades de cuidado intensivo de un hospital público universitario en Santa Marta (Colombia). Med Intensiva. 2016;40:403–410.

