


Edited by: Ana Ochagavía - Hospital Universitario de Bellvitge. L'Hospitalet de Llobregat. Barcelona. Spain.
Last update: March 2024
More infoThe usefulness of ultrasound for chest exploration was described in 1968. It was not until the 1990s, when its use became widespread in Intensive Care Units as a diagnostic, monitoring and procedural guide tool. The fact that it is a non-invasive tool, accessible at the bedside, with a sensitivity and specificity close to computerized tomography (CT) and with a short learning curve, have made it a mandatory technique in the management of critically ill patients.
It is essential to know that there are different air/fluid ratio generated by different pathologies that gives rise to one echographic pattern or another. The identification of these patterns together with the clinical information will allow to make an accurate diagnosis in most settings of respiratory failure.
Likewise, we must not forget the importance of evaluating diaphragmatic function by ultrasound during weaning from mechanical ventilation.
La utilidad de la ultrasonografía para la exploración del tórax fue descrita en 1968. No es hasta la década de los 90 cuando se generaliza su uso en las unidades de cuidados intensivos como una herramienta diagnóstica, de seguimiento y guía en procedimientos invasivos. Que sea una herramienta no invasiva, accesible a pie de cama, con una sensibilidad y especificidad cercanas a la tomografía computarizada (TC) y con una curva de aprendizaje corta, la ha convertido en una técnica de uso obligado en el manejo del paciente crítico.
Es fundamental conocer que la distinta relación aire/fluido que generan las distintas patologías pulmonares da lugar a distintos patrones ecográficos. La identificación de estos patrones junto con la información clínica nos permitirá hacer un diagnóstico acertado en la mayor parte de causas de insuficiencia respiratoria.
Asimismo, no debemos olvidar la importancia de la evaluación de la función diafragmática mediante ecografía durante la desconexión de la ventilación mecánica.
The use of ultrasound for exploration of the thorax was first described in 1968 by Ross et al. However, it was not until the 1990s that Lichtenstein disproved the classical assumption that the lungs were not evaluable with ultrasound. In the last two decades thoracic and diaphragmatic ultrasound has become a crucial tool for diagnosis and monitoring, and for guidance in invasive procedures, in any Intensive Care Unit (ICU).
The present chapter focuses on explaining the principles and particularities of this technique, describing the fundamental patterns that allow a correct diagnosis of the most frequent causes of acute respiratory failure (ARF). In addition, a specific section will be dedicated to explaining the protocols and parameters most commonly used in assessing diaphragmatic function with ultrasound.
Basic principles and particularities of thoracic ultrasoundThe use of ultrasound has gradually increased in the intensive care setting. The information obtained from the different ultrasound modes can be interpreted and integrated in the global assessment, during the exploration of the patient.
Contributions of thoracic ultrasound in the critical patientSeveral advantages have made thoracic ultrasound an essential tool in the management of the critical patient:
- •
The absence of radiation exposure: the thoracic diagnostic approach in critical patients traditionally has been based on plain radiographs, and due to the many tests needed, the amount of avoidable radiation exposure is significant.1
- •
Use at the patient bedside: this minimizes the risks of patient transfer, and avoids healthcare personnel exposure risk.
- •
The explorations can be made as often as necessary, and can be recorded and compared over time.1
- •
The technique is superior to plain radiography in detecting pneumothorax, pleural effusion (PE), pneumonia and alveolar-interstitial syndrome (AIS), and in the differential diagnosis of acute dyspnea. The evaluation of patients with ARF based on the BLUE (Bedside Lung Ultrasound in Emergency) protocol is one of the known and consolidated applications of lung ultrasound.2
- •
The use of ultrasound guidance has been shown to improve the safety of invasive procedures.
- •
The portable devices employed in ultrasound exploration are easier to sterilize than other radiological devices, since they have smaller surface areas.3
The technique has some limitations1–3 that are mostly similar to those of other explorations:
- •
Learning to use the technique requires a structured training process; interpretation of the exploration findings is, therefore, dependent upon operator experience and training.
- •
The clinical information is the determining element helping to interpret the data obtained from thoracic ultrasound (scantly specific though very sensitive signs).
- •
The ultrasound system and probe may constitute a reservoir for germs and a source of contamination.
- •
Thoracic ultrasound is a surface imaging technique. The underlying pathology cannot be visualized if the disease process does not extend to the pleura.
The choice of probe is the most important consideration for correct ultrasound evaluation of the lungs. Because of the conflict between resolution and penetration, choosing a probe suited to the disease condition we intend to explore is important. In evaluating pleural disease, we need a high-resolution probe operating in the range of 7-10 MHz. This probe reaches an exploratory depth of about 6 cm. In contrast, when studying lung disease, the required exploratory depth is approximately 25-30 cm, and which requires operating at a frequency of about 3.5-5 MHz.1
Exploration is carried out with the patient in the supine position, and dividing each hemithorax into quadrants. There are several protocols for transthoracic exploration with lung ultrasound. Most of them identify three exploration areas1,4 (Fig. 1). The exploration starts with the study of the upper portions of the lung, followed by the lower zones, with the following steps:
- 1
Two-dimensional (2D) exploration of the quadrant: the probe is positioned perpendicular to the ribs and centered on an intercostal space.
- 2
Once the two-dimensional image has been obtained, a study in M mode is performed that is essential for diagnosing normal lung, pneumothorax and pleural effusion.
- 3
Color Doppler study: This is used whenever a subpleural pulmonary consolidation pattern appears, allowing identification of the pulmonary circulation.
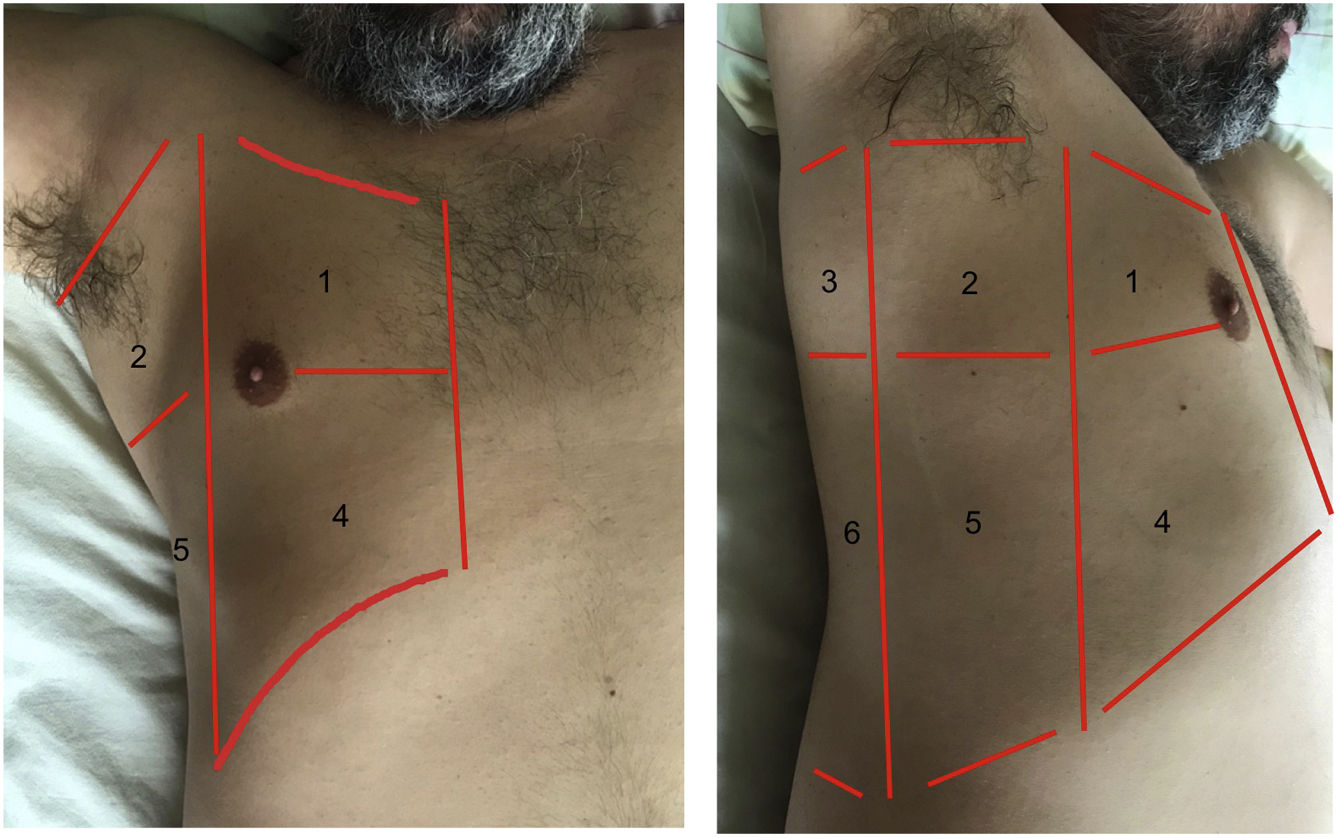
Areas for ultrasound exploration of the thorax.
The anterior area comprises the space delimited between the sternum (medial), the anterior axillary line (lateral), the clavicle (cranial) and the diaphragm (caudad). The lateral area comprises the space delimited by the anterior axillary line (medial), the posterior axillary line (lateral), the axilla (cranial) and the diaphragm (caudad). The posterior area comprises the space delimited by the posterior axillary line (lateral), the paravertebral line (medial), the margin of the trapezius muscle (cranial) and the diaphragm (caudad). Each of them in turn can be subdivided into a superior zone and an inferior zone, resulting in 6 echographic exploration areas.
Three basic principles must be considered in order to interpret thoracic ultrasound:
Air does not conduct ultrasoundTherefore, if the lung is ventilated below the pleural line, we will only see artifacts. If otherwise, we observe the true anatomical image, as in pneumonic consolidation or effusion with lung collapse (Suppl. Fig. 1).5
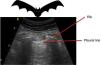
All the signs/artifacts arise from the pleural lineOn interpreting the image, we first should identify the pleural line, which is seen as a hyperechoic structure located between the two acoustic shadows generated by two consecutive ribs. By positioning the probe perpendicular to the ribs we obtain the so-called “bat sign” (Fig. 2), and sliding between the visceral and parietal pleura in turn gives rise to the pleural “sliding” sign (Video 1).5,6
Air/fluid ratio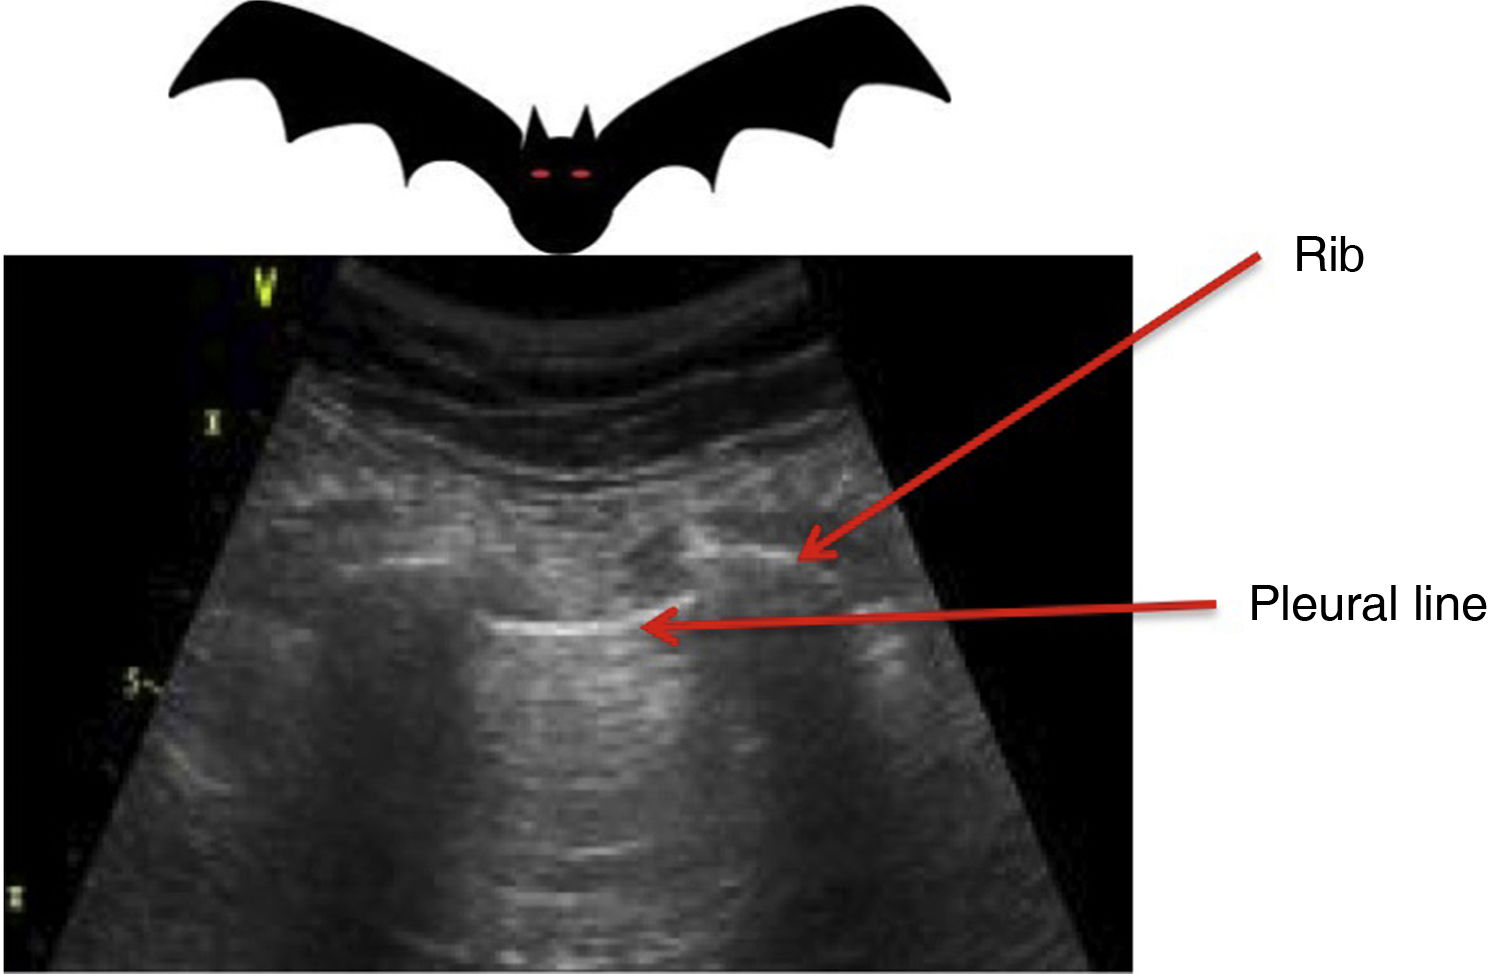
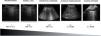
The different ultrasound patterns reflect a different air/fluid ratio (Fig. 3).5
Ultrasound patterns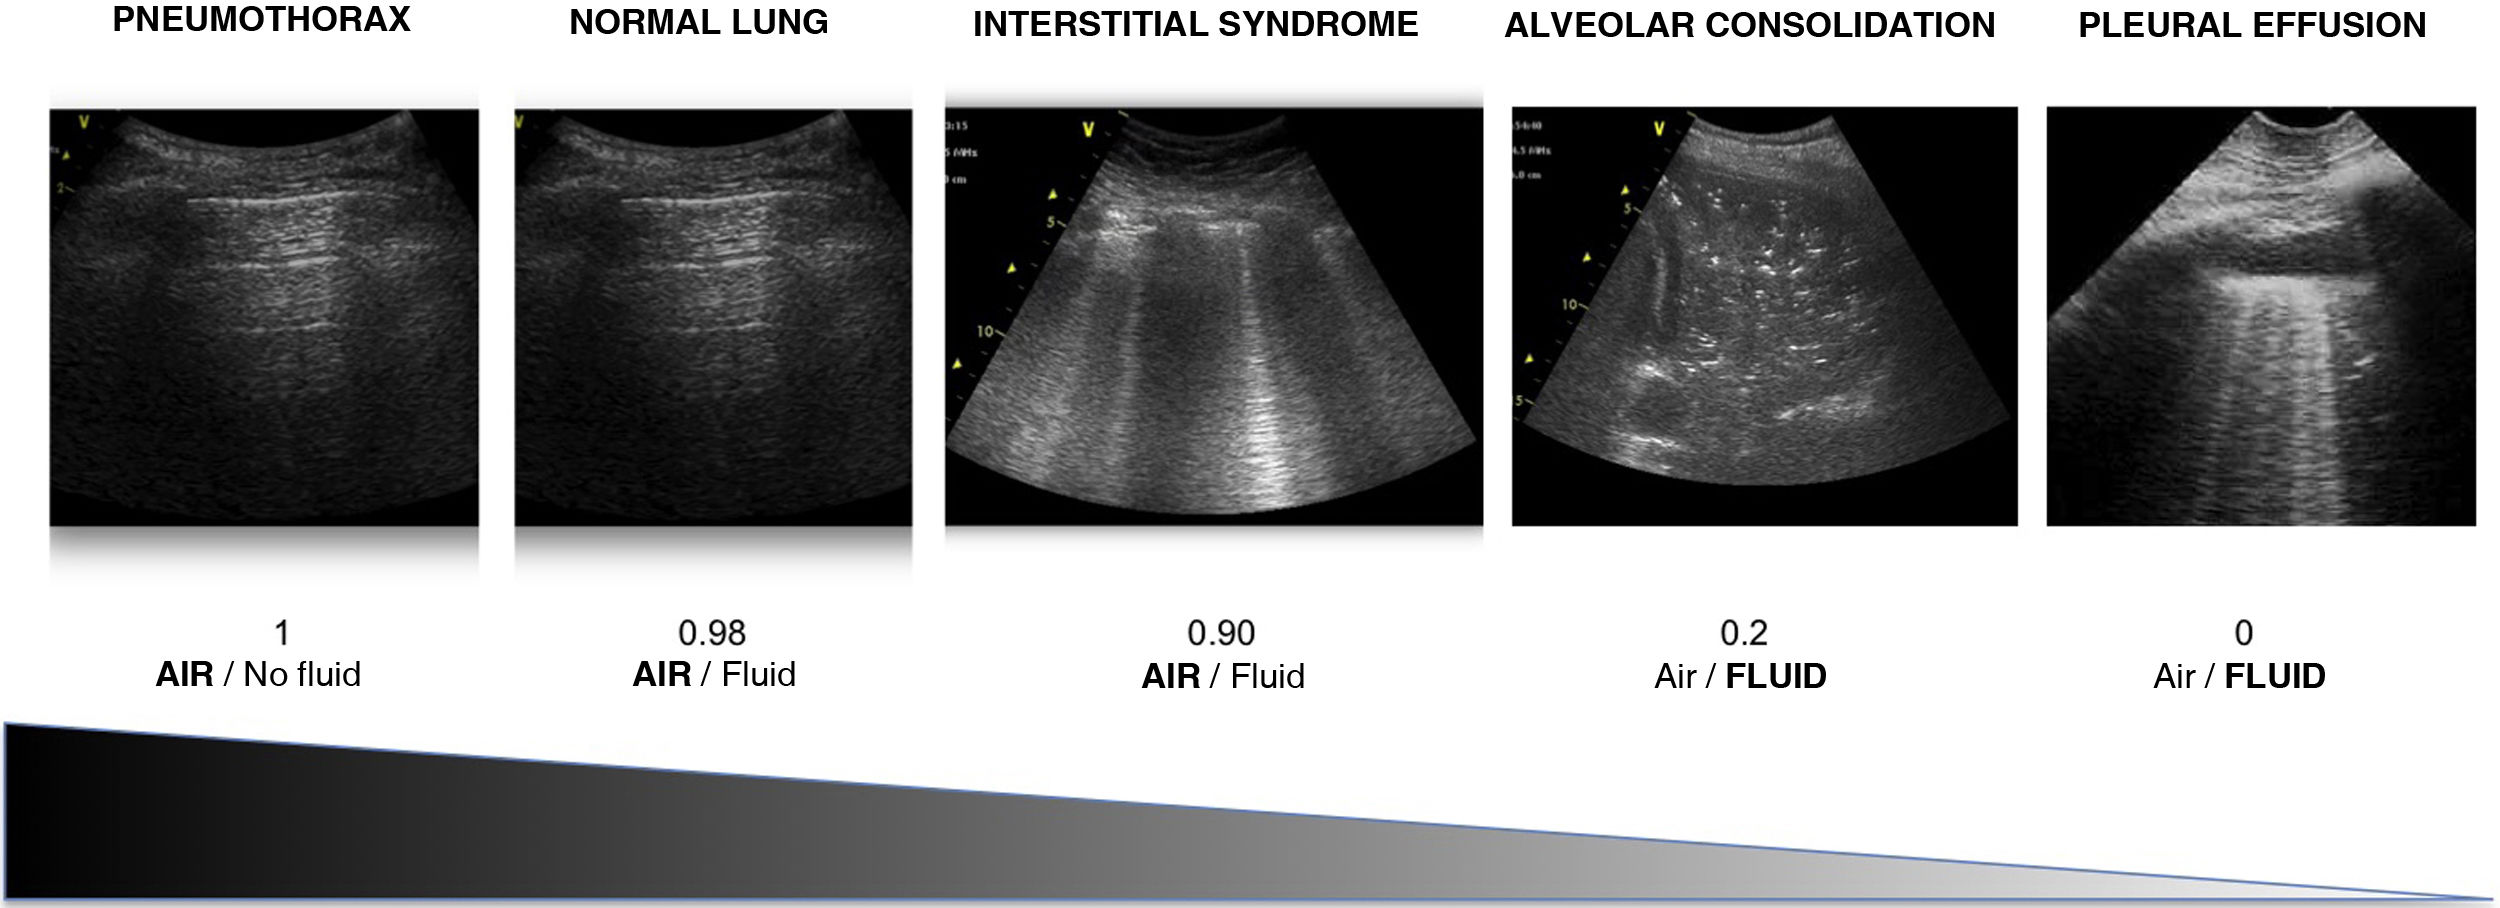
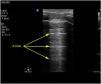
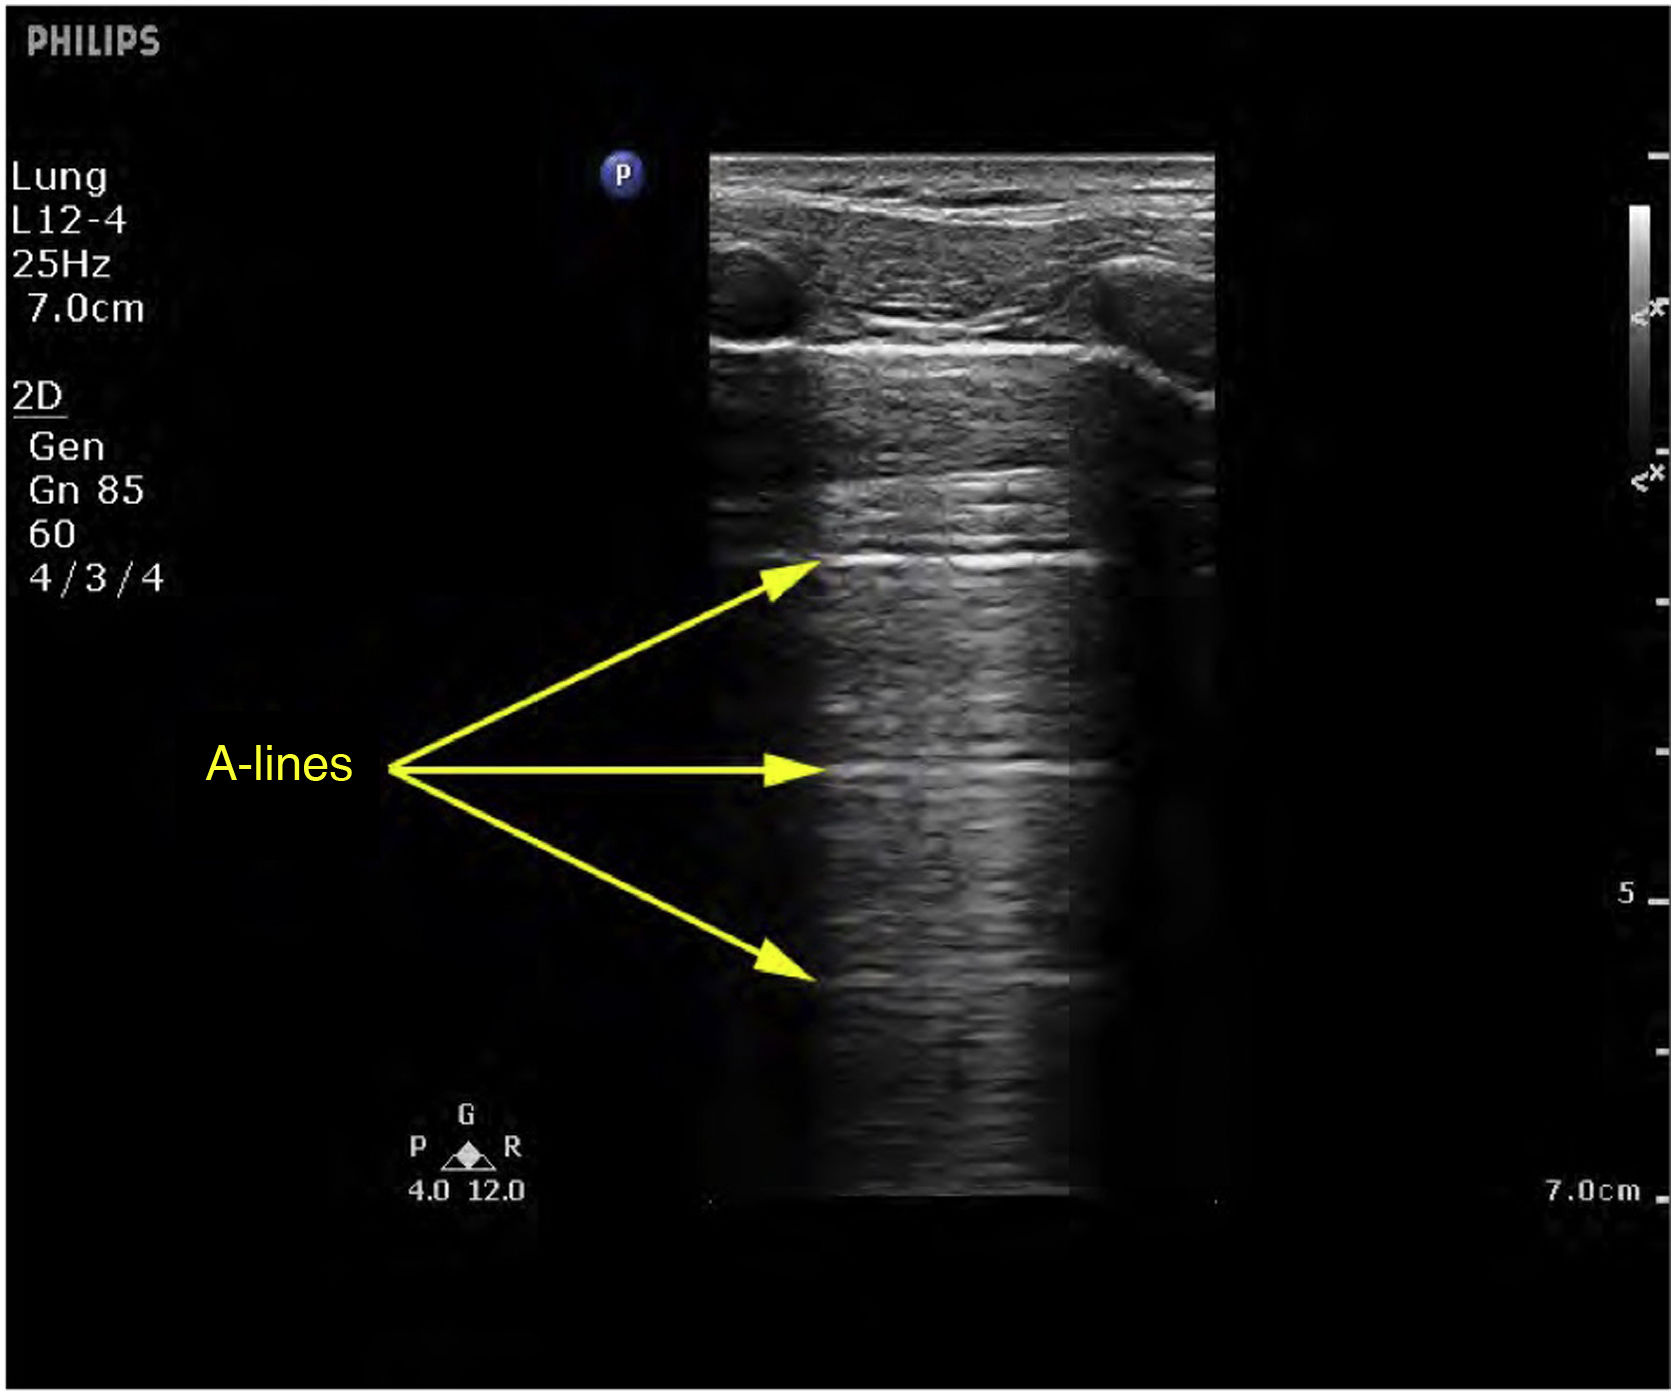
Pattern A: characterized by the presence of “sliding” (Video 1), and the artifacts defining it are the A-lines (Fig. 4).5,7 On exploring in M mode, we observe the “seashore sign” (Suppl. Fig. 2).5
Pattern A’: characterized by the absence of “sliding” and the presence of A-lines (Video 2). This pattern suggests the existence of pneumothorax. The latter is confirmed by the identification of the “lung point”, which is the point where the two pleural layers again slide over each other in the context of non-massive pneumothorax (Video 3).6
Pattern B: occupation of the pulmonary interstice by fluid, inflammatory products or fibrotic material gives rise to two regions with different acoustic impedance characteristics, exhibiting the artifacts typical of this pattern, the B lines (Video 4).6 In order to confirm a B pattern, we need to evidence three or more B lines between two ribs, in two or more regions, and separated by ≤ 7 mm.
Pattern B’: this is similar to the B pattern, with the absence of “sliding”. It is visualized in disorders such as acute respiratory distress syndrome (ARDS), pneumonias and lung fibrosis, where pleural adherences are produced that result in a decrease or absence of “sliding”, along with pleural thickening or the appearance of pleural anomalies (Video 5). Lung involvement is characteristically heterogeneous, with the appearance of different ultrasound patterns in the same patient.8
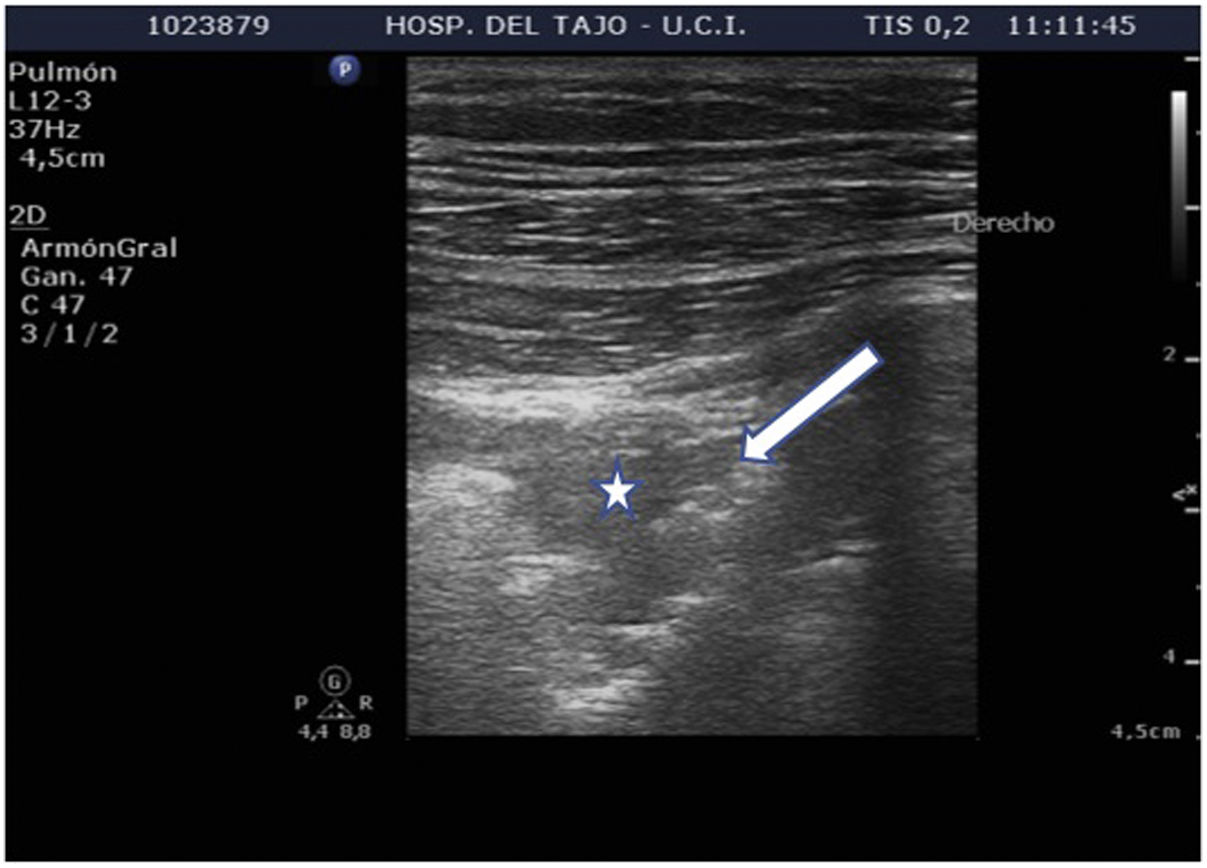
Pattern C: this is characterized by the “tissue-like sign” or “shred sign”. In the “tissue-like sign”, the echogenicity of the consolidated lung parenchyma is similar to that of the liver. Within the consolidated component we can visualize hyperechogenic images corresponding to the air bronchogram (Fig. 5). The “shred sign” in turn consists of consolidations of smaller size manifesting as a disruption of the pleural line, with an irregular or serrated margin that separates the consolidated component from the aerated lung (Fig. 6) (Video 6).5
Alveolar-interstitial syndrome (AIS)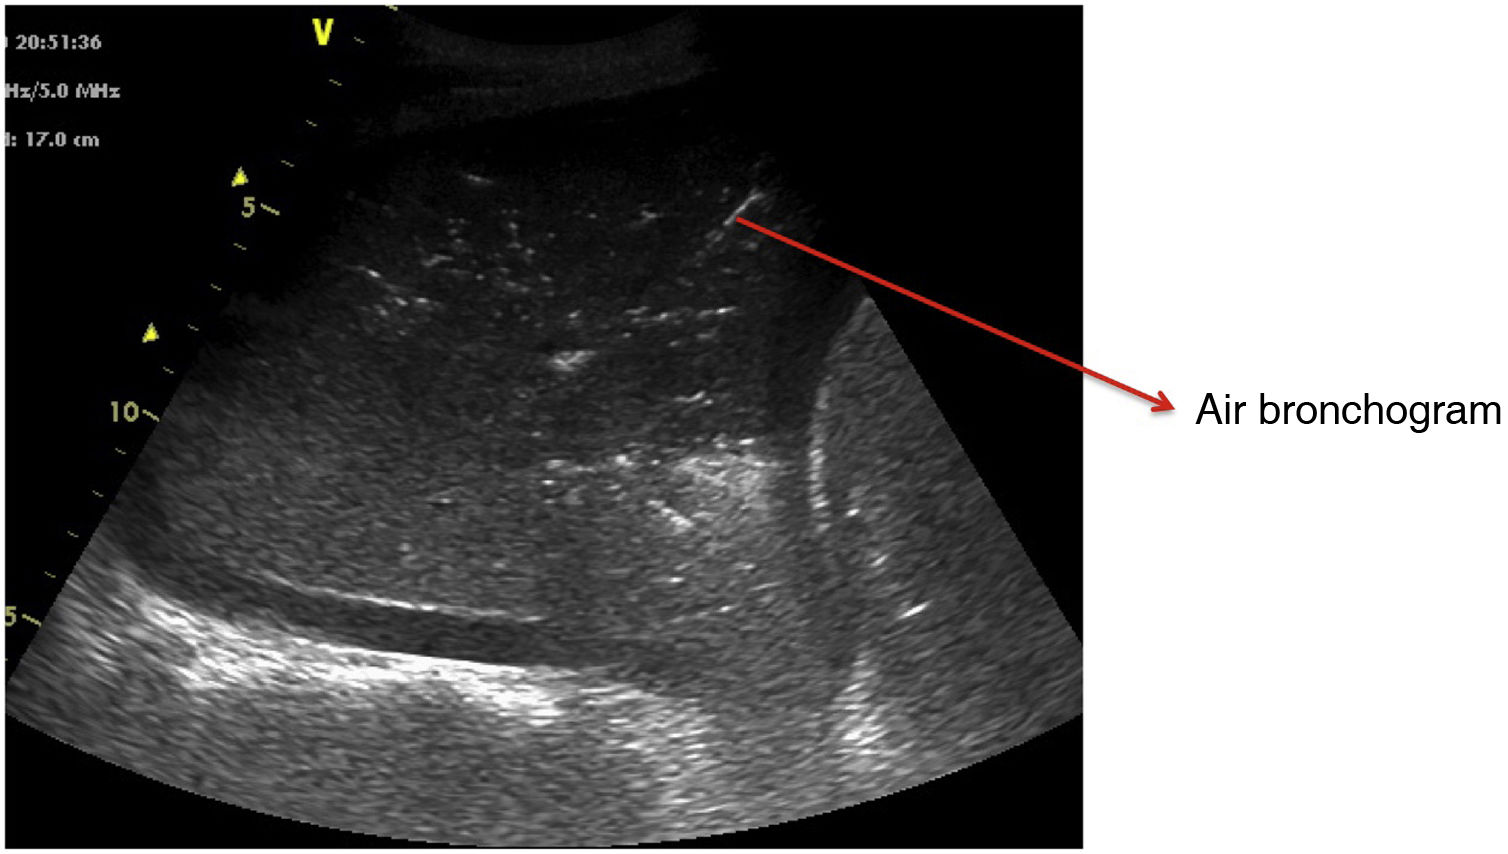
The relationship between the gas and fluid contents determines the images observed in lung ultrasound (Fig. 3), and these images change quickly during the clinical course of the patient. In this regard, AIS explored by ultrasound exhibits different patterns that reflect different underlying causes.
Interstitial patternThe interstitial pattern is characterized by the presence of multiple B lines of variable thickness and of symmetrical or asymmetrical distribution in the thorax. It may indicate both cardiogenic lung edema and any inflammatory process with an interstitial-alveolar infiltrate. In order to understand the cause underlying this pattern, we need to also explore cardiac function and preload.
The interstitial pattern includes the following findings: abundant bilateral or unilateral B lines, depending on the etiology, the possible appearance of condensation zones, and the possible presence of pleural effusion.
In AIS we observe B lines proportional to the degree of lung involvement. The presence of B lines separated by a distance of less than 3 mm is associated with alveolar edema, and corresponds to the ground glass pattern we see in the computed tomography (CT) scan.6,9–11 The number of B lines in each explored area is correlated to the fluid content11–14,16 (Suppl. Fig. 3).
The alveolar-interstitial syndrome appears in chronic (lung fibrosis) or acute diseases (acute lung edema of cardiogenic origin, ARDS, pneumonia) that manifest with deposits of proliferative tissue or fluid in the interstitial component. The appearance of abundant diffuse B lines on both sides of the chest supports the diagnosis of cardiogenic lung edema or ARDS. The unilateral presence of such lines in turn is suggestive of local inflammatory or pneumonic processes (Suppl. Fig. 4).
Pleural involvementThe alveolar-interstitial syndrome often manifests with inflammatory processes that affect the pleura. In this case, ultrasound reveals thickening or irregularity of the pleural line, in contrast to the very fine and homogeneous pleura of the normal lung or in the case of AIS secondary to cardiogenic lung edema (Suppl. Fig. 5).
The inflammatory changes that affect the pleura and the lung are also reflected in a decrease in normal pleural sliding, particularly if there is also a decrease in ventilation of the explored zone. This finding requires us to discard the existence of atelectasis in the same region. The complete absence of pleural sliding is observed in atelectasis, complete hepatization of the lung, pneumothorax, and the absence of ventilation in the explored lung of the intubated patient.
The presence of a fragmented pleural line (irregular or discontinuous) explored in M mode suggests that AIS is due to a non-cardiogenic cause.17,18
Subpleural condensationsSubpleural condensations appear as hypoechoic zones with poorly defined margins in contact with the pleura (Fig. 6), and usually are no larger than 1-2 cm in maximum diameter. They are generally found in the anterior zones of the thorax in patients in the supine position, and correspond to pulmonary inflammatory phenomena.
Alveolar consolidation or lung hepatization patternLung hepatization is described as a liver-like appearance of the consolidated lung seen at ultrasound exploration. This type of image is easier to visualize in supradiaphragmatic consolidations (Suppl. Fig. 6).
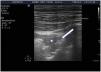
PneumothoraxWhen pneumothorax is suspected, ultrasound proves especially relevant in clinical scenarios such as chest traumatism, barotrauma associated with mechanical ventilation (MV), following central venous access catheterization, and in patients that are to be transferred by air. These situations can be found in a critical patients area or in an emergency service, where an ultrasound system preferably with a linear probe (7.5-12 MHz) should be available, in order to discard the presence of pneumothorax.
Related ultrasound signsThe following ultrasound findings are to be considered for detecting or discarding the presence of air in the pleural cavity (Suppl. Table 1)19:
- a
A lines (Fig. 4): These indicate the presence of air in the chest. This finding is always present in the diagnosis of pneumothorax.
- b
Absence of “lung sliding”: In the event of pneumothorax, pleural sliding disappears (Video 2), since the presence of gas (air) separates the two pleural layers. This finding is not pathognomonic of pneumothorax, as it can also be found in situations where the lung is not aerated (selective and esophageal intubations or atelectasis). The presence of pleural sliding discards pneumothorax with a negative predictive value and sensitivity of 100%.2 In the combined presence of A-lines and the absence of sliding, the sensitivity reaches 100% and specificity 96%.2
- c
B lines: The presence of at least one B line discards this diagnosis.
- d
Subcutaneous emphysema and E lines: The air that invades the soft tissues in the event of pneumothorax prevents us from identifying the pleural line. We then observe the E lines (Video 7), which are vertical lines that originate in superficial layers and which completely erase the pleural line, making it difficult to recognize any artifact in Merlin’s space.
- e
“Lung point”: This sign is pathognomonic of pneumothorax. It represents the point of pleural disruption, i.e., the point where the two pleural layers separate (Video 8). In the dynamic ultrasound view, we see the exact point where preserved pleural sliding (in inspiration) coexists with the absence of pleural sliding (in expiration), and we thus identify the exact point of the pleural tear. Failure to detect the “lung point” does not entirely rule out the presence of pneumothorax, as it would not be present in the case of massive pneumothorax. The more lateral and lower this point is located, the greater the extent of pneumothorax, with an even greater extent when located far posterior.
- f
“Bar code” or “stratosphere” sign: In M mode, this sign represents the absence of lung sliding. It consists of the identification of multiple horizontal lines of different echogenicity (Video 9).
- g
“Lung pulse”: In the absence of pleural sliding, the “lung pulse” represents transmission of the heartbeat over the collapsed or consolidated lung, excluding pneumothorax. In M mode, it is represented by the T lines described by Lichtenstein (Suppl. Fig. 7), which are narrow vertical lines arising from the pleural line in M mode.
In the event of chest pain or hemodynamic instability in a patient with COVID-19, ultrasound is a fundamental tool for diagnosing pulmonary embolism, pleural effusion or pneumothorax.
An irregular pleural line with subpleural consolidations and abundant B lines exhibiting a patchy distribution are typical ultrasound findings of COVID-19. We can also observe the “light beam” sign, described by Volpicelli et al., which manifests in the hyperacute phase of pneumonia as broad band-like vertical artifacts. These bands are bright and move quickly with lung sliding, exhibiting an “of/off” phenomenon during breathing, appearing and disappearing over a pattern of A lines.20
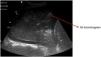
Pleural effusion (PE)Ultrasound assesses the volume (detecting millimetric magnitudes) and the characteristics of PE, guiding the site of puncture for evacuation of the effusion when needed. For this purpose, we ideally use a low-frequency convex probe (2.5-5 Hz), which sacrifices resolution in favor of greater ultrasound wave penetration capacity, reaching more in depth and visualizing the diaphragm and liver or spleen, and their relation to the lung parenchyma.
With the patient in the supine position, we place the probe on the mid-axillary line and locate the fundamental reference of the study: the diaphragm. All anechoic images above the diaphragm correspond to the chest cavity (pleural fluid). In contrast, such images located below the diaphragm correspond to the abdominal cavity (ascitic fluid)(Video 10).
Ultrasound signs related to pleural effusionPleural effusion is a genuine image, not an artifact. It is classically defined as an anechogenic component. The appearance of PE in critical patients is not always as described, however, since there may be coexisting hemothorax, complicated effusion and empyema, which are characterized by different degrees of echogenicity.
In terms of ultrasound exploration, PE is defined by the following signs:
- a
Quad sign (Suppl. Fig. 8): This is a static sign defined by a quadrilateral image with regular margins. The upper margin corresponds to the parietal pleura, the lower margin to the visceral pleura, and the lateral margins correspond to the shadows of two consecutive ribs.
- b
Sinusoid sign (Suppl. Fig. 8) (Video 11): This is a dynamic sign. In M mode it manifests as a sinusoid, reflecting the variation of the interpleural distance with the respiratory movements. In this regard, the distance is shorter during inspiration, while in expiration the two pleural layers are more separated. When the fluid is more viscous or shows septation, this sign may be absent.
Minor PE (almost not observable in the CT scan) is detected by ultrasound as the “quad sign” and “sinusoid sign” – hence the importance of evaluating them in the context of a thoracic ultrasound study.
- c
Jellyfish sign: In the presence of a significant amount of intrapleural fluid, the underlying lung collapses, and the parenchyma exhibits a static air bronchogram. The atelectatic lung is contained within the PE and in the lower zone appears floating freely within the fluid, generating the characteristic movement of the jellyfish sign (Video 12).
To date, no concrete ultrasound sign has been established that can firmly distinguish between transudate and exudate. What we can do, however, is interpret the appearance of the fluid. In this regard, we can observe simple PE (generally anechoic), complex septate or non-septate PE (generally corresponding to exudate)(Video 13), and diffuse echogenic fluid (often associated with the presence of fibrin or proteins). The plankton sign (Video 14) in turn consists of an echogenic dotted pattern floating freely in the PE. Although it may cause us to suspect a complicated PE, such differentiation cannot be firmly established.
Quantification of pleural effusionThe evaluation of PE can be made on a qualitative or quantitative basis. Qualitative estimation allows us to classify effusion as minimal, moderate or severe, while quantitative assessment requires the use of formulas.
Thoracic puncture poses risks, and we thus need a simple, rapid and rigorous formula to guide us in deciding the need for such puncture. One of the most widely used protocols is that proposed by Balik, due to its simplicity.21 It is carried out at approximately 15º with the patient in the supine position, and in expiration we record the greater diameter in the interpleural space (in millimeters). The value obtained is then multiplied by 20 to obtain the approximate amount in milliliters. This formula has been validated in mechanical ventilation.
Diaphragm ultrasoundThe diaphragm is the main respiratory muscle and consists of two hemidiaphragms, with double innervation. Contraction of the diaphragm causes it to displace the caudad, thus expanding the chest volume and generating negative pressure in spontaneous breathing. Many conditions can give rise to dysfunction of the diaphragm, and this can cause considerable problems in weaning from mechanical ventilation. Dysfunction of the diaphragm results from anatomical, neuromuscular or biomechanical problems that alter its contraction. Thoracic or abdominal conditions (atelectasis, surgery, etc.) and central or peripheral neurological disorders reduce diaphragmatic motility. This in turn results in hospital admission, the use or prolongation of mechanical ventilation and/or extubation failure.
The use of diaphragm ultrasound has increased and become consolidated in recent years, since it allows bilateral evaluation of both the morphology and function of the diaphragm in real-time, and monitoring of its function over time.22–25
The visualization of diaphragmatic kinetics in patients admitted to the ICU is crucial for the early and effective diagnosis of diaphragmatic paralysis and postoperative diaphragmatic dysfunction, and for the ideal timing of weaning from mechanical ventilation.22–29 A number of methods have been proposed for evaluating diaphragm function, though two options are mainly used: displacement or excursion of the diaphragmatic dome, and diaphragm thickness based on the thickening fraction (Video 15).22,26,30,31
Displacement or excursionThe measurement of displacement assesses the capacity of the diaphragm to generate volume changes in the thorax.29,31 The patient is placed in the supine position with the trunk raised 30º, and the hemidiaphragm is studied in 2D mode. For this purpose we adopt a subcostal approach, using a low-frequency convex probe at the mid-clavicular line, seeking the posterior third of the diaphragmatic dome on the right side, through the hepatic window (the probe is placed between the mid-clavicular line and the anterior axillary line, directing it medial, cranial and dorsal so that the ultrasound beam reaches the posterior third of the diaphragm)(Suppl. Fig. 9).22,26,28,30 On the left side, we use the splenic window, but the dome is more difficult to locate, generally due to the interposition of the abdominal organs (Suppl. Fig. 10). In order to obtain the best possible image, we place the probe in the inferior intercostal or subcostal zone between the mid-axillary and anterior axillary lines, or at the mid-clavicular level. The probe is displaced in a way similar to the right side to also visualize the posterior third. An alternative is to use the lateral approach, placing the probe perpendicular to the inferior intercostal spaces at the level of the mid-axillary line (Suppl. Fig. 10).22
After locating the dome in 2D mode, the M mode allows us to identify the portion of the dome with the greatest motility, measuring it in a sagittal view. On both sides, we observe a curved hyperechogenic line corresponding to the diaphragm (Suppl. Fig. 11). A curve reflecting the respiratory cycle is seen in which the upper part corresponds to the inspiratory phase (during inspiration, diaphragm motion is caudad and the line moves towards the probe) and the lower part to the expiratory phase (displacement is cranial and the line moves away from the probe)(Suppl. Fig. 11).30–32
In general, we interpret respiratory cycles corresponding to slow and deep breathing in patients under spontaneous breathing conditions, though measurement can also be made during nasal “sniffing” effort (little used in the ICU). In practical terms, we measure displacement in breathing under resting conditions (Suppl. Fig. 13) and in deep inspiration and expiration (Suppl. Figs. 11 and 12).
We trace a vertical line with the first calibrator at the base of the inspiratory curve, corresponding to the end of normal expiration, and with the second calibrator we focus on the peak of the inspiratory curve. The mean of the measurement of three or more cycles, or the highest value of 5 cycles, is recorded.
Several studies have evaluated excursion in healthy volunteers; the values are reported in Suppl. Table 2.27,31,32
Diaphragmatic thickening and thickening fractionThe measurement of diaphragmatic thickness is another method used to determine diaphragmatic muscle mass and assess the thickening fraction (TF).27,30–32,38,39
A high-frequency linear probe is used for this measurement, positioned at the last intercostal spaces (we place the probe on the anterior axillary line, generally perpendicular to intercostal spaces 7-8, 8-9 and 9-10, with the probe covering two ribs in order to visualize the diaphragm apposition zone)(Suppl. Fig. 13), ideally with the patient in the supine position. A somewhat more posterior position of the probe has also been described, between the anterior and mid-axillary lines. In this way, we locate the “apposition zone” where the diaphragm inserts into the chest wall. The diaphragm is identified as a hypoechoic band delimited by two hyperechoic lines corresponding to the pleura and peritoneum (Suppl. Fig. 14).22,31–35
The measurement of diaphragmatic thickness is made at the end of unforced expiration. It is advisable to record at least three images for the calculation. The normality reference figures vary among the different studies.35 A study of 109 healthy individuals reported normality figures of 0.16 ± 0.04 cm, with a mean value of 0.14 ± 0.03 cm in women and 0.19 ± 0.04 cm in men (Suppl. Fig. 15).36
In contrast to thickness alone, the variation in diaphragmatic thickness during inspiration allows an indirect assessment of diaphragmatic activity. The muscle fibers shorten during contraction and cause an increase in muscle thickness. This increase during inspiration has been used as an indirect measure of contractile capacity.
The TF is the ratio between the resting thickness and the thickness in maximum inspiration. It measures the percentage increase in thickness of the diaphragm during maximum inspiration with respect to its thickness at the end of unforced expiration (Suppl. Fig. 16).30–32 At least three measurements are advised for calculating this parameter at the end of maximum inspiration and at the end of unforced or resting expiration, recording the average of both in order to calculate TF (Suppl. Fig. 16) based on the following formula30–32,34–37:
A TF of over 20-30% is considered to be normal in healthy individuals. The absence of changes in thickness during inspiration is considered to be a sensitive and specific method for diagnosing diaphragmatic paralysis.38
ConclusionsA learning curve adjusted to the purpose, and sensitivity and specificity performance that comes close to that of CT in different situations of ARF, have caused thoracic-pleural and diaphragmatic ultrasound to be regarded as a crucial diagnostic tool in the management of the critical patient. It allows us to establish a differential diagnosis in critical situations, with immediate and repeated noninvasive monitoring of the therapeutic interventions. Growing knowledge of this technique is thus needed, and continued evaluation of its possibilities is required.
Conflicts of interestThe authors Diego Aníbal Rodríguez-Serrano, Purificación Pérez-Terán, Rafael Blancas, Marta Arroyo declare that they have no conflicts of interest in relation to the present article, that the study has received no funding.
Author contributionsThe authors Diego Aníbal Rodríguez-Serrano, Purificación Pérez-Terán, Rafael Blancas and Marta Arroyo have contributed equally to the writing and review of the present article.


- Home
- All contents
- Publish your article
- About the journal
- Metrics