


Edited by: Rosario Amaya Villar - Unidad de Cuidados Intensivos, Hospital Universitario Virgen del Rocio, Sevilla, España
Last update: December 2023
More infoTo specify the degree of probative force of the statistical hypotheses in relation to mortality at 28 days and the threshold value of 17 J/min mechanical power (MP) in patients with respiratory failure secondary to SARS-CoV-2.
DesignCohort study, longitudinal, analytical.
SettingIntensive care unit of a third level hospital in Spain.
PatientsPatients admitted for SARS-CoV-2 infection with admission to the ICU between March 2020 and March 2022.
InterventionsBayesian analysis with the beta binomial model.
Main variables of interestBayes factor, mechanical power.
ResultsA total of 253 patients were analyzed. Baseline respiratory rate (BF10: 3.83 × 10⁶), peak pressure value (BF10: 3.72 × 10¹³) and neumothorax (BF10: 17,663) were the values most likely to be different between the two groups of patients compared. In the group of patients with MP < 17 J/min, a BF10 of 12.71 and a BF01 of 0.07 were established with an 95%CI of 0.27–0.58. For the group of patients with MP ≥ 17 J/min the BF10 was 36,100 and the BF01 of 2.77e-05 with an 95%CI of 0.42–0.72.
ConclusionsA MP ≥ 17 J/min value is associated with extreme evidence with 28-day mortality in patients requiring MV due to respiratory failure secondary to SARS-CoV-2 disease.
Precisar el grado de fuerza probatoria de las hipótesis estadísticas con relación a la mortalidad a 28 días y el valor umbral de 17 J/min de potencia mecánica (PM) en pacientes con insuficiencia respiratoria secundaria a SARS-CoV-2.
DiseñoEstudio de cohortes, longitudinal y analítico.
ÁmbitoUnidad de cuidados intensivos de un hospital de tercer nivel en España.
PacientesEnfermos ingresados por infección por SARS-CoV-2 con ingreso en la UCI entre marzo de 2020 y marzo de 2022.
IntervencionesAnálisis bayesiano con el modelo binomial beta.
Variables de interés principalesFactor de Bayes, mechanical power.
ResultadosFueron analizados 253 pacientes. La frecuencia respiratoria inicial (BF10: 3,83 × 10⁶), el valor de la presión pico (BF10: 3,72 × 10¹³) y el desarrollo de neumotórax (BF10: 17.663) fueron los valores con más probabilidad de ser diferentes entre los 2 grupos de pacientes comparados. En el grupo de pacientes con PM < 17 J/min se estableció un BF10 de 12,71 y un BF01 de 0,07 con un IdC95% de 0,27-0,58; Para el grupo de pacientes con PM ≥ 17 J/min el BF10 fue de 36.100 y el BF01 de 2,77e-05 con un IdC95% de 0,42-0,72.
ConclusionesUn valor de PM ≥ 17 J/min se asocia con una evidencia extrema con la mortalidad a 28 días en pacientes que necesitaron ventilación mecánica por insuficiencia respiratoria secundaria a enfermedad por SARS-CoV-2.
Mechanical power (MP) in lung ventilation, defined as the energy delivered from the ventilator to the respiratory system during a period of time, has been recognized as a promising indicator for evaluating ventilator-induced lung injury (VILI) and for predicting the outcome of ventilated patients.1
There may be an MP safety threshold above which lung injury is inevitable. Recently, different studies in patients with lung injury secondary to SARS-CoV-2 disease have found that an MP threshold of 17 J/min could be associated with an increased mortality risk.2,3
In this context, where a statistically significant association (p < 0.05) is observed between in-hospital mortality and an MP threshold of 17 J/min in patients with acute respiratory distress syndrome (ARDS) secondary to SARS-CoV-2 infection, it seems advisable (as is also seen in other settings) to replicate the clinical investigations based on significance tests, with a view to generating more credible evidence in the intensive care setting.4–6
This can be done through Bayesian inference, which allows us to reanalyze significant findings, and where the Bayes factor (BF) is referred to as the probability of the data under one hypothesis in relation to another (null hypothesis versus the alternative hypothesis). In other words, BF estimates the degree or evidence with which the data support both the null hypothesis and the alternative hypothesis, contrasting them beyond the conventional dichotomic interpretation of rejection or acceptance of the null hypothesis.7,8 The statistical repetition of significant findings based on BF reinforces the practical credibility of future articles, which is indicated when Bayesian inference generates conclusive (strong) or greater evidence (BF10 > 10) from the interpretation of the Jeffreys classification of values for BF: anecdotal, moderate, strong and very strong.9
The present study was carried out to establish the demonstrative strength of statistical hypotheses in relation to 28-day mortality and an MP threshold value of 17 J/min in patients with respiratory failure secondary to SARS-CoV-2 infection, based on Bayesian analysis.
Material and methodsAn analytical, observational cohort study was made of all the patients admitted to the Intensive Care Unit (ICU) due to SARS-CoV-2 infection between March 2020 and March 2022. The data were obtained from the COVID-19 patient cohort registry of the Department of Intensive Care Medicine of a third-level hospital, following approval from the local Ethics Committee and the obtainment of consent (written and/or by telephone) from the patients or their legal representatives.
Sampling was consecutive, and the patients were divided into two cohorts according to the MP value in the first 24 h after orotracheal intubation: MP < 17 J/min and MP ≥ 17 J/min. The measurement of MP was carried out using the simplified formula proposed by Gattinoni et al.10
The inclusion criteria were: patients over 18 years of age, a confirmed diagnosis of SARS-CoV-2 disease, need for admission to the ICU, and the use of controlled mechanical ventilation (CMV) with a correct recording of the variables required to calculate MP in the supine position, following sedation and neuromuscular block (where needed), within the first 24 h of mechanical ventilation.
The patient clinical-demographic parameters (age, gender, cardiovascular risk factors, smoking) were recorded, as well as the specific treatments applied in the ICU, initial ventilatory parameters (tidal volume, respiratory rate, positive end-expiratory pressure [PEEP], plateau pressure, compliance, driving pressure) and evolutive parameters.
A first descriptive analysis of the sample was made in which categorical variables were reported as frequencies and percentages, while continuous quantitative variables were reported as the median and percentiles 25–75 (p25–75). The comparison of continuous quantitative variables was carried out with the Bayesian t-test for independent samples. The comparison of frequencies in turn was carried out based on contingency tables and Poisson BF10. In all the tests, the alternative hypothesis specifies that the MP < 17 J/min group is not the same as the MP ≥ 17 J/min group. Lastly, a Bayesian analysis was performed with the beta-binomial model. The null hypothesis (H0) postulated that MP < 17 J/min was associated with 28-day mortality, while the alternative hypothesis (H1) postulated that MP ≥ 17 J/min was associated with 28-day mortality. Based on our previous findings,3 an a priori 28-day mortality rate of 21.5% was considered (the alternative hypothesis specifies the proportion as >0.21). The prior distribution under the alternative hypothesis was specified with beta (1.1). The results are shown with BF10 (in favor of the alternative hypothesis) and BF01 (in favor of the null hypothesis), with a 95% credible interval.
The statistical analysis was carried out using the JASP 2023 package (version 0.17).
ResultsDuring the analyzed period, a total of 911 patients were admitted to the ICU due to SARS-CoV-2 disease, and 552 met the study inclusion criteria. The data needed for the analysis were obtained from a total of 253 patients, which were divided into two groups according to MP in the first 24 h of mechanical ventilation (MV).
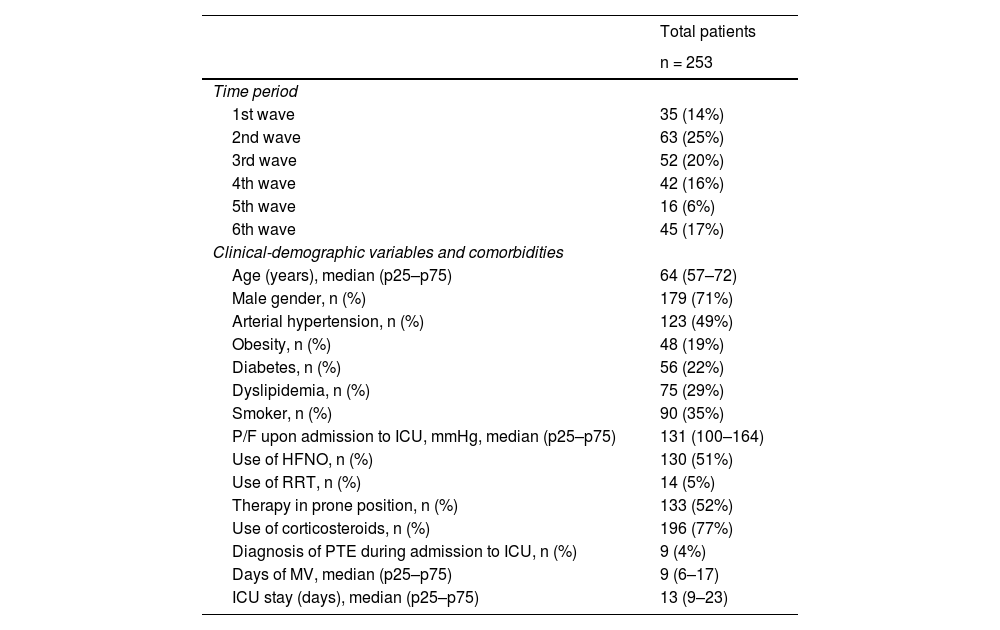
The median age was 64 years (p25–75: 57–72), and most of the patients were men (n = 179; 71%). The principal characteristics of the 253 subjects are reported in Table 1.
Principal variables of the study cohort.
| Total patients | |
|---|---|
| n = 253 | |
| Time period | |
| 1st wave | 35 (14%) |
| 2nd wave | 63 (25%) |
| 3rd wave | 52 (20%) |
| 4th wave | 42 (16%) |
| 5th wave | 16 (6%) |
| 6th wave | 45 (17%) |
| Clinical-demographic variables and comorbidities | |
| Age (years), median (p25–p75) | 64 (57–72) |
| Male gender, n (%) | 179 (71%) |
| Arterial hypertension, n (%) | 123 (49%) |
| Obesity, n (%) | 48 (19%) |
| Diabetes, n (%) | 56 (22%) |
| Dyslipidemia, n (%) | 75 (29%) |
| Smoker, n (%) | 90 (35%) |
| P/F upon admission to ICU, mmHg, median (p25–p75) | 131 (100–164) |
| Use of HFNO, n (%) | 130 (51%) |
| Use of RRT, n (%) | 14 (5%) |
| Therapy in prone position, n (%) | 133 (52%) |
| Use of corticosteroids, n (%) | 196 (77%) |
| Diagnosis of PTE during admission to ICU, n (%) | 9 (4%) |
| Days of MV, median (p25–p75) | 9 (6–17) |
| ICU stay (days), median (p25–p75) | 13 (9–23) |
P/F: ratio between partial pressure of oxygen and fraction of inspired oxygen, HFNO: high-flow nasal oxygen, MV: mechanical ventilation, RRT: renal replacement therapy, PTE: pulmonary thromboembolism.
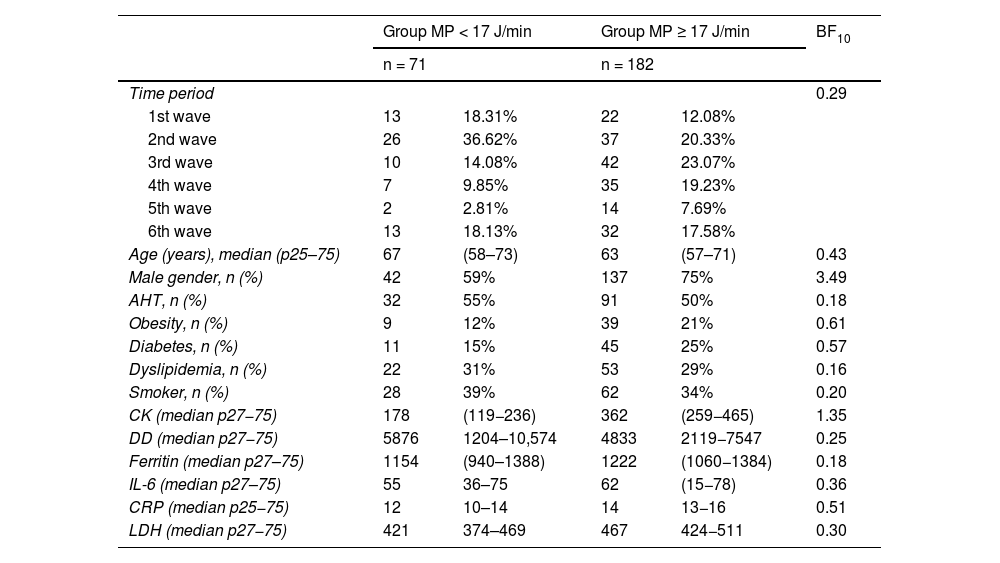
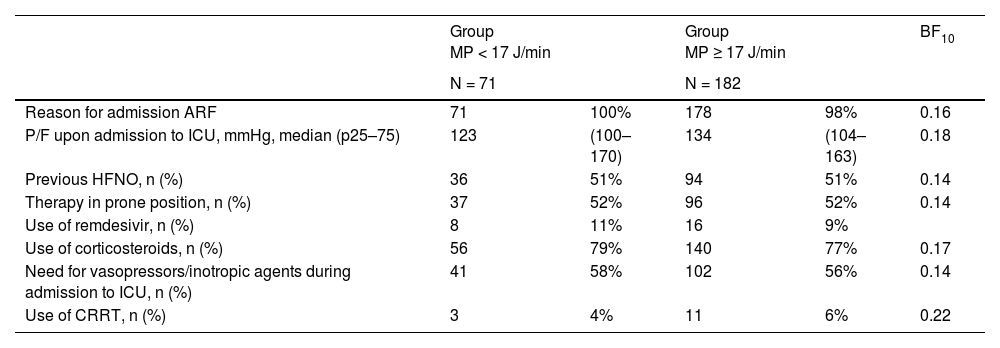
The comparative analysis of the clinical-demographic parameters between the two groups (Table 2) revealed differences in gender distribution (BF10: 3.49) and creatine kinase (BF10: 1.35). The variables referred to the treatments provided during ICU stay showed no relevant differences (Table 3).
Comparison of the clinical-epidemiological characteristics of the patients by study groups.
| Group MP < 17 J/min | Group MP ≥ 17 J/min | BF10 | |||
|---|---|---|---|---|---|
| n = 71 | n = 182 | ||||
| Time period | 0.29 | ||||
| 1st wave | 13 | 18.31% | 22 | 12.08% | |
| 2nd wave | 26 | 36.62% | 37 | 20.33% | |
| 3rd wave | 10 | 14.08% | 42 | 23.07% | |
| 4th wave | 7 | 9.85% | 35 | 19.23% | |
| 5th wave | 2 | 2.81% | 14 | 7.69% | |
| 6th wave | 13 | 18.13% | 32 | 17.58% | |
| Age (years), median (p25–75) | 67 | (58–73) | 63 | (57–71) | 0.43 |
| Male gender, n (%) | 42 | 59% | 137 | 75% | 3.49 |
| AHT, n (%) | 32 | 55% | 91 | 50% | 0.18 |
| Obesity, n (%) | 9 | 12% | 39 | 21% | 0.61 |
| Diabetes, n (%) | 11 | 15% | 45 | 25% | 0.57 |
| Dyslipidemia, n (%) | 22 | 31% | 53 | 29% | 0.16 |
| Smoker, n (%) | 28 | 39% | 62 | 34% | 0.20 |
| CK (median p27−75) | 178 | (119−236) | 362 | (259−465) | 1.35 |
| DD (median p27−75) | 5876 | 1204–10,574 | 4833 | 2119−7547 | 0.25 |
| Ferritin (median p27–75) | 1154 | (940–1388) | 1222 | (1060−1384) | 0.18 |
| IL-6 (median p27–75) | 55 | 36–75 | 62 | (15−78) | 0.36 |
| CRP (median p25−75) | 12 | 10–14 | 14 | 13−16 | 0.51 |
| LDH (median p27−75) | 421 | 374–469 | 467 | 424−511 | 0.30 |
AHT: arterial hypertension; creatine kinase (CK in U/L, normal range: 46–171), D-dimer (DD in ng/mL, normal range: 0–500), ferritin (in ng/mL, normal range: 22–322), interleukin-6 (IL-6), C-reactive protein (CRP in mg/dL, normal range: ≤0.5), lactate dehydrogenase (LDH in U/L, normal range: 120–246); BF: Bayes factor.
Comparative analysis between groups of the principal variables associated with acute respiratory failure and therapeutic measures in the ICU.
| Group MP < 17 J/min | Group MP ≥ 17 J/min | BF10 | |||
|---|---|---|---|---|---|
| N = 71 | N = 182 | ||||
| Reason for admission ARF | 71 | 100% | 178 | 98% | 0.16 |
| P/F upon admission to ICU, mmHg, median (p25–75) | 123 | (100–170) | 134 | (104–163) | 0.18 |
| Previous HFNO, n (%) | 36 | 51% | 94 | 51% | 0.14 |
| Therapy in prone position, n (%) | 37 | 52% | 96 | 52% | 0.14 |
| Use of remdesivir, n (%) | 8 | 11% | 16 | 9% | |
| Use of corticosteroids, n (%) | 56 | 79% | 140 | 77% | 0.17 |
| Need for vasopressors/inotropic agents during admission to ICU, n (%) | 41 | 58% | 102 | 56% | 0.14 |
| Use of CRRT, n (%) | 3 | 4% | 11 | 6% | 0.22 |
ARF: acute respiratory failure; P/F: ratio between partial pressure of oxygen and fraction of inspired oxygen, HFNO: high-flow nasal oxygen, MV: mechanical ventilation, CRRT: continuous renal replacement therapy, BF: Bayes factor.
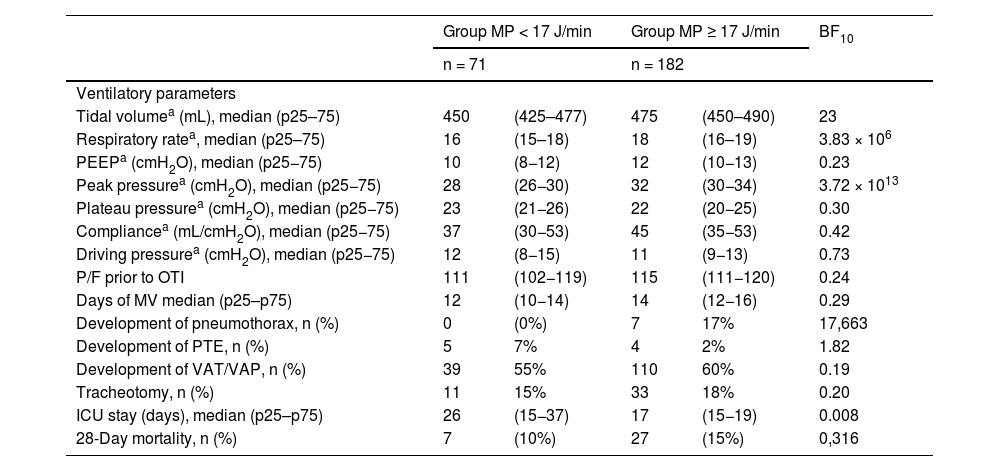
As can be seen in Table 4, the initial respiratory rate (BF10: 3.83 × 10⁶), peak pressure (BF10: 3.72 × 10¹³) and the development of pneumothorax (BF10: 17,663) were the parameters most likely to be different between the two groups.
Comparative analysis of the principal evolutive variables during admission to the ICU.
| Group MP < 17 J/min | Group MP ≥ 17 J/min | BF10 | |||
|---|---|---|---|---|---|
| n = 71 | n = 182 | ||||
| Ventilatory parameters | |||||
| Tidal volumea (mL), median (p25–75) | 450 | (425–477) | 475 | (450–490) | 23 |
| Respiratory ratea, median (p25–75) | 16 | (15–18) | 18 | (16–19) | 3.83 × 10⁶ |
| PEEPa (cmH2O), median (p25−75) | 10 | (8−12) | 12 | (10−13) | 0.23 |
| Peak pressurea (cmH2O), median (p25−75) | 28 | (26−30) | 32 | (30−34) | 3.72 × 10¹³ |
| Plateau pressurea (cmH2O), median (p25−75) | 23 | (21−26) | 22 | (20−25) | 0.30 |
| Compliancea (mL/cmH2O), median (p25−75) | 37 | (30−53) | 45 | (35−53) | 0.42 |
| Driving pressurea (cmH2O), median (p25−75) | 12 | (8−15) | 11 | (9−13) | 0.73 |
| P/F prior to OTI | 111 | (102−119) | 115 | (111−120) | 0.24 |
| Days of MV median (p25–p75) | 12 | (10−14) | 14 | (12−16) | 0.29 |
| Development of pneumothorax, n (%) | 0 | (0%) | 7 | 17% | 17,663 |
| Development of PTE, n (%) | 5 | 7% | 4 | 2% | 1.82 |
| Development of VAT/VAP, n (%) | 39 | 55% | 110 | 60% | 0.19 |
| Tracheotomy, n (%) | 11 | 15% | 33 | 18% | 0.20 |
| ICU stay (days), median (p25–p75) | 26 | (15−37) | 17 | (15−19) | 0.008 |
| 28-Day mortality, n (%) | 7 | (10%) | 27 | (15%) | 0,316 |
MV: mechanical ventilation; P/F: ratio between partial pressure of oxygen and fraction of inspired oxygen, OTI: orotracheal intubation, PTE: pulmonary thromboembolism, VAT: ventilator-associated tracheobronchitis, VAP: ventilator-associated pneumonia, ICU: Intensive Care Unit, BF: Bayes factor.
All analyzed patients were under volume control ventilation (protective ventilation was carried out based mainly on an initial tidal volume of 6−8 mL/kg ideal body weight), and measurement was made of the variables needed to calculate MP (measurement of plateau pressure with inspiratory pause) in the supine position, after optimization of the ventilatory parameters according to medical criterion following deep sedation and/or neuromuscular block, within the first 24 h of mechanical ventilation.
The Bayesian binomial contrast yielded the following results: in the group of patients with MP < 17 J/min (Fig. 1A), BF10 was 12.71 — indicating that the evidence in favor of the alternative hypothesis (i.e., postulating that there is a real difference between the groups) was 12.71 times stronger than the evidence in favor of the null hypothesis (i.e., postulating that there is no real difference between the groups). The 95% credible interval for the proportion of patients in this group was 0.27–0.58. In the group of patients with MP ≥ 17 J/min (Fig. 1B), BF10 was much greater (36,100) — indicating strong evidence in favor of the alternative hypothesis. The 95% credible interval for the proportion of patients in this group was 0.42–0.72.
, the Bayes factor in favor of the alternative hypothesis (i.e., postulating that the proportion of patients below the threshold point is greater) was 12.71 times stronger than in favor of the null hypothesis (i.e., that the proportion is the same). The 95% credible interval for the difference of proportions was 0.27–0.58, indicating that it is probable that the proportion in the group with MP < 17 J/min is significantly greater than in the group with MP ≥ 17 J/min. On the other hand, in the group of patients with MP ≥ 17 J/min (Fig. 1B), the Bayes factor in favor of the alternative hypothesis (i.e., postulating that the proportion of patients below the threshold point is smaller) was 36,100, which suggests strong evidence in favor of the alternative hypothesis versus the null hypothesis. The 95% credible interval for the difference of proportions was 0.42–0.72, indicating that it is probable that the proportion in the group with MP ≥ 17 J/min is significantly smaller than in the group with MP < 17 J/min.")
Before and after graphic representation of the degrees of inference of the Bayesian binomial contrast and the sequential analysis.
The results indicate that in the group of patients with MP < 17 J/min (Fig. 1A), the Bayes factor in favor of the alternative hypothesis (i.e., postulating that the proportion of patients below the threshold point is greater) was 12.71 times stronger than in favor of the null hypothesis (i.e., that the proportion is the same). The 95% credible interval for the difference of proportions was 0.27–0.58, indicating that it is probable that the proportion in the group with MP < 17 J/min is significantly greater than in the group with MP ≥ 17 J/min. On the other hand, in the group of patients with MP ≥ 17 J/min (Fig. 1B), the Bayes factor in favor of the alternative hypothesis (i.e., postulating that the proportion of patients below the threshold point is smaller) was 36,100, which suggests strong evidence in favor of the alternative hypothesis versus the null hypothesis. The 95% credible interval for the difference of proportions was 0.42–0.72, indicating that it is probable that the proportion in the group with MP ≥ 17 J/min is significantly smaller than in the group with MP < 17 J/min.
In both cases BF01 (which measures the evidence in favor of the null hypothesis) was very low — indicating strong evidence in favor of the alternative hypothesis. The graphic representation and sequential analysis are shown in Fig. 1.
DiscussionThe present study supports the significant finding previously published by our working group,3 with extreme evidence in favor of the alternative hypothesis: MP ≥ 17 J/min was seen to be associated with 28-day mortality in patients requiring mechanical ventilation due to respiratory failure secondary to SARS-CoV-2 disease.
With the applicability and interpretability of our results in clinical practice in mind, the “transformation” of the “weight of evidence” (decimal logarithm of the Bayes factor) indicates that the weight of evidence of MP ≥ 17 J/min being associated with 28-day mortality is 45 decibans (dB), while the negative evidence that this association exists is −17 decibans. Considering that a deciban is the smallest change in the weight of evidence that can be directly perceived through human intuition, it can be affirmed that an MP threshold value of 17 J/min is an excellent 28-day mortality indicator. We consider that the use of decibans in these studies may be very illustrative, since the logarithmic transformation of BF means that both weights of evidence are expressed on a single measurement scale. A positive deciban could be used to confirm a disease or a prognostic marker, and a negative deciban could be used to discard it.11,12
However, in order to correctly interpret the data, it is important to take into account that in relation to the a posteriori distribution in the graphic representation, the data focus on values for the estimated mean parameter theta of about 40% and 56%, respectively (with a 28-day mortality of 10% and 15% for the two analyzed groups). This suggests that the distribution of the parameter theta is not symmetrical and shows tail weighting on the right side of the distribution. In other words, there is a greater probability that theta will have higher values than expected if the distribution were symmetrical. This information is important, because it suggests that the estimated parameter theta may be biased towards higher values. In addition, the a posteriori distribution may also indicate that the estimation of the 28-day mortality rate is more uncertain than would be expected if the sample were larger and the population more homogeneous. This is because the a posteriori distribution reflects uncertainty in the estimation of theta from the limited information of the sample. On the other hand, it cannot be ruled out that although the data in the table constitute a representative sample of the population, the values estimated a posteriori in the graphic representation reflect greater uncertainty in the estimation of 28-day mortality, due to a smaller sample or greater variability in the population.13–15
In 2018, the researchers of the PROVE network,16 through a post hoc analysis of the high-resolution database Medical Information Mart for Intensive Care (MIMIC-III) and the eICU Collaborative Research Database (eICU),17–19 reported the first clinical investigation on the hypothesis that MP generated by the ventilator is associated to patient-centered outcomes. The authors summarized their findings under the following four points: (1) MP in the second 24-h period of ventilation is independently associated with increased in-hospital mortality among critical patients subjected to invasive ventilation for over 48 h; (2) increased MP is independently associated to increased ICU mortality, fewer days without ventilation, an increased probability of survival at day 28, and a longer hospital and ICU stay; (3) the impact of MP is consistent and independent of the presence of ARDS or the use of neuromuscular block; and (4) even with low tidal volume and driving pressure, a high MP is associated with poorer patient outcomes — suggesting that MP contributes additional information beyond volume and pressure.
Our results are consistent in part with the conclusions of Neto et al.,13 and of later studies. In this sense, and based on frequentist inferential statistics, Schuijt et al. analyzed the data of the PRoVENT-COVID study (a multicenter trial involving a cohort of 825 patients and with ventilation parameters corresponding to the first day of exposure to mechanical ventilation) and found MP to be independently associated to 28-day mortality (hazard ratio [HR]: 1.17 (95% confidence interval [95%CI]: 1.01–1.36); p = 0.031). Likewise, quartile increments of MP, stratified according to driving pressure values, were seen to increase this 28-day mortality risk (HR: 1.15 (95%CI: 1.01–1.30); p = 0.028).20 In this regard, Urmer et al.,21 with the data of over 13,000 patients and using Bayesian models to estimate the strength of the association to ICU mortality, not only confirmed the correlation between MP and mortality (HR: 1.060, 95% credible interval: 1.053–1.066), but also found this association to persist for the duration of mechanical ventilation.
With the data presented and based on our Bayesian analysis, we further consolidate our opinion that the findings were to be expected, considering that MP is a variable that includes all the components that may cause ventilator-induced lung injury (VILI): pressure, volume, flow and respiratory rate. Nevertheless, MP must be normalized with respect to the ventilated lung surface, considering the relationship between MP and the alveolar area exposed to the energy delivered as “intensity”.22
Our study has the limitations inherent to retrospective analytical cohort studies conducted in a single center. On the other hand, the variations of the study variables in relation to time were not available; our results therefore might not be extrapolatable to those of other studies. Although our data evidence a significant association between 28-day mortality and MP in the first 24 h, it is important to take into account that this variable alone does not reflect the complexity and the evolution of the disease in the long term. Furthermore, a change is observed in the Bayes factor (BF) curves (the two subgroups show a notorious inflection point around patient #20) suggesting that the population of subjects included in the study is not homogeneous — a fact that may have important implications when interpreting the results of the study. It is important to remember that regardless of the possible bias introduced by the loss of an important number of patients for analysis, the study cohort is set within the context of two years of the COVID-19 pandemic and 6 waves of the disease in which there have been modifications that could justify the described observations: evolution of the virus itself, the age and health conditions of the patients, vaccination, and knowledge of the different COVID-19 related ARDS (CARDS) phenotype, among others.
There is no single statistical method. With the frequentist approach it is only acceptable to assign probabilities to random phenomena that can be defined through experiments which can be repeated many times and always under identical and independent conditions. Bayesian probability is applied to any random events — both those that can be repeated under the conditions demanded by frequentist probability, and those that cannot. Bayesian methodology is a fundamental tool for sequentially updating the relevant information of a study. Accordingly, following a first analytical phase, the knowledge generated will serve to start a new learning process incorporating new information about the problem.23
Although our data suggest that MP ≥ 17 J/min is associated with extreme evidence of 28-day mortality in patients requiring mechanical ventilation due to respiratory failure secondary to SARS-CoV-2 disease, it is difficult to extrapolate the influence of MP at a given moment to the entire trajectory of the disease condition over time — particularly considering that mechanical ventilation in itself is a prolonged and complex process in which patients may experience significant changes in their clinical condition and prognosis. It is important to recognize the complexity of the disease and that a variable such as MP in the first 24 h may be useful but not enough to fully explain the patient’s prognosis.
Conflict of interestAll the authors have collaborated in preparation of the manuscript and declare that they have no conflicts of interest in relation to the present study.
Author contributionsAlejandro González-Castro: Study conception, development and preparation of the manuscript.
Elena Cuenca-Fito: Study development and data compilation.
Yhivian Peñasco: Study development and revision.
Vicent Modesto: Revision of the statistical analysis.
Patricia Escudero-Acha: Revision.
Carmen Huertas: Screening of the database.
Juan Carlos Rodríguez-Borregán: Study development and revision.

